Navigation: Home | Matrixs | Plots
## Plot Usage
**Intro:**
Maths.js can be used as a wrapper around [plotly](https://github.com/plotly/plotly.js) for powerful and simple visualization of data. Note, to keep the size of the overall library down, plotly is not included in Maths.js and must be included externally.
## Library Usage
**Maths.js with Plotting**
```html
```
## Examples:
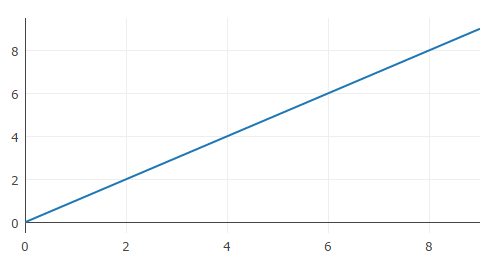
**Ultra basic example:**
This example generates a basic plot and will append it to your HTML body. You can specify a specific div by adding options object {div:'yourDiv'}.
```js
var x = Matrixs.range(10);
Plots.create(x);
//Plots.create(x,{div:'yourDiv'}); use this to specify a specific div
```
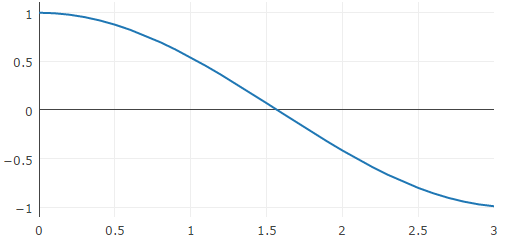
**Y vs X Plot**
Create a X / Y plot.
```js
var x = Matrixs.range(0,0.1,3);
var y = x.apply(Math.cos);
Plots.create([x,y]);
```
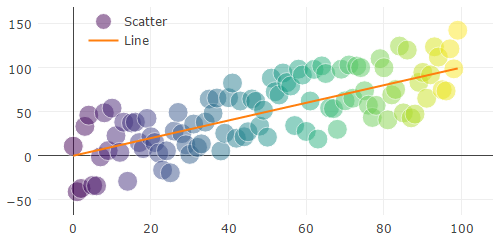
**Multiple traces and scatter plots**
Create a multi trace plot showing both line type and scatter type. Also shows how to give traces a name in the legend.
```js
var X = Matrixs.range(100); // Creates a 0-99 value array
var Y = X.addNoise(0.9); // Adds 90% relative noise
Plots.create(Y,{type:'scatter',name:'Scatter'}); //Creates scatter plot
Plots.add(X,{name:'Line'}); // Adds orange best fit line
```