Bring the best of JavaScript data visualization to R
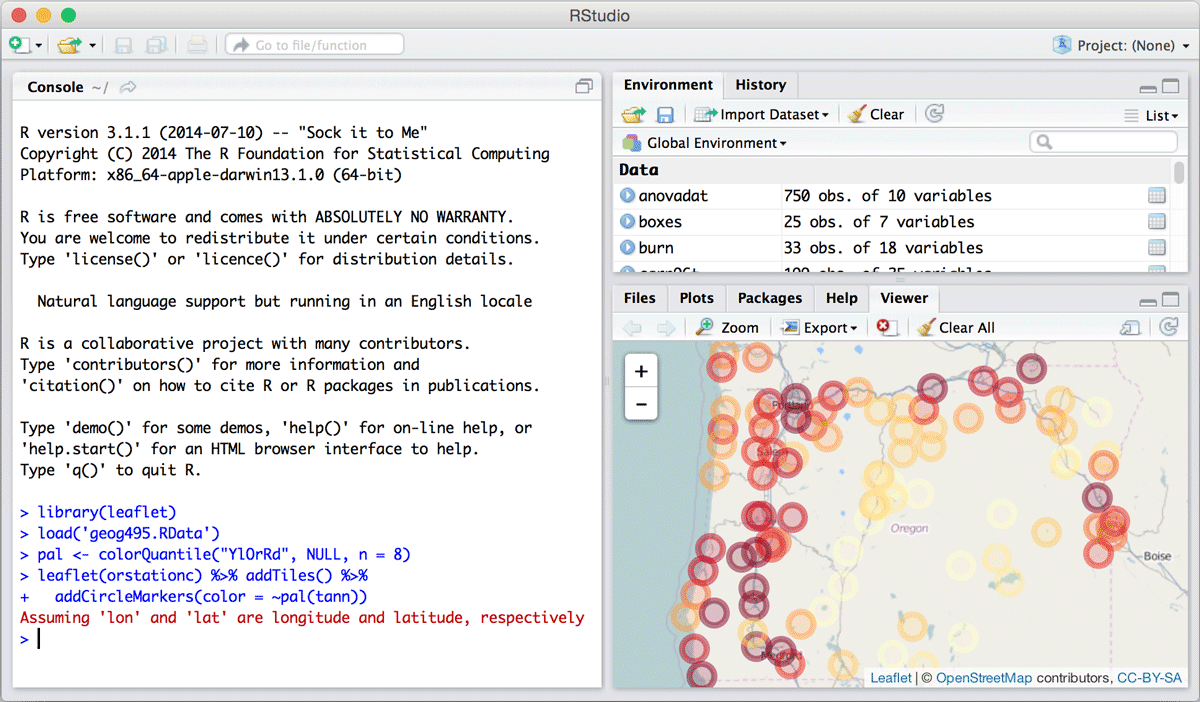
- Use JavaScript visualization libraries at the R console, just like plots
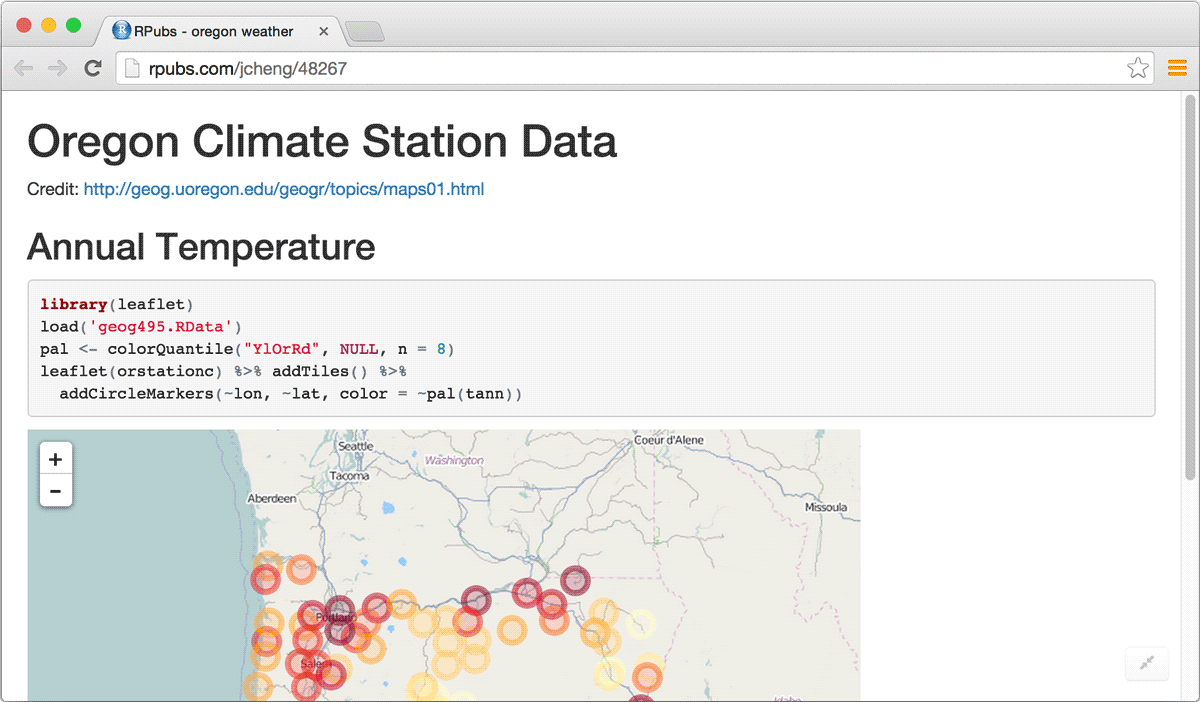
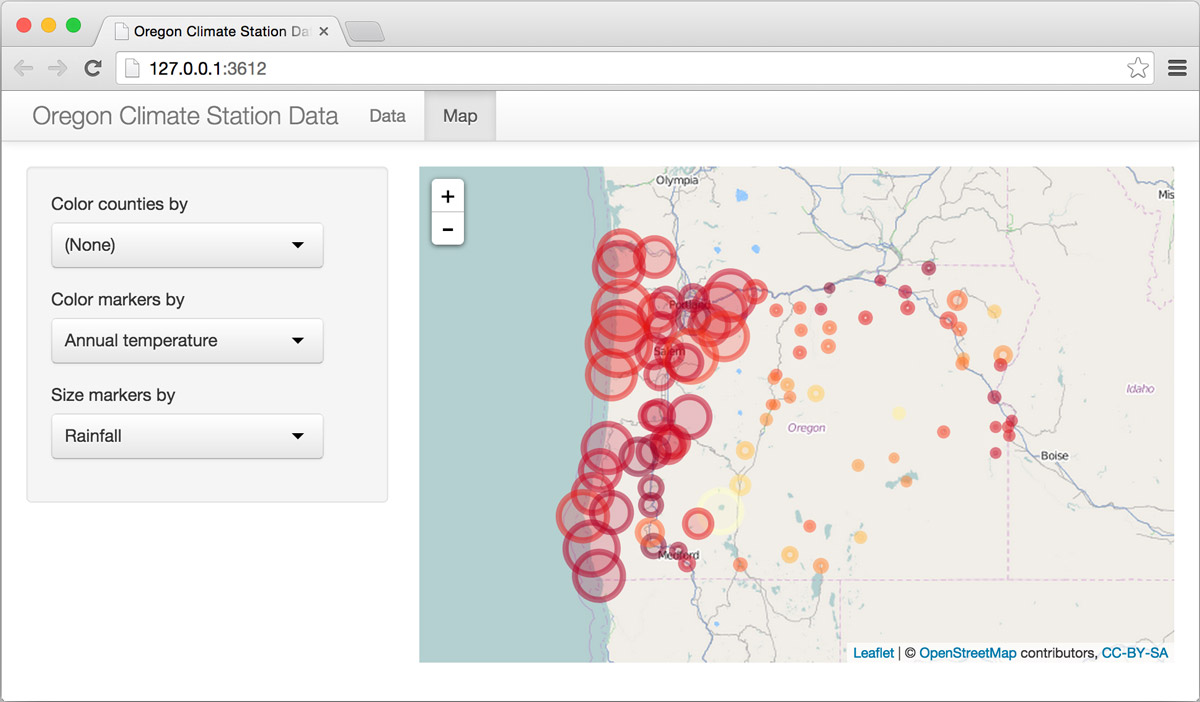
- Embed widgets in R Markdown documents and Shiny web applications
- Develop new widgets using a framework that seamlessly bridges R and JavaScript