TCGA_luad_data_parser.Rmd
Haider Inam
2/19/2019
Last updated: 2019-02-19
workflowr checks: (Click a bullet for more information)-
✔ R Markdown file: up-to-date
Great! Since the R Markdown file has been committed to the Git repository, you know the exact version of the code that produced these results.
-
✔ Environment: empty
Great job! The global environment was empty. Objects defined in the global environment can affect the analysis in your R Markdown file in unknown ways. For reproduciblity it’s best to always run the code in an empty environment.
-
✔ Seed:
set.seed(20190211)The command
set.seed(20190211)was run prior to running the code in the R Markdown file. Setting a seed ensures that any results that rely on randomness, e.g. subsampling or permutations, are reproducible. -
✔ Session information: recorded
Great job! Recording the operating system, R version, and package versions is critical for reproducibility.
-
Great! You are using Git for version control. Tracking code development and connecting the code version to the results is critical for reproducibility. The version displayed above was the version of the Git repository at the time these results were generated.✔ Repository version: f3edec6
Note that you need to be careful to ensure that all relevant files for the analysis have been committed to Git prior to generating the results (you can usewflow_publishorwflow_git_commit). workflowr only checks the R Markdown file, but you know if there are other scripts or data files that it depends on. Below is the status of the Git repository when the results were generated:
Note that any generated files, e.g. HTML, png, CSS, etc., are not included in this status report because it is ok for generated content to have uncommitted changes.Ignored files: Ignored: .Rhistory Ignored: .Rproj.user/ Untracked files: Untracked: code/alldata_compiler.R Untracked: code/contab_maker.R Untracked: code/mut_excl_genes_datapoints.R Untracked: code/mut_excl_genes_generator.R Untracked: code/quadratic_solver.R Untracked: code/simresults_generator.R Untracked: code/tcga_skcm_data_parser.Rmd Untracked: data/All_Data_V2.csv Untracked: data/all_data.csv Untracked: data/tcga_luad_expression/ Untracked: data/tcga_skcm_expression/ Untracked: docs/figure/Filteranalysis.Rmd/ Untracked: filteranalysisheatmap.pdf Untracked: output/alkati_filtercutoff_allfilters.csv Untracked: output/alkati_luad_exonimbalance.pdf Untracked: output/alkati_mtn_pval_fig2B.pdf Untracked: output/alkati_skcm_exonimbalance.pdf Untracked: output/all_data_luad.csv Untracked: output/all_data_skcm.csv Untracked: output/fig2b2_filtercutoff_atinras_totalalk.pdf Untracked: output/fig2b_filtercutoff_atibraf.pdf Untracked: output/fig2b_filtercutoff_atinras.pdf Untracked: output/luad_alk_exon_expression.csv Untracked: output/skcm_alk_exon_expression.csv
Expand here to see past versions:
| File | Version | Author | Date | Message |
|---|---|---|---|---|
| Rmd | f3edec6 | haiderinam | 2019-02-19 | Published Analysis on ALK expression levels in LUAD |
This code essentially processes LUAD TCGA data:
- Mutation Data
- RSEM Normalized
- mRNA Count DAta
- Exon Expression data
Once it processes these data, it makes a merged all_data_luad.csv file for ALK that contains: - RSEM
- RPKM (exon 20-29/exon 1-19 expression)
- Count data
- EGFR and KRAS Mutations
Please note: there are two chunks with eval=F. Therefore, turn EVAL=T when running these for the first time
library(knitr)
library(tictoc)
library(workflowr)
This is workflowr version 1.1.1
Run ?workflowr for help getting startedlibrary(VennDiagram)Loading required package: gridLoading required package: futile.loggerlibrary(dplyr)
Attaching package: 'dplyr'The following objects are masked from 'package:stats':
filter, lagThe following objects are masked from 'package:base':
intersect, setdiff, setequal, unionlibrary(foreach)
library(doParallel)Loading required package: iteratorsLoading required package: parallellibrary(ggplot2)
library(reshape2)
library(RColorBrewer)
library(devtools)
library(ggsignif)
source("code/contab_maker.R")
source("code/alldata_compiler.R")
source("code/quadratic_solver.R")
source("code/mut_excl_genes_generator.R")
source("code/mut_excl_genes_datapoints.R")
source("code/simresults_generator.R")
######################Cleanup for GGPlot2#########################################
cleanup=theme_bw() +
theme(plot.title = element_text(hjust=.5),
panel.grid.major = element_blank(),
panel.grid.major.y = element_blank(),
panel.background = element_blank(),
axis.line = element_line(color = "black"))LUAD Mutation Data: Grabbing EGFR and KRAS for 230 patients.
x1=list.dirs("data/tcga_luad_expression/luad_mutation_data",full.names=TRUE)#Lists all files in the current working directory x

Data_list=list.files(x1[1],pattern="^TCGA-[A-Za-z0-9]{2}-[A-Za-z0-9]{4}-[A-Za-z0-9]{2}.hg19.oncotator.hugo_entrez_remapped.maf.txt*", ignore.case=F)#lists the files in the folder

  patmat=matrix(nrow=length(Data_list),ncol=3)# This initializes the storage matrix
  for (i in 1:length(Data_list)){
    patdat=read.table(paste(x1,"/",Data_list[i],sep=""),stringsAsFactors=FALSE,header=TRUE, sep="\t",fill=TRUE,quote = "")#opens each file as the loop progresses
    egfr=patdat%>%filter(Hugo_Symbol=="EGFR",Variant_Classification!="Silent")
    kras=patdat%>%filter(Hugo_Symbol=="KRAS",Variant_Classification!="Silent")

    #This essentially says that if you can't find the mutant, enter NaN. If you find two mutants, then search for the major transforming mutation (e.g. BrafV600E). Non of the >1 mutations are the transforming mutation, just select the first one
      if(nrow(egfr)>=2){
      if(egfr$Protein_Change%in%"p.T790M"){
        egfr=egfr%>%filter(Protein_Change=="p.T790M")
      } else{
          egfr=egfr[1,]
        }
      } else if(nrow(egfr)==0){
        egfr[1,]="p.NaN"
      }
    if(nrow(kras)>=2){
      if(kras$Protein_Change%in%"p.G12D"){
        kras=kras%>%filter(Protein_Change=="p.G12D")
      } else{
          kras=kras[1,]
        }
      } else if(nrow(kras)==0){
        kras[1,]="p.NaN"
      }

    # missense=nrow(patdat[patdat$Variant_Classification=="Missense_Mutation",])#counts missense mutations by identifying the number of rows in a
    patmat[i,1]=Data_list[i]#Record the Patient ID from the file name
    patmat[i,2]=egfr$Protein_Change
    patmat[i,3]=kras$Protein_Change
    }
Warning in if (egfr$Protein_Change %in% "p.T790M") {: the condition has
length > 1 and only the first element will be used
Warning in if (egfr$Protein_Change %in% "p.T790M") {: the condition has
length > 1 and only the first element will be used

Warning in if (egfr$Protein_Change %in% "p.T790M") {: the condition has
length > 1 and only the first element will be used

Warning in if (egfr$Protein_Change %in% "p.T790M") {: the condition has
length > 1 and only the first element will be used
Warning in if (egfr$Protein_Change %in% "p.T790M") {: the condition has
length > 1 and only the first element will be used
Warning in if (egfr$Protein_Change %in% "p.T790M") {: the condition has
length > 1 and only the first element will be used
Warning in if (egfr$Protein_Change %in% "p.T790M") {: the condition has
length > 1 and only the first element will be usedWarning in if (kras$Protein_Change %in% "p.G12D") {: the condition has
length > 1 and only the first element will be usedWarning in if (egfr$Protein_Change %in% "p.T790M") {: the condition has
length > 1 and only the first element will be used
Warning in if (egfr$Protein_Change %in% "p.T790M") {: the condition has
length > 1 and only the first element will be used
Warning in if (egfr$Protein_Change %in% "p.T790M") {: the condition has
length > 1 and only the first element will be usedpatframe=data.frame(patmat)#Turn storage matrix into data frame
colnames(patframe)[1:3]=c("Patid","EGFR","KRAS")#Rename the columns
# write.csv(patframe,"patients_tally_muttype2.csv")# Record data frame as a CSV and write to the working directory
#Grabbing Patient Names so that they can be used to merge with exon data later
alk_mutated_data=patframe
alk_mutated_data$Patid=substring(alk_mutated_data$Patid,first = 1,last = 12)
###Removing "p." from names of mutants:
alk_mutated_data$EGFR=unlist(sub("p.","",alk_mutated_data$EGFR))
alk_mutated_data$KRAS=unlist(sub("p.","",alk_mutated_data$KRAS))
head(alk_mutated_data) Patid EGFR KRAS
1 TCGA-05-4249 NaN G12C
2 TCGA-05-4382 R222L NaN
3 TCGA-05-4384 NaN NaN
4 TCGA-05-4389 NaN NaN
5 TCGA-05-4390 NaN G12V
6 TCGA-05-4395 NaN G12VLUAD Genes RSEM
rsemdatanormalized=read.table("data/tcga_luad_expression/luadrsemdata/gdac.broadinstitute.org_LUAD.Merge_rnaseqv2__illuminahiseq_rnaseqv2__unc_edu__Level_3__RSEM_genes_normalized__data.Level_3.2016012800.0.0/LUAD.rnaseqv2__illuminahiseq_rnaseqv2__unc_edu__Level_3__RSEM_genes_normalized__data.data.txt",sep = "\t",header = T,stringsAsFactors = F)
alk_rsem=data.frame(t(rsemdatanormalized[grepl("^alk\\|",rsemdatanormalized$Hybridization.REF,ignore.case = T),])[-1,])
#410 of the 577 patients have an RSEM higher than 410
colnames(alk_rsem)[1]="RSEM_normalized"
alk_rsem$Patid=rownames(alk_rsem)
#Standardizing Patid Names
alk_rsem$Patid=substring(alk_rsem$Patid,first = 1,last = 12)
alk_rsem$Patid=gsub("\\.","-",alk_rsem$Patid)

# # As Character
alk_rsem[colnames(alk_rsem)] <- lapply(alk_rsem[colnames(alk_rsem)],as.character)
# # As Numeric: Converting from list to numeric
alk_rsem$RSEM_normalized=unlist(alk_rsem$RSEM_normalized)
alk_rsem$RSEM_normalized=as.numeric(alk_rsem$RSEM_normalized)
LUAD Count data:
#Non-normalized:
gene_expression_data=read.table("data/tcga_luad_expression/luadgeneexpression/gdac.broadinstitute.org_LUAD.Merge_rnaseq__illuminahiseq_rnaseq__unc_edu__Level_3__gene_expression__data.Level_3.2016012800.0.0/LUAD.rnaseq__illuminahiseq_rnaseq__unc_edu__Level_3__gene_expression__data.data.txt",sep = "\t",header = T,stringsAsFactors = F)
#Normalized
# gene_expression_data=read.table(,sep = "\t",header = T,stringsAsFactors = F)

  #Finding Alk
  alk_gene_exp=rbind(gene_expression_data[1,],gene_expression_data[grepl("^alk\\|",gene_expression_data$Hybridization.REF,ignore.case = T),])
  #Removing Columns for Median_length_normalized and RPKM
  t_alk_gene_exp=data.frame(t(alk_gene_exp[,grepl("raw_count",alk_gene_exp[1,])]))

  #Counting patients with raw reads >500
  # sum(as.numeric(as.numeric(as.character(t_alk_gene_exp$X580))>=500))
#ONLY 6 PATIENTS HAVE RAW COUNTS OF >500
LUAD Exon RPKM This creates a .csv file and only needs to be run once.
# rm(list=ls())#Clears workspace
exondatacomb=read.table("data/tcga_luad_expression/luadexondatacomb/gdac.broadinstitute.org_LUAD.Merge_rnaseq__illuminahiseq_rnaseq__unc_edu__Level_3__exon_expression__data.Level_3.2016012800.0.0/LUAD.rnaseq__illuminahiseq_rnaseq__unc_edu__Level_3__exon_expression__data.data.txt",stringsAsFactors=FALSE,header=TRUE, sep="\t",fill=TRUE)
# head(exondatacomb)

#Chromosome 2
exondatachr2=exondatacomb[grep("^chr2:",exondatacomb$Hybridization.REF),] #i.e. it starts with chromosome 2
#Alk within Chromosome 2
# The exon locations were found on ensembl here https://useast.ensembl.org/Homo_sapiens/Transcript/Exons?db=core;g=ENSG00000171094;r=2:29192774-29921566;t=ENST00000389048
##These start at chr2:29415641-29416788:-
exondatachr2alk=exondatacomb[c(26031:26059),]

# # write.table(exondatachr2alk,'exondatachr2alk.csv')
# exondatachr2alk=read.csv("exondatachr2alk.csv",stringsAsFactors = F,header = T,sep = "",fill = T)
#Adding Names for Exons
exondatachr2alk$exon=c(29:1)
alldataalk=exondatachr2alk[,c(488,c(2:487))]
#Switching up order
alldataalk2=alldataalk[c(29:1),]

#Making the dataframe of a numeric type so that analysis can be carried out on it.
# As Character
alldataalk2[colnames(alldataalk2)] <- lapply(alldataalk2[colnames(alldataalk2)],as.character)
# As Numeric
alldataalk2[colnames(alldataalk2)] <- lapply(alldataalk2[colnames(alldataalk2)],as.numeric)

#Getting the correct column names for alldataalk2
# alldataalk2[1,]
colnames_exondata=exondatacomb[1,]
colnames(colnames_exondata)=colnames(alldataalk2)

alldataalk2=rbind(colnames_exondata,alldataalk2) #Adding first row that contains names of measurements such as RPKM, RSEM, Counts
write.table(alldataalk2,'output/luad_alk_exon_expression.csv')

#I used this code to find the length of exons and compare these to the lengths of the exons on Ensembl. I had to calculate exon lengths because annotations in this file and annotations in enseml weren't the same.
# trunc_names=gsub("chr2:|:\\+|:\\-","",exondatachr2$Hybridization.REF)
# ##Code to get the length of each exon:
# names=exondatachr2$Hybridization.REF
# trunc_names2=gsub("\\-","",trunc_names)
# trunc_names2=gsub("chr2:","",trunc_names)
# start=sapply(strsplit(trunc_names,"-"),"[",1)
# end=sapply(strsplit(trunc_names,"-"),"[",2)
# positions=data.frame(start,end,names)
# positions[,c(1,2)]=lapply(positions[,c(1,2)],as.character)
# positions[,c(1,2)]=lapply(positions[,c(1,2)],as.numeric)
# positions$net=positions$end-positions$start
Obtaining RPKM, Count data from LUAD Exon Data. Followed by merging with RSEM data
alldataalk2=read.csv("output/luad_alk_exon_expression.csv",stringsAsFactors = F,header = T,sep = "",fill = T)
#Getting Count Data
alldataalk2_count=cbind(alldataalk2$exon,alldataalk2[,grepl("raw_counts",alldataalk2[1,])])[-1,]
# As Character
alldataalk2_count[colnames(alldataalk2_count)] <-lapply(alldataalk2_count[colnames(alldataalk2_count)],as.character)
# As Numeric
alldataalk2_count[colnames(alldataalk2_count)] <- lapply(alldataalk2_count[colnames(alldataalk2_count)],as.numeric)
#Sum exons 1:29
alk_count_data=data.frame(t(data.frame(lapply(alldataalk2_count[c(1:29),],sum))[,-1])) #Not sure if lapply is the right thing to use here. Really messed up way of summing indices in dataframe
colnames(alk_count_data)="mRNA_count"

alldataalk2_medianlength=cbind(alldataalk2$exon,alldataalk2[,grepl("median_length",alldataalk2[1,])])
# As Character
alldataalk2_medianlength=alldataalk2_medianlength[-1,] #Removing the first row. May be unnecessary in the future
alldataalk2_medianlength[colnames(alldataalk2_medianlength)] <- lapply(alldataalk2_medianlength[colnames(alldataalk2_medianlength)],as.character)
# As Numeric
alldataalk2_medianlength[colnames(alldataalk2_medianlength)] <- lapply(alldataalk2_medianlength[colnames(alldataalk2_medianlength)],as.numeric)
#Sum exons 1:29
alk_medianlength_data=data.frame(t(data.frame(lapply(alldataalk2_medianlength[c(1:29),],sum))[,-1])) #Removing sum of exons lol
colnames(alk_medianlength_data)="medianlength"

#Getting RPKM
alldataalk2_RPKM=cbind(alldataalk2$exon,alldataalk2[,grepl("RPKM",alldataalk2[1,])])
# As Character
alldataalk2_RPKM=alldataalk2_RPKM[-1,] #Removing the first row. May be unnecessary in the future
alldataalk2_RPKM[colnames(alldataalk2_RPKM)] <- lapply(alldataalk2_RPKM[colnames(alldataalk2_RPKM)],as.character)
# As Numeric
alldataalk2_RPKM[colnames(alldataalk2_RPKM)] <- lapply(alldataalk2_RPKM[colnames(alldataalk2_RPKM)],as.numeric)
alk_RPKM_data=data.frame(cbind(lapply(alldataalk2_RPKM[c(1:19),],mean),lapply(alldataalk2_RPKM[c(20:29),],mean))[-1,])
colnames(alk_RPKM_data)=c("mean_RPKM_1.19","mean_RPKM_20.29")
# As Character
alk_RPKM_data[colnames(alk_RPKM_data)] <- lapply(alk_RPKM_data[colnames(alk_RPKM_data)],as.character)
# As Numeric
alk_RPKM_data[colnames(alk_RPKM_data)] <- lapply(alk_RPKM_data[colnames(alk_RPKM_data)],as.numeric)
#  Calculating Ratios of exon RPKM means
alk_RPKM_data$Ratio20.29=alk_RPKM_data$mean_RPKM_20.29/alk_RPKM_data$mean_RPKM_1.19

#Changing rownames (patient_ids) to become the same between each other
rownames(alk_RPKM_data)=substring(rownames(alk_RPKM_data),first=1,last=28)
rownames(alk_medianlength_data)=substring(rownames(alk_medianlength_data),first=1,last=28)
alk_RPKM_data$Patid=rownames(alk_RPKM_data)
alk_medianlength_data$Patid=rownames(alk_medianlength_data)
alk_count_data$Patid=rownames(alk_count_data)

mergetemp=merge(alk_RPKM_data,alk_count_data,by="Patid")
alk_exon_data=merge(mergetemp,alk_medianlength_data,by="Patid")
#Transforming the Patids so that they're compatible with the Patids in the mutation data
alk_exon_data$Patid=substring(alk_exon_data$Patid,first = 1,last = 12)
#Since the names for exon data are not the same format as the mutation data, we're gonna change that here
alk_exon_data$Patid=gsub("\\.","-",alk_exon_data$Patid)
alkati_merged_data=merge(alk_exon_data,alk_mutated_data,by="Patid",all=T)
alkati_merged_data=merge(alkati_merged_data,alk_rsem,by="Patid",all = T)
# alkati_merged_data=merge(alk_exon_data,alk_mutated_data,by="Patid")
# alkati_merged_data=merge(alkati_merged_data,alk_rsem,by="Patid")

###Now adding ALK hits to the data based on filters by Wiesner et al
###2/15 note: use the TCGA data sorter to just process your data
# alk_data=read.csv("../data/all_data.csv",stringsAsFactors = F)
# alldata=tcgadatasorter("data/all_data.csv",meanRPKM,100,500)
alkati_merged_data_alkati=alkati_merged_data%>%
  group_by(Patid,mean_RPKM_1.19,mean_RPKM_20.29,Ratio20.29, mRNA_count,EGFR,KRAS,RSEM_normalized)%>%
  summarize(ATI=as.numeric(mRNA_count>=100&Ratio20.29>10&RSEM_normalized>=80)[1])

write.csv(alkati_merged_data_alkati,"output/all_data_luad.csv")
Making ALK Expression the plots:
alkati_merged_data=read.csv("output/all_data_luad.csv")
alkati_merged_data$alkati=0
alkati_merged_data$alkati[alkati_merged_data$Ratio>=10&alkati_merged_data$mRNA_count>=500&alkati_merged_data$RSEM_normalized>=80]=1
alkati_merged_data$alkati=factor(alkati_merged_data$alkati,levels=c("1","0"))

  ggplot(alkati_merged_data,aes(x=mean_RPKM_1.19, y=mean_RPKM_20.29,color=factor(alkati)))+
    geom_abline(size=1)+
    geom_point(size=4)+
    ####Had to add this line to not overplot the alkati datapoint- Haider 1/31/19
    geom_point(data=alkati_merged_data[alkati_merged_data$alkati==1,],aes(x=mean_RPKM_1.19, y=mean_RPKM_20.29,color=factor(alkati)),size=4)+
    scale_x_continuous(trans = "log10",name="Exon 1:19 RPKM",breaks=c(1e-2,1e0,1e2),labels = parse(text = c("10^-2","10^0","10^2")),limits = c(1e-3,1e3))+
    scale_y_continuous(trans = "log10",name="Exon 20:29 RPKM",breaks=c(1e-2,1e0,1e2),labels = parse(text = c("10^-2","10^0","10^2")),limits = c(1e-3,1e3))+
    scale_color_brewer(palette="Set1",name="ALKATI",labels=c("Yes", "No"))+
    cleanup+
    theme(plot.title = element_text(hjust=.5),
          text = element_text(size=24,face = "bold"),
          axis.title = element_text(face="bold",size="24"),
          axis.text=element_text(face="bold",size="24",colour = "black"))+
    theme(legend.key.size = unit(30,"pt"))
Warning: Transformation introduced infinite values in continuous x-axisWarning: Transformation introduced infinite values in continuous y-axisWarning: Removed 391 rows containing missing values (geom_point).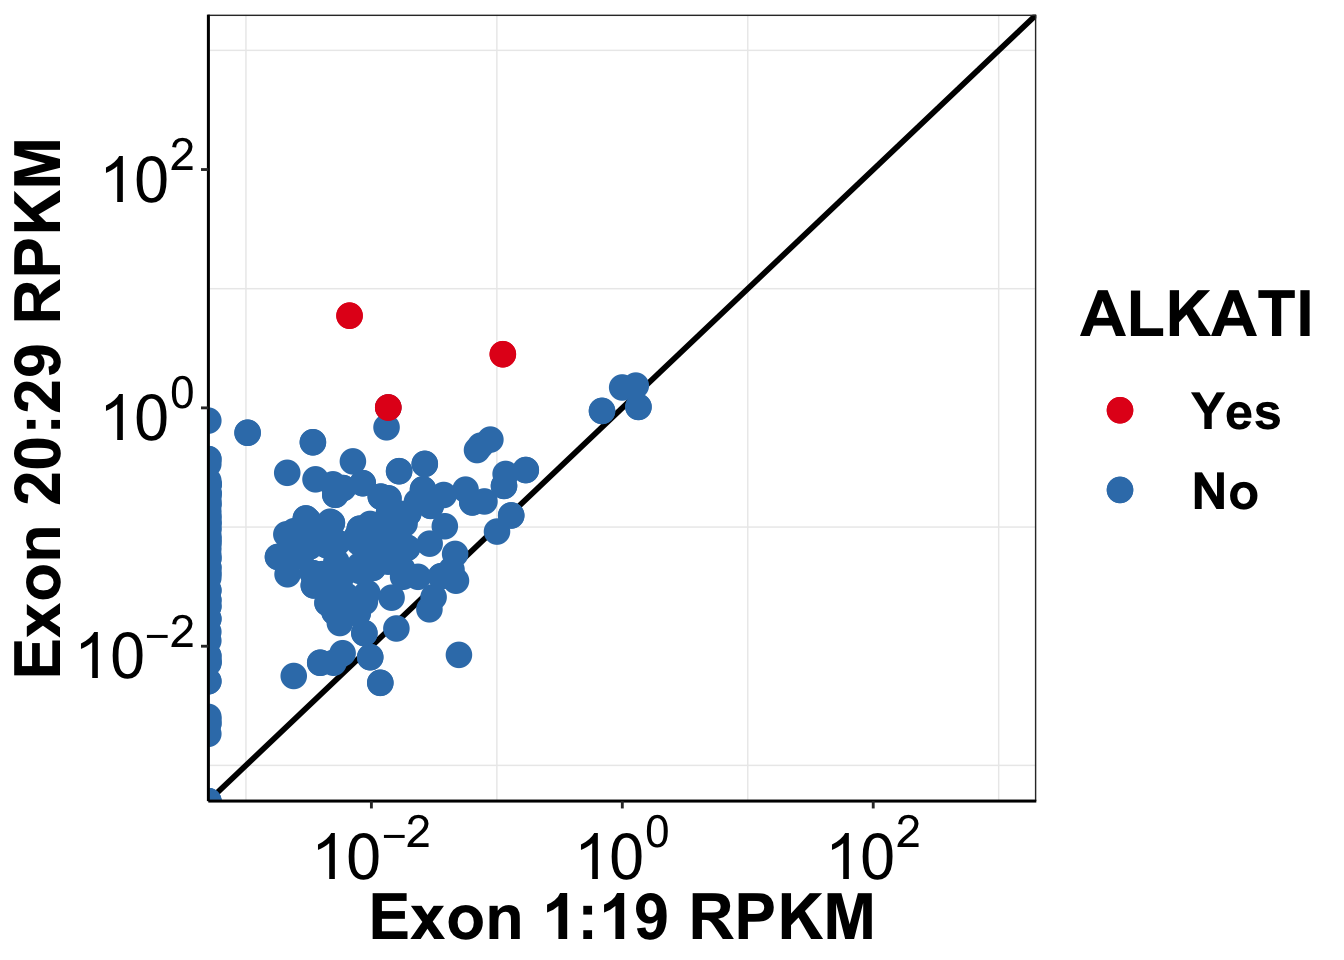
ggsave("output/alkati_luad_exonimbalance.pdf",width =12 ,height =10 ,units = "in",useDingbats=F)Warning: Transformation introduced infinite values in continuous x-axisWarning: Transformation introduced infinite values in continuous y-axisWarning: Removed 391 rows containing missing values (geom_point).#Testing if both kinase and ALK expression are different
ks.test(alkati_merged_data$mean_RPKM_1.19,alkati_merged_data$mean_RPKM_20.29)Warning in ks.test(alkati_merged_data$mean_RPKM_1.19,
alkati_merged_data$mean_RPKM_20.29): p-value will be approximate in the
presence of ties
    Two-sample Kolmogorov-Smirnov test

data:  alkati_merged_data$mean_RPKM_1.19 and alkati_merged_data$mean_RPKM_20.29
D = 0.65401, p-value < 2.2e-16
alternative hypothesis: two-sided
###We observed a significant difference between the distribution for the 20-29 exons and the 1-19 exons The reported p-value was 2-16.Session information
sessionInfo()R version 3.5.2 (2018-12-20)
Platform: x86_64-apple-darwin15.6.0 (64-bit)
Running under: macOS Mojave 10.14.3
Matrix products: default
BLAS: /Library/Frameworks/R.framework/Versions/3.5/Resources/lib/libRblas.0.dylib
LAPACK: /Library/Frameworks/R.framework/Versions/3.5/Resources/lib/libRlapack.dylib
locale:
[1] en_US.UTF-8/en_US.UTF-8/en_US.UTF-8/C/en_US.UTF-8/en_US.UTF-8
attached base packages:
[1] parallel grid stats graphics grDevices utils datasets
[8] methods base
other attached packages:
[1] bindrcpp_0.2.2 ggsignif_0.4.0 usethis_1.4.0
[4] devtools_2.0.1 RColorBrewer_1.1-2 reshape2_1.4.3
[7] ggplot2_3.1.0 doParallel_1.0.14 iterators_1.0.10
[10] foreach_1.4.4 dplyr_0.7.8 VennDiagram_1.6.20
[13] futile.logger_1.4.3 workflowr_1.1.1 tictoc_1.0
[16] knitr_1.21
loaded via a namespace (and not attached):
[1] tidyselect_0.2.5 xfun_0.4 remotes_2.0.2
[4] purrr_0.3.0 colorspace_1.4-0 htmltools_0.3.6
[7] yaml_2.2.0 rlang_0.3.1 pkgbuild_1.0.2
[10] R.oo_1.22.0 pillar_1.3.1 glue_1.3.0
[13] withr_2.1.2 R.utils_2.7.0 sessioninfo_1.1.1
[16] lambda.r_1.2.3 bindr_0.1.1 plyr_1.8.4
[19] stringr_1.3.1 munsell_0.5.0 gtable_0.2.0
[22] R.methodsS3_1.7.1 codetools_0.2-16 evaluate_0.12
[25] memoise_1.1.0 callr_3.1.1 ps_1.3.0
[28] Rcpp_1.0.0 backports_1.1.3 scales_1.0.0
[31] formatR_1.5 desc_1.2.0 pkgload_1.0.2
[34] fs_1.2.6 digest_0.6.18 stringi_1.2.4
[37] processx_3.2.1 rprojroot_1.3-2 cli_1.0.1
[40] tools_3.5.2 magrittr_1.5 lazyeval_0.2.1
[43] tibble_2.0.1 futile.options_1.0.1 crayon_1.3.4
[46] whisker_0.3-2 pkgconfig_2.0.2 prettyunits_1.0.2
[49] assertthat_0.2.0 rmarkdown_1.11 R6_2.3.0
[52] git2r_0.24.0 compiler_3.5.2 This reproducible R Markdown analysis was created with workflowr 1.1.1