User Manual – Analytics Page
This guide describes the Analytics screen in Internal Link Visualizer. It explains how to interpret the indicators, compare analyses, and generate clear exports for your SEO audits.
Page overview
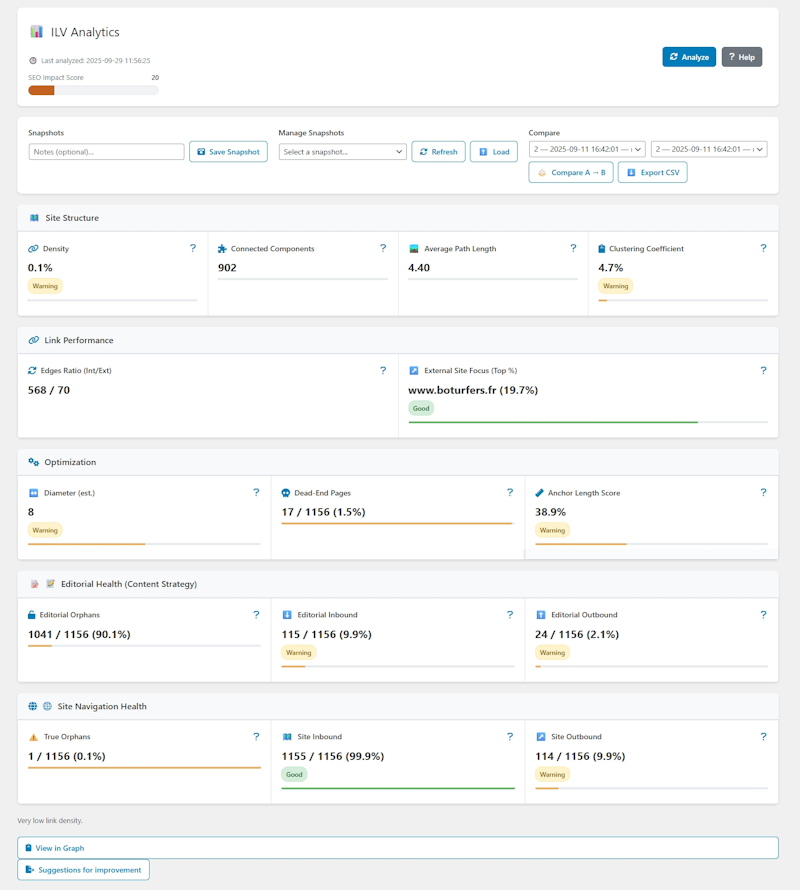
The Analytics page summarizes the state of your internal linking through an overall score, visual metrics, and comparison tools. The goal is to quickly spot strengths and weaknesses so you can prioritize your optimizations.
Header and primary controls
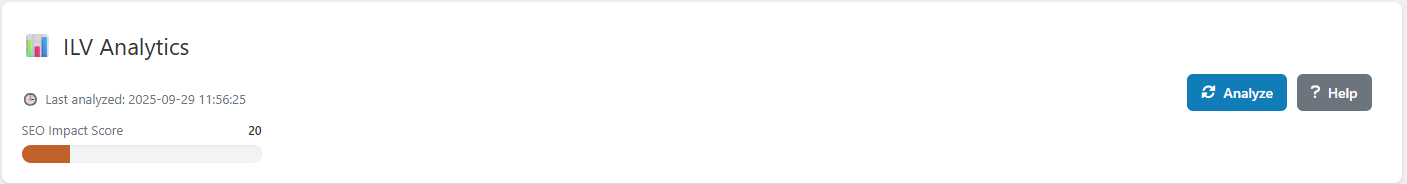
The top area gathers key information and action shortcuts:
- SEO Impact Score – grade out of 100 aggregating your editorial indicators.
- “Analyze” button – runs a fresh calculation of the metrics using the latest data.
- “Help” button – opens the sidebar with detailed definitions.
- Status – shows the time of the last completed analysis.
Snapshot management
Snapshots freeze the state of an audit so you can compare your progress:
- Save Snapshot – saves the current metrics and lets you add an optional note.
- Manage Snapshots – reloads, refreshes, or loads an existing snapshot.
- Compare A → B – lines up two snapshots and calculates the differences.
- Export CSV – retrieves a table ready to use in your reports.
Reading the metrics
Each group of indicators is presented in interactive cards. Hover a card to read the tooltip and click the “?” icon to open a detailed modal.
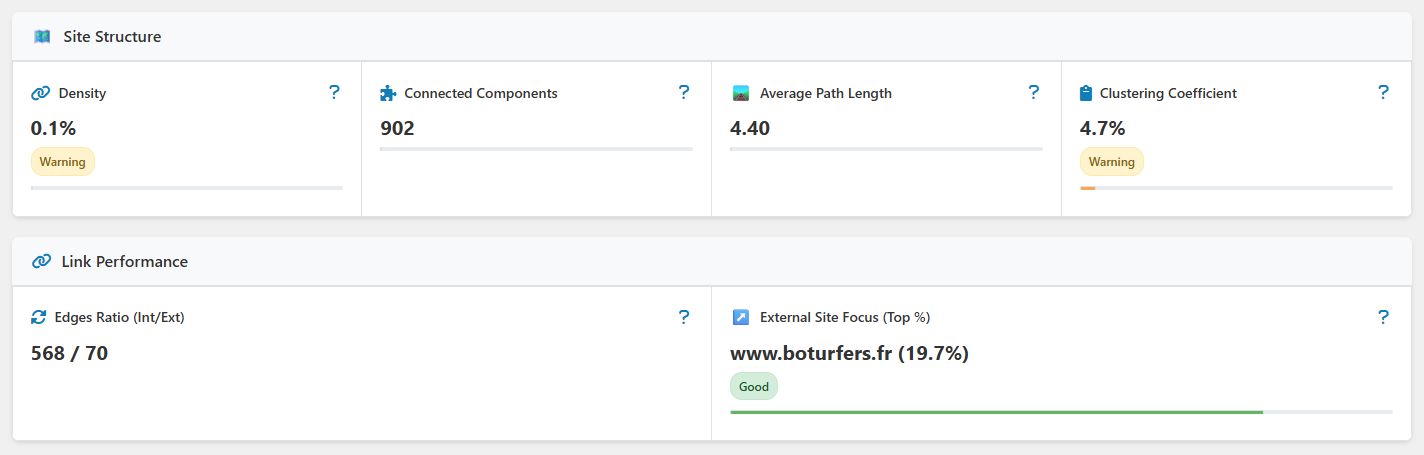
- Site Structure – density, connected components, average path length, clustering.
- Link Performance – internal/external link ratio, concentration of a single external domain.
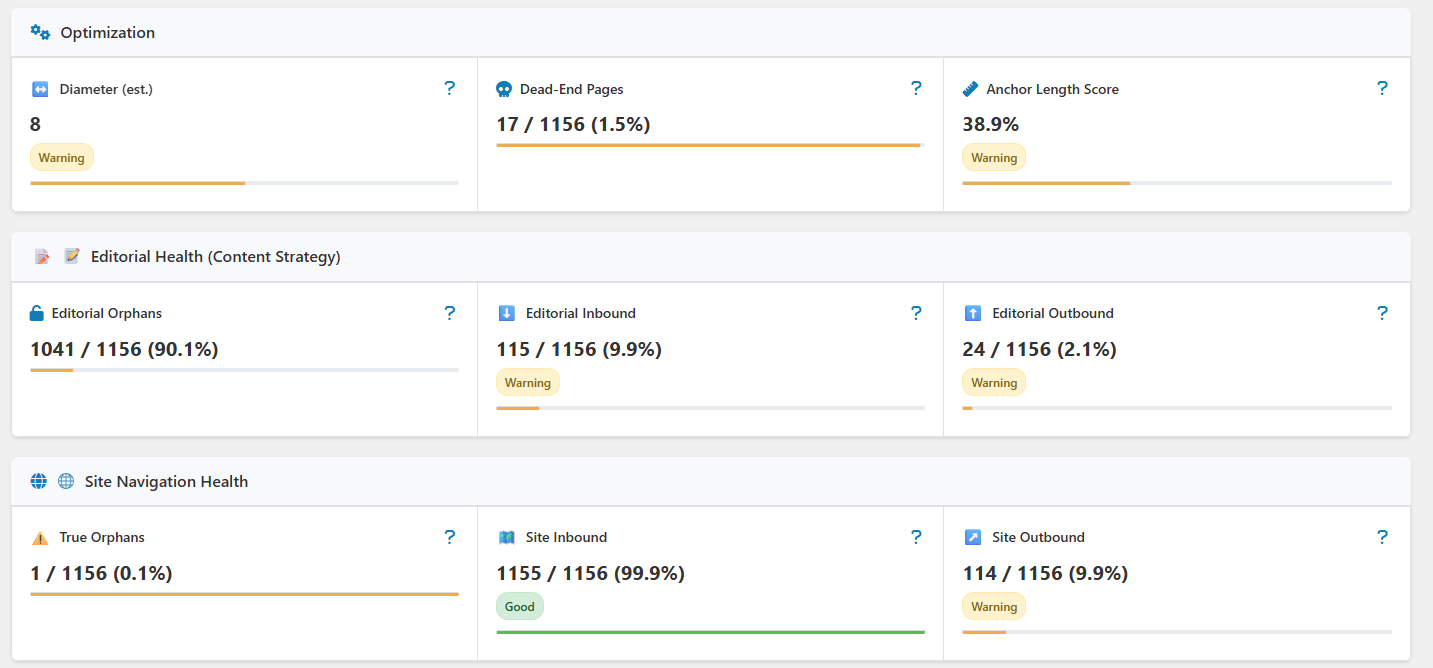
- Optimization – estimated diameter, dead-end pages, anchor length score.
“Editorial Health” section
This section measures the quality of your editorial linking (post ↔ post/page links):
- Editorial Orphans – pages without editorial inbound links.
- Editorial Inbound – coverage of pages receiving at least one editorial link.
- Editorial Outbound – share of pages actively distributing editorial links.
“Site Navigation Health” section
This section expands the analysis to every link source, including menus:
- True Orphans – content unreachable for the user.
- Site Inbound – overall accessibility of the site.
- Site Outbound – ability of pages to redirect to other resources.
Help panel and modals
Click “Help” or the “?” icons to open a sidebar or modal window:
- “Indicators Reference” sidebar – detailed definitions and recommendations.
- Dedicated modals – in-depth explanations for every metric (e.g., density, diameter, dead-ends).
Exports and documentation
The “Analytics Documentation Report” area compiles a shareable summary:
- Copy to Clipboard – instantly pastes the report into an email or note-taking tool.
- Download .md – keeps a versioned history of your audits.
- View in Graph – provides direct access to the graph to see the links behind the numbers.
Recommended routine
- Analyze – run “Analyze” after every scan or major update.
- Compare – save a snapshot before and after your optimizations.
- Prioritize – use the warning badges to plan quick wins.
- Document – export the report to keep a record of your progress.