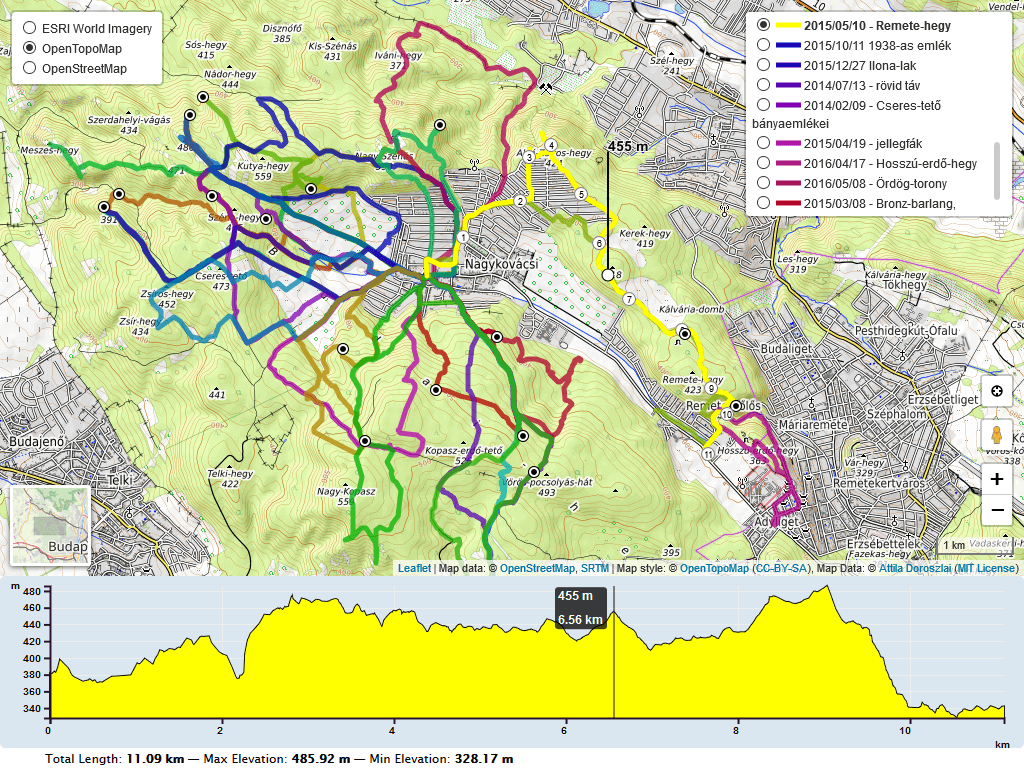
# leaflet-elevation.js
[](https://www.npmjs.com/package/@raruto/leaflet-elevation)
[](LICENSE)
A Leaflet plugin that allows to add elevation profiles using native SVG and Canvas elements.
Initially based on the work of Felix “MrMufflon” Bache
---
## How to use
1. **include CSS & JavaScript**
```html
...
...
```
2. **choose the div container used for the slippy map**
```html
...
...
```
3. **create your first simple “leaflet-elevation” slippy map**
```html
```
### Options
| Option | Default | Description |
|---|---|---|
| `detached` | `true` | Render the chart outside the map. |
| `elevationDiv` | `"#elevation-div"` | Selector for the detached chart container; if missing, the chart is placed after the map. |
| `position` | `"topright"` | Map corner for the control when `detached: false`. |
| `collapsed` | `false` | Start with the map-attached chart collapsed. |
| `closeBtn` | `true` | Show the chart toggle button. |
| `autohide` | `false` | Hide the map-attached chart when the pointer leaves it. |
| `autohideMarker` | `true` | Hide the map indicator when it is not in use. |
| `autofitBounds` | `true` | Fit the map to a loaded track. |
| `followMarker` | `true` | Center the map on the chart's current point. |
| `zFollow` | `false` | When numeric, minimum zoom while following the current point; change with `setZFollow()`. |
| `theme` | `"lightblue-theme"` | Chart and track theme: `"lightblue-theme"`, `"lime-theme"`, `"steelblue-theme"`, `"purple-theme"`, `"yellow-theme"`, `"red-theme"`, or `"magenta-theme"`. Custom CSS themes are also supported. |
| `altitude` | `true` | Elevation: `true` shows the profile and statistics; `"summary"` keeps statistics/tooltips without the profile axis or plot; `"disabled"` initially hides the plot, which can be enabled from the legend; `false` disables the profile. |
| `distance` | `true` | Distance: `true` shows the axis, grid, tooltip, and summary; `"summary"` omits the axis; `false` hides distance information but retains distance calculations. |
| `time` | `true` | Time: `true` shows the time axis, tooltip, and summary; `"summary"` omits the axis; `false` hides time information. The time axis is omitted on mobile. |
| `slope` | `false` | Slope: `true` shows the profile and statistics, including ascent/descent; `"summary"` keeps statistics/tooltips without the profile axis or plot; `"disabled"` initially hides the plot, which can be enabled from the legend; `false` disables slope calculations and statistics. |
| `speed` | `false` | Speed: `true` shows the profile and statistics; `"summary"` keeps statistics/tooltips without the profile axis or plot; `"disabled"` initially hides the plot, which can be enabled from the legend; `false` hides speed information (speed is still calculated when acceleration requires it). |
| `acceleration` | not set | Acceleration: `true` shows the profile and statistics; `"summary"` keeps statistics/tooltips without the profile axis or plot; `"disabled"` initially hides the plot, which can be enabled from the legend; `false` disables acceleration calculations and statistics. |
| `summary` | `"inline"` | Summary layout: `"inline"`, `"multiline"`, or `false`. |
| `imperial` | `false` | Use miles, feet, and imperial speed units. |
| `timestamps` | `false` | Include recorded date/time in chart tooltips. |
| `timeFactor` | `3600` | Seconds per time unit used for derived speed and elapsed time. |
| `downloadLink` | `"link"` | Download UI: `"link"`, `"modal"`, or `false`. |
| `ruler` | `true` | Enable the ruler cursor on the chart. |
| `legend` | `true` | Show the chart legend and allow toggling profiles. |
| `dragging` | enabled except on mobile | Enable chart range selection. |
| `zooming` | enabled except on mobile | Enable chart zooming and panning. |
| `preferCanvas` | `false` | Render chart profiles with Canvas instead of SVG. |
| `width`, `height` | screen-based | Chart dimensions in pixels. Detached container dimensions take precedence when available. |
| `margins` | `{top: 30, right: 30, bottom: 30, left: 40}` | Chart margins in pixels. |
| `xTicks`, `yTicks` | automatic | Approximate number of axis ticks. |
| `xAttr`, `yAttr` | `"dist"`, `"z"` | Data fields used for the horizontal and vertical axes. |
| `xLabel`, `yLabel` | `"km"`, `"m"` | Distance and elevation units/labels. |
| `xAxisMin`, `xAxisMax` | automatic | Set horizontal axis bounds. |
| `decimalsX`, `decimalsY` | `2`, `0` | Decimal places in axis tooltips. |
| `yAxisMin`, `yAxisMax` | automatic | Set vertical axis bounds. |
| `forceAxisBounds` | `false` | Keep configured axis bounds when data changes. |
| `interpolation` | `"curveLinear"` | D3 curve interpolation used for the chart. |
| `reverseCoords` | `false` | Interpret coordinates as `[lat, lng]` instead of GeoJSON's `[lng, lat]`. |
| `polyline` | Leaflet style object | Leaflet style for track lines. |
| `polylineSegments` | Leaflet style object | Style for the highlighted chart-selected segment. |
| `trkStart`, `trkEnd` | green/red circle styles | Start/end marker styles; set to `false` to disable either marker. |
| `marker` | `"elevation-line"` | Map indicator style; `"position-marker"` uses a Leaflet marker. |
| `markerIcon` | Leaflet `DivIcon` | Icon used when `marker: "position-marker"`. |
| `waypoints` | `true` | Waypoint display: `true`, `"markers"`, `"dots"`, or `false`. |
| `wptIcons` | default icon mapping | `true` uses built-in waypoint icons; `false` hides map waypoint markers without hiding chart dots. An object maps normalized waypoint symbols to `L.Icon` / `L.DivIcon` instances; see [Custom waypoint icons](#custom-waypoint-icons). Requires `waypoints: true` or `"markers"` for map markers. |
| `wptLabels` | `true` | Waypoint labels: `true`, `"markers"`, `"dots"`, or `false`. |
| `handlers` | distance, time, altitude, slope, speed, acceleration | Data handlers to load; built-in optional handlers include cadence, heart rate, pace, and temperature. |
| `almostOver` | `true` | Enable near-line hover interaction on the map (disabled on mobile). |
| `hotline` | `"elevation"` | Color the track by elevation, or by another track statistic; set `false` to disable. |
| `distanceMarkers` | `{lazy: true, distance: true, direction: true}` | Add distance/direction markers to the track; set `false` to disable. |
| `edgeScale` | `{bar: true, icon: false, coords: false}` | Enable the map edge scale/coordinate control; accepts the control's options object or `false`. |
| `colors` | theme defaults | Override Canvas track colors by theme name. |
| `srcFolder` | inferred from script URL | Base URL used to load optional modules and assets; set for custom hosting or ES module builds. |
#### Custom locales (i18n)
Use `L.registerLocale(code, strings)` to register translations and `L.setLocale(code)` to select the language before creating the elevation control. These functions require [leaflet-i18n](https://github.com/yohanboniface/Leaflet.i18n), included by `leaflet-ui`; when using plain Leaflet, load it separately.
```js
L.registerLocale("it", {
"Altitude": "Altitudine",
"Slope": "Pendenza",
"Total Length: ": "Distanza: ",
"Max Elevation: ": "Altezza Max: ",
"y: ": "Altitudine: ",
"x: ": "Distanza: ",
});
L.setLocale("it");
const elevation = L.control.elevation().addTo(map);
```
Keys must match the original strings exactly, including capitalization, punctuation, and trailing spaces. The selected locale is shared by controls using `leaflet-i18n`, not set per elevation control.
See the [translation example](https://raruto.github.io/leaflet-elevation/examples/leaflet-elevation_i18n-strings.html) for more keys.
#### Custom formats
Set these options in `L.control.elevation({...})` to customize units and time labels. Labels change text only; factors convert numeric values.
| Option | What it changes | Example |
|---|---|---|
| `timeFormat` | Date/time shown in the tooltip when `timestamps: true`. Accepts `"time"`, `"date"`, or a function receiving the point's timestamp. | `timeFormat: "time"` shows only the clock time. |
| `xTimeFormat` | Labels on the chart's time axis. The function receives elapsed milliseconds. | `xTimeFormat: (ms) => Math.round(ms / 60000) + " min"` |
| `timeAVGSpeed` | Assumed speed in km/h when timestamps are missing; default `3.6`. Estimated times are not recorded measurements. | `timeAVGSpeed: 18` estimates times at cycling speed. |
| `speedLabel` | Speed unit text; does not convert values. | `speedLabel: "km/h"` |
| `slopeLabel` | Slope unit text; does not convert values. | `slopeLabel: "%"` |
| `accelerationLabel` | Acceleration unit text; does not convert values. | `accelerationLabel: "m/s²"` |
| `paceLabel` | Pace unit text; does not convert values. | `paceLabel: "min/km"` |
| `altitudeFactor` | Multiplies elevation values; default `1` in metric mode. | `altitudeFactor: 0.001` converts meters to kilometers; also set `yLabel: "km"`. |
| `distanceFactor` | Multiplies distance values; default `1` in metric mode. | `distanceFactor: 1000` converts kilometers to meters; also set `xLabel: "m"`. |
| `speedFactor` | Multiplies calculated speed; default `1`. | `speedFactor: 1 / 3.6` converts km/h to m/s; also set `speedLabel: "m/s"`. |
| `accelerationFactor` | Multiplies calculated acceleration; default `1`. | `accelerationFactor: 100` converts m/s² to cm/s²; also change `accelerationLabel`. |
| `paceFactor` | Divisor used to express pace in minutes rather than seconds; default `60`. | `paceFactor: 1` uses seconds; also set `paceLabel: "s/km"`. |
| `temperatureFactor1`, `temperatureFactor2` | Convert source temperatures using `value * temperatureFactor1 + temperatureFactor2`. | `1` and `0` keep Celsius; `1.8` and `32` convert Celsius to Fahrenheit. |
With `imperial: true`, distance and elevation use the built-in miles/feet conversions instead of `distanceFactor` and `altitudeFactor`. Changing distance or speed factors also affects other calculated measurements, such as slope, speed, pace, and acceleration.
#### Custom waypoint icons
Keys come from GPX `` or GeoJSON `properties.sym`, falling back to the waypoint name. They are lowercased, spaces become hyphens, and single/double quotes are removed: `Drinking Water` becomes `drinking-water`.
```js
L.control.elevation({
waypoints: true,
wptIcons: {
"": L.divIcon({
className: "elevation-waypoint-marker",
html: '',
iconSize: [30, 30],
iconAnchor: [8, 30],
}),
"drinking-water": L.icon({
iconUrl: "water.png",
iconSize: [24, 24],
iconAnchor: [12, 24],
}),
},
}).addTo(map);
```
Keep the `""` entry: unlisted symbols generate a `DivIcon` from its options with HTML ``, allowing symbol-specific CSS styling. `wptLabels` controls labels independently of icons.
#### Custom handlers
Add a function to `handlers` and enable its `name` as a control option. Keep the default handlers when adding your own; order matters for handlers that depend on previously calculated values.
This example reads power values from GeoJSON `properties.coordinateProperties.powers` and adds a profile, tooltip, and maximum-power summary:
```js
function Power() {
const { iMax } = L.Control.Elevation.Utils;
return {
name: "power",
unit: "W",
coordinateProperties: ["powers"],
pointToAttr: (point) => point.meta.power ?? NaN,
stats: { max: iMax },
scale: {
axis: "y",
position: "right",
scale: { min: 0 },
},
path: {
label: "Power",
yAttr: "power",
scaleX: "distance",
scaleY: "power",
color: "#ffa500",
fillOpacity: 0.3,
},
tooltip: {
chart: (item) => "Power: " + item.power + " W",
},
summary: {
maxpower: {
label: "Max Power: ",
value: (track, unit) => (track.power_max ?? "—") + " " + unit,
},
},
};
}
var controlElevation = L.control.elevation({
handlers: [
"Distance", "Time", "Altitude", "Slope", "Speed", "Acceleration", Power,
],
power: true,
}).addTo(map);
```
| Handler field | Purpose |
|---|---|
| `name` | Control option and output data field (`"power"` in the example). |
| `coordinateProperties` | Source property names; values are copied to `point.meta[name]`. Arrays must match the track coordinates. |
| `pointToAttr(point, index)` | Calculate each point's value. Return `NaN` for missing data rather than treating it as zero. |
| `stats` | Statistic functions from `L.Control.Elevation.Utils`, such as `iMin`, `iMax`, and `iAvg`; results appear in `track_info` as `_`. |
| `scale`, `path` | Profile axis and plot configuration. |
| `tooltip` | `chart` and/or `marker` formatter functions receiving a normalized data point. |
| `summary` | Named entries with a `label` and `value(track_info, unit)` formatter. |
- Use a regular function for the handler factory: `this` is the elevation control.
- To load an external module, export one named handler function and pass `import("./power.js")` in `handlers` instead of `Power`.
- For more configurations, see the built-in [handlers](./src/handlers/) and [extended profiles example](https://raruto.github.io/leaflet-elevation/examples/leaflet-elevation_extended-ui.html).
### Methods
| Method | Description |
|---|---|
| `load(urlOrString)` | Load a GPX, TCX, KML, or GeoJSON URL/string. Returns no promise; wait for `eledata_loaded`. |
| `addData(data, layer?)` | Add GeoJSON or a Leaflet layer to the profile, optionally associating its map layer. Returns a promise. |
| `clear()` | Remove loaded profile data, tracks, and markers. |
| `redraw()` | Resize and redraw the chart. |
| `show()` / `hide()` | Show or hide the chart container. |
| `fitBounds(bounds?)` | Fit the map to the supplied bounds or current track bounds. |
| `getBounds(data?)` | Return the bounds for loaded data (or the supplied normalized point array). |
| `enableBrush()` / `disableBrush()` | Enable or disable selecting a distance range on the chart. |
| `enableZoom()` / `disableZoom()` | Enable or disable chart zooming and panning. |
| `getZFollow()` / `setZFollow(zoom)` | Read or set the zoom used by `followMarker`. |
### Events
Listen with `controlElevation.on(name, handler)`.
| Event | Payload | When it fires |
|---|---|---|
| `eledata_loaded` | `{data, layer, name, track_info}` | A URL or string has been parsed and its track added. Fired on the control and map. |
| `eledata_added` | `{data, layer, track_info}` | Data is added with `addData()`. Fired on the control and map. |
| `eledata_clear` | — | `clear()` removes the current data. Fired on the control and map. |
| `elepoint_init` | `{point, props, id, isMulti}` | Before a point is converted into chart data; useful to inspect or adjust source metadata. |
| `elepoint_added` | `{point, index}` | After a point is added and converted. |
| `eletrack_added` | `{coords, index}` | After a coordinate sequence is processed. |
| `eledata_updated` | `{index}` | A raw chart point is appended, before handler-derived attributes are finalized. |
| `elechart_init` | — | The chart is initialized. |
| `elechart_updated` | — | The chart is redrawn with current data. |
| `elechart_change` | `{data, xCoord}` | The current point changes on chart hover or track hover on the map. |
| `elechart_hover` | `{data, xCoord}` | The current point changes while hovering over the chart. |
| `elechart_enter` | — | Pointer enters the chart. |
| `elechart_leave` | — | Pointer leaves the chart or a hovered track on the map. |
| `elechart_dragged` | — | A chart range is dragged; the map bounds are fitted to the selected range. |
| `elechart_axis`, `elechart_summary` | — | Chart extension hooks, fired before axes or summary values are registered. |
| `eletrack_download` | `{downloadLink, confirm}` | Download action; fired on the control. Also dispatched on `document` as a `CustomEvent` when `downloadLink: "modal"`. |
Example:
```js
controlElevation.on('eledata_loaded', ({ name, track_info }) => {
console.log(name, track_info.distance);
});
```
### Additional libraries
You can include this scripts as standalone plugins; some are load on demand.
#### `leaflet-hotline.js`
Track color gradients, enabled by `hotline: "elevation"`.
- **API:** `L.hotline(latlngs, options)`; coordinates are `[lat, lng, value]`.
- **Options:** `min`, `max`, `palette` (color stops from `0` to `1`), `weight`, `outlineColor`, `outlineWidth`.
```js
L.hotline([
[41.9, 12.5, 120],
[42.0, 12.6, 240],
], {
min: 0,
max: 500,
palette: { 0: "green", 0.5: "yellow", 1: "red" },
}).addTo(map);
```
#### `leaflet-distance-marker.js` and `leaflet-distance-marker.css`
Distance labels and direction arrows along a track.
- **Options:** `offset` (spacing in meters; default `1000`), `showAll` (zoom showing all markers), `distance`, `direction`, `textFunction(distance, index, offset)`, `arrowUrl`, `arrowSize`.
- **API:** set a polyline's `distanceMarkers` option; use `addDistanceMarkers()` / `removeDistanceMarkers()` to toggle markers.
- **Rendering:** use `map.options.preferCanvas: true` for Canvas markers. DOM markers need the CSS file; rotated DOM arrows also need `leaflet-rotate`.
```js
L.polyline(coords, {
distanceMarkers: { offset: 500, distance: true, direction: true },
}).addTo(map);
```
#### `leaflet-edgescale.js`
Map edge scale, center crosshair, and center coordinates.
- **API:** `L.control.edgeScale(options).addTo(map)`.
- **Options:** `bar`, `icon`, `coords`, `position`, `latlngFormat` (`"DD"`, `"DM"`, `"DMS"`), `projected`, `template`, `latLngFormatter`.
```js
L.control.edgeScale({
position: "bottomleft",
latlngFormat: "DMS",
icon: true,
coords: true,
bar: true,
}).addTo(map);
```
#### `leaflet-gpxgroup.js`
Multi-track selection with an elevation profile and optional legend.
- **API:** `L.gpxGroup(tracks, options)`, where `tracks` contains URLs or parsed GeoJSON objects. Call `addTo(map)` to load them.
- **Options:** `legend` (default `false`), `flyToBounds` (default `true`), `elevation_options`, `legend_options`, `highlight` (hover style), `points`/`points_options` (named POIs), `distanceMarkers`/`distanceMarkers_options`.
- **Selection:** click a route; with `legend: true`, hover also selects it. Use `getSelection()` / `setSelection(route)` programmatically.
- **Events:** `loaded`, `route_loaded` (`{route}`), `route_mouseover` / `route_mouseout` (`{route, polyline}`), `selection_changed`.
```js
L.gpxGroup(["route-a.gpx", "route-b.gpx"], {
legend: true,
elevation_options: { detached: true, elevationDiv: "#elevation-div" },
}).addTo(map);
```
#### `leaflet-ruler.js` and `leaflet-ruler.css`
Map distance and bearing measurements, separate from the chart's `ruler` option.
- **API:** `L.control.ruler(options).addTo(map)`; include the accompanying CSS.
- **Interaction:** click the control to toggle measurement; double-click or press Escape to finish the current path.
- **Options:** `position`, `circleMarker`, `lineStyle`, `lengthUnit`, `angleUnit`.
- **Units:** both unit objects accept `display`, `decimal`, `factor`, `label`. Distance `factor` multiplies meters; angle `factor` defines a full turn (`360` for degrees).
```js
L.control.ruler({
lengthUnit: { display: "m", decimal: 0, factor: 1, label: "Distance:" },
angleUnit: { display: "°", decimal: 1, factor: 360, label: "Bearing:" },
}).addTo(map);
```
#### Performance
For large tracks, try Canvas rendering on both the map and the chart:
```js
const map = new L.Map("map", {
mapTypeId: "terrain",
center: [41.4583, 12.7059],
zoom: 5,
preferCanvas: true,
});
const controlElevation = L.control.elevation({
preferCanvas: true,
}).addTo(map);
```
| Setting | Scope | Effect |
|---|---|---|
| Map `preferCanvas: true` | Leaflet paths and distance markers | Prefer Canvas over SVG/DOM rendering. Does not change tile layers or ordinary `L.Marker` icons. |
| Control `preferCanvas: true` | Chart profiles | Draw profiles on Canvas; axes, labels, and interactions remain SVG. |
| Control `almostOver: false` | Near-track hover | Avoid scanning track segments for nearby pointer positions; direct track hover remains available. |
| Control `hotline: false` | Track gradient | Skip the separate gradient renderer when a solid-color track is sufficient. |
- Canvas changes rendering, not data size: parsing, statistics, and hover lookups still process track points.
- Benchmark with representative tracks and target browsers; Canvas is not always faster. Safari uses an image snapshot on each chart redraw, which adds overhead.
- Canvas-drawn profiles and markers cannot be styled through SVG/DOM selectors; use the supported theme, `colors`, and layer options.
### Build Guide
Within your local development environment:
```shell
git clone git@github.com:Raruto/leaflet-elevation.git
cd ./leaflet-elevation
npm i # install dependencies
npm run dev # start dev server at: http://localhost:8080
npm run build # generate "dist" files (once)
npm test # run all cucumber tests
```
After that you can start developing inside the `src` and `test` folders (eg. open "http://localhost:8080/test" in your browser to preview changes). Check also [CONTRIBUTING.md](.github/CONTRIBUTING.md) file for some information about it.
### FAQ
1. How can I change the color of the elevation plot?
There are multiple options to achieve this:
* Set `theme` to one of the built-in presets listed in [Options](#options), for example `theme: "lime-theme"`.
* check out [this example](https://raruto.github.io/leaflet-elevation/examples/leaflet-elevation_custom-theme.html)
* Or add the following lines for custom colors.
```css
.elevation-control .area {
fill: red;
}
.elevation-control .background {
background-color: white;
}
```
2. How to enable/disable the leaflet user interface customizations?
These customizations are actually part of the [leaflet-ui](https://github.com/Raruto/leaflet-ui) and can be toggled on/off using e.g. the following options:
```js
const map = new L.Map('map', {
center: [41.4583, 12.7059], // needs value to initialize
zoom: 5, // needs value to initialize
mapTypeId: 'topo',
mapTypeIds: ['osm', 'terrain', 'satellite', 'topo'],
gestureHandling: false, // zoom with Cmd + Scroll
zoomControl: true, // plus minus buttons
pegmanControl: false,
locateControl: false,
fullscreenControl: true,
layersControl: true,
minimapControl: false,
editInOSMControl: false,
loadingControl: false,
searchControl: false,
disableDefaultUI: false,
printControl: false,
});
```
3. How can I import this library as ES module?
Usually, when working with a js bundler like [Vite](https://vitest.dev/) or [Webpack](https://webpack.js.org/), you need to provide to this library the full path to some dynamically imported files from the [`srcFolder`](./src/):
```js
import './your-custom-style.css';
import 'leaflet/dist/leaflet.css';
import L from 'leaflet';
import '@raruto/leaflet-elevation/src/index.js';
import '@raruto/leaflet-elevation/src/index.css';
const map = new L.Map('map', {
center: [41.4583, 12.7059],
zoom: 5,
});
const controlElevation = L.control.elevation({
// CHANGE ME: with your own http server folder (eg. "http://custom-server/public/path/to/leaflet-elevation/src/")
srcFolder: 'http://unpkg.com/@raruto/leaflet-elevation/src/'
}).addTo(map);
// Load track from url (allowed data types: "*.geojson", "*.gpx", "*.tcx")
controlElevation.load("https://raruto.github.io/leaflet-elevation/examples/via-emilia.gpx");
```
For more info about disabling built-in lazy loading, see [#280](https://github.com/Raruto/leaflet-elevation/issues/280) and [track-loading.steps.js](./test/steps/track-loading.steps.js).
4. Some real world projects based on this plugin?
- https://parcours.scasb.org/
- https://velocat.ru/velo/phpBB3/map.php
- https://plugins.qgis.org/plugins/track_profile_2_web/
- https://wordpress.org/plugins/os-datahub-maps/
- https://wordpress.org/plugins/extensions-leaflet-map/
- https://github.com/der-stefan/OpenTopoMap
- https://gpx.n-peloton.fr/
- https://walkaholic.me/map
_Related: [Leaflet-UI presets](https://github.com/raruto/leaflet-ui), [QGIS Integration](https://github.com/faunalia/trackprofile2web)_
### Changelog
All notable changes to this project are documented in the [releases](https://github.com/Raruto/leaflet-elevation/releases) page.
---
**Compatible with:**
[](http://leafletjs.com/reference.html)
[](http://leafletjs.com/reference.html)
[](https://www.npmjs.com/package/@tmcw/togeojson)
---
**Contributors:** [MrMufflon](https://github.com/MrMufflon/Leaflet.Elevation), [HostedDinner](https://github.com/HostedDinner/Leaflet.Elevation), [ADoroszlai](http://ADoroszlai.github.io/joebed/), [Raruto](https://github.com/Raruto/leaflet-elevation)
---
**License:** GPL-3.0+