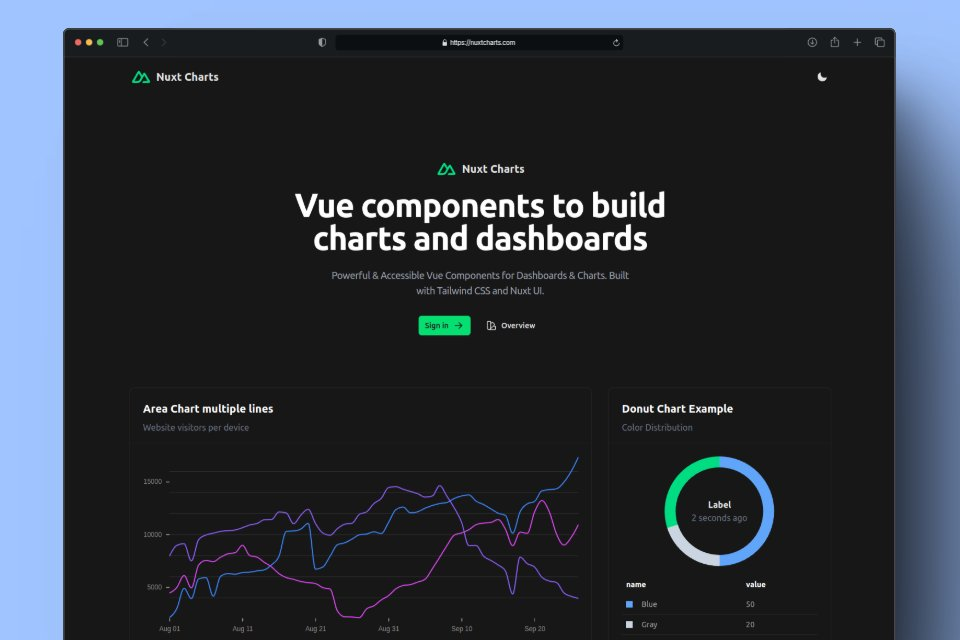
# Vue-chrts
A Vue 3 charts package inspired by [Tremor](https://tremor.so/), built on top of [Unovis](https://unovis.dev). Vue-Chrts provides beautiful, responsive charts for your Vue applications with minimal setup.
[Check the docs and examples](https://nuxtcharts.com/docs)
## Features
- 📊 Multiple chart types: Line, Bar, Area, Stacked Area, Donut
- 🎨 Customizable
- 📱 Responsive design
- 💡 Simple, intuitive API
- 🚀 Built with Vue 3 and TypeScript
[Check the docs and examples](https://nuxtcharts.com/docs)
## Installation Nuxt
```bash
# npm
npm install nuxt-charts
# yarn
yarn add nuxt-charts
# pnpm
pnpm add nuxt-charts
# Add module to your nuxt.config.ts
export default defineNuxtConfig({
modules: ["nuxt-charts"]
});
```
## Installation Vue.js
```bash
# npm
npm install vue-chrts
# yarn
yarn add vue-chrts
# pnpm
pnpm add vue-chrts
# import component
import { LineChart } from 'vue-chrts';
```
[Check the docs and examples](https://nuxtcharts.com/docs)
## Usage Example
```vue
```
[Check the docs and examples](https://nuxtcharts.com/docs)
## Available Charts
- `LineChart`
- `BarChart`
- `AreaChart`
- `AreaStackedChart`
- `DonutChart`
## Credits
This library is inspired by [Tremor](https://tremor.so/) and built on top of [Unovis](https://unovis.dev).
## License
MIT