## Import chart data from existing table element
* This section introduces about import chart data from table element feature.
***
### 1. Preperation
If you want to import chart data from existing table element, you should get table element's reference or table should be attatched to HTML document and it has id property to find.
#### Example
```javascript
// ...
var tableElement = document.getElementById('chart-data-table');
// ...
```
#### OR
```html
...
```
### 2. Table
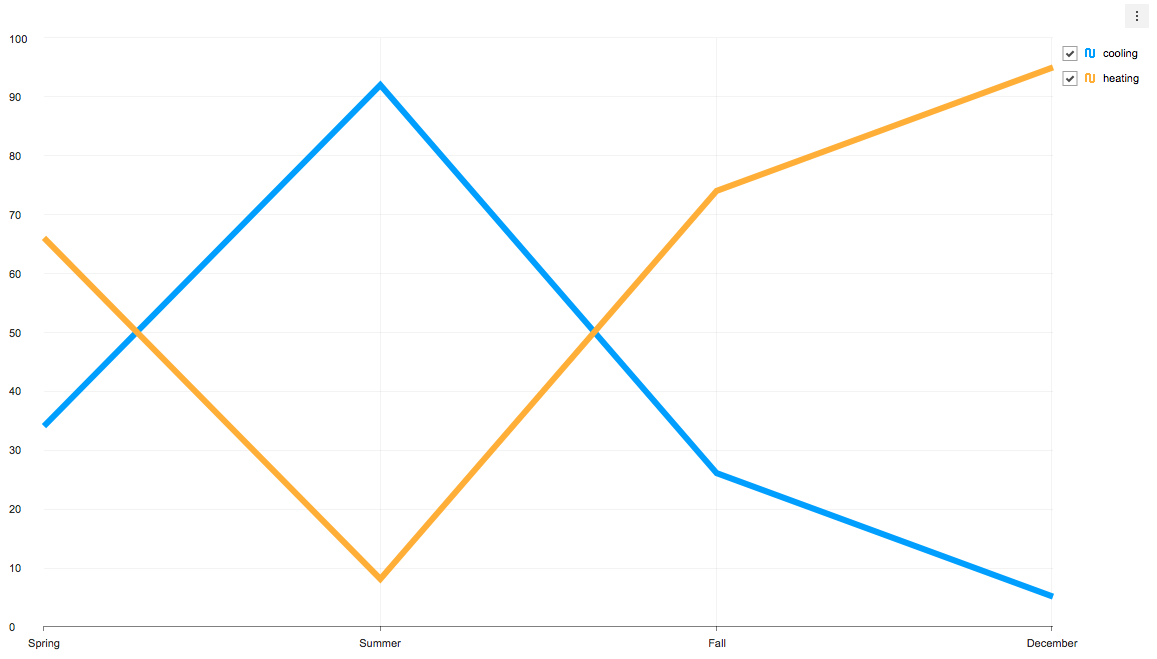
Imported chart data from table following [basic data type](chart-types-bar,column.md#basic-data-type).
Table rows are parsed to series and columns are parsed to categories.
(Table's [0, 0] cell is ignored.)
#### Example
| PowerUsage (%) |
cooling |
heating |
| Spring |
34 |
66 |
| Summer |
92 |
8 |
| Fall |
26 |
74 |
| December |
5 |
95 |
```html
| PowerUsage (%) |
cooling |
heating |
| Spring |
34 |
66 |
| Summer |
92 |
8 |
| Fall |
26 |
74 |
| December |
5 |
95 |
```
### 3. Chart data parameter structure
Basically, chart data parameter has `categories` and `series` property.
Like this.
```javascript
var data = {
categories: ['Jan', 'Feb', 'Mar','Apr', 'May', 'June', 'July', 'Aug', 'Sep', 'Oct', 'Nov', 'Dec'],
series: [
{
name: 'Seoul',
data: [[-8.3, 0.3], [-5.8, 3.1], [-0.6, 9.1], [5.8, 16.9], [11.5, 22.6], [16.6, 26.6], [21.2, 28.8], [21.8, 30.0], [15.8, 25.6], [8.3, 19.6], [1.4, 11.1], [-5.2, 3.2]]
}
]
};
```
In this case, you need to import chart data from table. There is no need to define `categories` and `series` property to create chart. Only `table` property required.
And here is table data importing example of `data` object.
##### Example
```javascript
// ...
var table = document.getElementById('data-table-id');
var data = {
table: {
elementId: 'data-table-id' // table element's id
// or
// element: table
}
};
tui.chart.barChart(container, data);
```
### Result
- Bar chart

- Line chart