## Bar chart and column chart
* This section describes how to create bar chart and column chart with options.
* You can refer to the [Getting started](getting-started.md) for base installation of Toast UI Chart.
***
### Data type
Bar chart and column chart use the basic and range data type.
#### Basic data type
Basic data type is default type for Toast UI Chart.
```javascript
var rawData = {
categories: ['cate1', 'cate2', 'cate3'],
series: [
{
name: 'Legend1',
data: [20, 30, 50]
},
{
name: 'Legend2',
data: [40, 40, 60]
},
{
name: 'Legend3',
data: [60, 50, 10]
},
{
name: 'Legend4',
data: [80, 10, 70]
}
]
};
```
#### Range data type
Range data type is used to represent the range of data.
If you follow this example, you can use range data.
```javascript
var rawData = {
categories: ['cate1', 'cate2', 'cate3'],
series: [
{
name: 'Legend1',
data: [[10, 20], [20, 30], [40, 60]]
},
//...
]
};
```
***
### Creating a basic chart
##### Example
```javascript
// bar chart
tui.chart.barChart(container, data);
// column chart
tui.chart.columnChart(container, data);
```
***
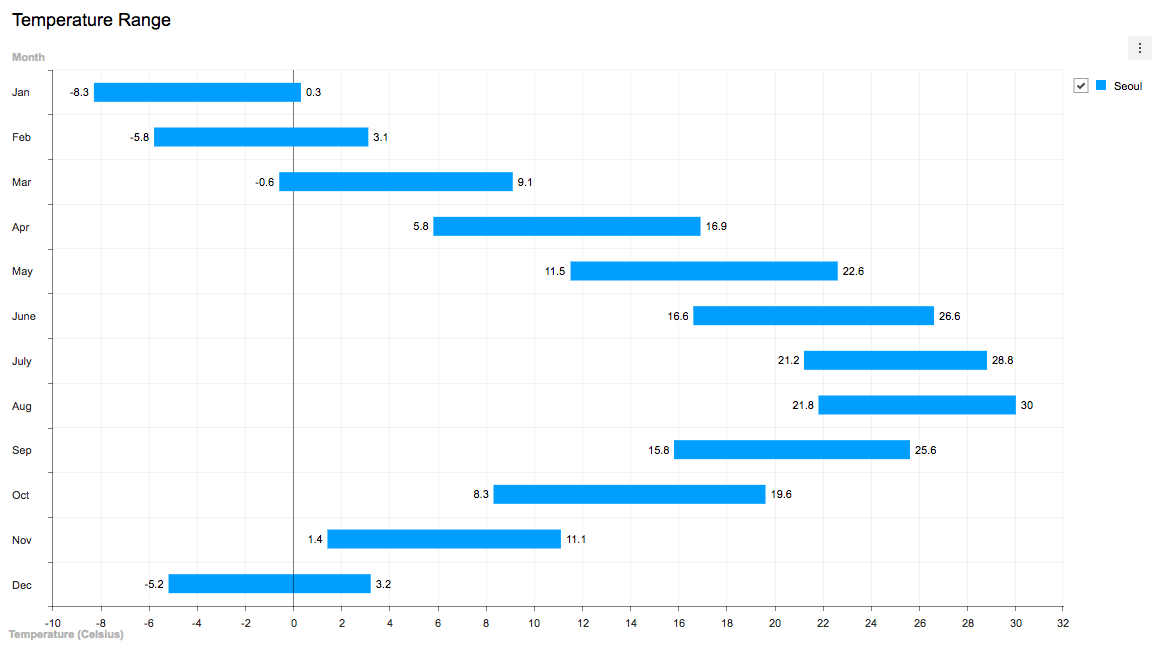
### Creating a range chart
You can create range chart by using range data type.
```javascript
//...
var rawData = {
categories: ['Jan', 'Feb', 'Mar','Apr', 'May', 'June', 'July', 'Aug', 'Sep', 'Oct', 'Nov', 'Dec'],
series: [
{
name: 'Seoul',
data: [[-8.3, 0.3], [-5.8, 3.1], [-0.6, 9.1], [5.8, 16.9], [11.5, 22.6], [16.6, 26.6], [21.2, 28.8], [21.8, 30.0], [15.8, 25.6], [8.3, 19.6], [1.4, 11.1], [-5.2, 3.2]]
}
]
};
tui.chart.barChart(container, rawData);
```
* _[Sample](https://nhnent.github.io/tui.chart/latest/tutorial-example01-06-bar-chart-range-data.html)_
***
### Creating a stacked chart
You can create a stacked chart by setting the `series.stackType` option.
The stacked chart has two types, 'normal' and 'percent'.
#### Stacked bar chart of normal type
##### Example
```javascript
//...
var options = {
//...
series: {
stackType: 'normal'
}
};
tui.chart.barChart(container, rawData, options);
```

* _[Sample](https://nhnent.github.io/tui.chart/latest/tutorial-example01-03-bar-chart-normal-stack.html)_
#### Stacked column chart of percent type
##### Example
```javascript
//...
var options = {
//...
series: {
stackType: 'percent'
}
};
tui.chart.columnChart(container, rawData, options);
```

* _[Sample](https://nhnent.github.io/tui.chart/latest/tutorial-example02-03-column-chart-percent-stack.html)_
#### Group stacked column chart
If you add the `stack` properties to the data, you can create group stacked chart.
```javascript
//...
var rawData = {
categories: ["0 ~ 9", "10 ~ 19", "20 ~ 29", "30 ~ 39", "40 ~ 49", "50 ~ 59", "60 ~ 69", "70 ~ 79", "80 ~ 89", "90 ~ 99", "100 ~"],
series: [
{
name: 'Male - Seoul',
data: [400718, 506749, 722122, 835851, 850007, 773094, 496232, 267037, 67004, 7769, 1314],
stack: 'Male'
},
{
name: 'Female - Seoul',
data: [380595, 472893, 724408, 829149, 853032, 812687, 548381, 316142, 127406, 22177, 3770],
stack: 'Female'
},
{
name: 'Male - Incheon',
data: [139283, 167132, 209256, 233977, 261195, 251151, 127721, 61452, 17138, 1974, 194],
stack: 'Male'
},
{
name: 'Female - Incheon',
data: [132088, 155895, 192760, 221250, 255601, 243374, 130406, 80763, 38005, 6057, 523],
stack: 'Female'
}
]
};
var options = {
//...
series: {
stackType: 'normal'
}
};
tui.chart.columnChart(container, rawData, options);
```

* _[Sample](https://nhnent.github.io/tui.chart/latest/tutorial-example02-04-column-chart-group-stack.html)_
***
### Creating a diverging chart
Using `series.diverging` option, you can create a normal diverging chart that is like population distribution chart.
If you use `yAxis.align=center` option, you can create diverging chart, which yAxis is placed at the center.
And also use `series.stackType` option to create stacked diverging chart.
#### Diverging bar Chart
The diverging chart uses the first and second elements in `data.series`.
Also, using two `yAxis` options, you can place Y axes the left and right.
##### Example
```javascript
//...
var rawData = {
categories: ['100 ~', '90 ~ 99', '80 ~ 89', '70 ~ 79', '60 ~ 69', '50 ~ 59', '40 ~ 49', '30 ~ 39', '20 ~ 29', '10 ~ 19', '0 ~ 9'],
series: [
{
name: 'Male',
data: [3832, 38696, 395906, 1366738, 2482657, 4198869, 4510524, 3911135, 3526321, 2966126, 2362433]
},
{
name: 'Female',
data: [12550, 128464, 839761, 1807901, 2630336, 4128479, 4359815, 3743214, 3170926, 2724383, 2232516]
}
]
};
var options = {
//...
yAxis: [{
title: 'Age Group'
}, {
title: 'Age Group'
}],
series: {
diverging: true
}
};
tui.chart.barChart(container, rawData, options);
```

* _[Sample](https://nhnent.github.io/tui.chart/latest/tutorial-example01-04-bar-chart-diverging.html)_
#### Diverging bar chart, which yAxis is placed at the center.
If you set single yAxis option and setting `yAxis.align` to 'center', you can create diverging chart, which yAxis is placed at the center.
##### Example
```javascript
//...
var rawData = {
categories: ['100 ~', '90 ~ 99', '80 ~ 89', '70 ~ 79', '60 ~ 69', '50 ~ 59', '40 ~ 49', '30 ~ 39', '20 ~ 29', '10 ~ 19', '0 ~ 9'],
series: [
{
name: 'Male',
data: [3832, 38696, 395906, 1366738, 2482657, 4198869, 4510524, 3911135, 3526321, 2966126, 2362433]
},
{
name: 'Female',
data: [12550, 128464, 839761, 1807901, 2630336, 4128479, 4359815, 3743214, 3170926, 2724383, 2232516]
}
]
};
var options = {
//...
yAxis: {
title: 'Age Group',
align: 'center'
},
series: {
diverging: true
}
};
tui.chart.barChart(container, rawData, options);
```

* _[Sample](https://nhnent.github.io/tui.chart/latest/tutorial-example01-05-bar-chart-diverging-and-center-yaxis.html)_
#### Stacked diverging column chart
The stacked diverging chart is groupings based on the stack properties of `data.series` elements,
and then uses the first and second group.
##### Example
```javascript
//...
var rawData = {
categories: ["0 ~ 9", "10 ~ 19", "20 ~ 29", "30 ~ 39", "40 ~ 49", "50 ~ 59", "60 ~ 69", "70 ~ 79", "80 ~ 89", "90 ~ 99", "100 ~"],
series: [
{
name: 'Seoul Male',
data: [400718, 506749, 722122, 835851, 850007, 773094, 496232, 267037, 67004, 7769, 1314],
stack: 'Male'
},
{
name: 'Seoul Female',
data: [380595, 472893, 724408, 829149, 853032, 812687, 548381, 316142, 127406, 22177, 3770],
stack: 'Female'
},
{
name: 'Incheon Male',
data: [139283, 167132, 209256, 233977, 261195, 251151, 127721, 61452, 17138, 1974, 194],
stack: 'Male'
},
{
name: 'Incheon Female',
data: [132088, 155895, 192760, 221250, 255601, 243374, 130406, 80763, 38005, 6057, 523],
stack: 'Female'
}
]
};
var options = {
//...
series: {
diverging: true,
stackType: 'normal'
}
};
tui.chart.columnChart(container, rawData, options);
```

* _[Sample](https://nhnent.github.io/tui.chart/latest/tutorial-example02-05-column-chart-diverging-and-stacked.html)_