/**
* The ui-react-dom-charts module of the TinyBase project provides components to
* make it easy to create web-based reactive charts with Store and Queries
* objects.
*
* The components in this module use the react-dom module and so are not
* appropriate for environments like React Native (although those in the
* lower-level ui-react module are).
*
* For a full list of SVG class names that can be styled with CSS, see the Using
* Charts guide.
* @packageDocumentation
* @module ui-react-dom-charts
* @since v8.5.0
*/
import type {ReactNode} from 'react';
import type {Id} from '../common/index.d.ts';
import type {
ComponentReturnType,
QueriesOrQueriesId,
StoreOrStoreId,
} from '../ui-react/index.d.ts';
/**
* The ChartProps type describes the props that are used to configure the chart
* element that renders a chart.
* @category Configuration
* @since v8.5.0
*/
export type ChartProps = {
/**
* An optional string that will be used as the class attribute of the chart's
* SVG element. This can be used as the root selector for styling chart
* internals, as shown in the Using Charts guide.
* @category Prop
* @since v8.5.0
*/
readonly className?: string;
};
/**
* The TableSourceProps type describes the props that bind a chart to a
* Table in a Store.
* @category Configuration
* @since v8.5.0
*/
export type TableSourceProps = {
/**
* The Id of the Table in the Store to chart.
* @category Prop
* @since v8.5.0
*/
readonly tableId: Id;
/**
* The Store to chart, or the Id of a Store that is registered with the
* Provider component.
* @category Prop
* @since v8.5.0
*/
readonly store?: StoreOrStoreId;
/**
* This prop is not used when binding a chart to a Table.
* @category Prop
* @since v8.5.0
*/
readonly queryId?: never;
/**
* This prop is not used when binding a chart to a Table.
* @category Prop
* @since v8.5.0
*/
readonly queries?: never;
};
/**
* The QuerySourceProps type describes the props that bind a chart to a
* Query in a Queries object.
* @category Configuration
* @since v8.5.0
*/
export type QuerySourceProps = {
/**
* The Id of the query in the Queries object to chart.
* @category Prop
* @since v8.5.0
*/
readonly queryId: Id;
/**
* The Queries object to chart, or the Id of a Queries object that is
* registered with the Provider component.
* @category Prop
* @since v8.5.0
*/
readonly queries?: QueriesOrQueriesId;
/**
* This prop is not used when binding a chart to a Query.
* @category Prop
* @since v8.5.0
*/
readonly tableId?: never;
/**
* This prop is not used when binding a chart to a Query.
* @category Prop
* @since v8.5.0
*/
readonly store?: never;
};
/**
* The BindingProps type describes the props that bind a LineChart
* component or BarChart component to Cell values in TinyBase data. An x Cell
* value can be a finite number, string, or boolean. A y Cell value must be a
* finite number.
* @category Configuration
* @since v8.5.0
*/
export type BindingProps = {
/**
* The Id of the Cell that provides each data point's x value. Finite numbers
* can be used as continuous linear x values in line charts, ISO date strings
* can be used as time x values, and other strings and booleans are used as
* category values. Boolean category labels are rendered as `true` and
* `false`.
* @category Prop
* @since v8.5.0
*/
readonly xCellId: Id;
/**
* The Id of the Cell that provides each data point's y value. Only finite
* numbers are charted; rows with missing, non-numeric, or non-finite y values
* are ignored.
* @category Prop
* @since v8.5.0
*/
readonly yCellId: Id;
/**
* The Id of the Cell used to sort the charted rows.
* @category Prop
* @since v8.5.0
*/
readonly sortCellId?: Id;
/**
* Whether the charted rows should be sorted in descending order.
* @category Prop
* @since v8.5.0
*/
readonly descending?: boolean;
/**
* The number of sorted rows to skip before charting.
* @category Prop
* @since v8.5.0
*/
readonly offset?: number;
/**
* The maximum number of sorted rows to chart.
* @category Prop
* @since v8.5.0
*/
readonly limit?: number;
};
/**
* The SeriesProps type describes the props that bind a chart series to Cell
* values in TinyBase data. An x Cell value can be a finite number, string, or
* boolean. A y Cell value must be a finite number.
* @category Configuration
* @since v8.5.0
*/
export type SeriesProps = {
/**
* An optional string that will be added to the class attribute of the series'
* SVG group element.
* @category Prop
* @since v8.5.0
*/
readonly className?: string;
/**
* The Id of the Cell that provides each data point's x value. Finite numbers
* can be used as continuous linear x values in line series, ISO date strings
* can be used as time x values, and other strings and booleans are used as
* category values. Boolean category labels are rendered as `true` and
* `false`.
* @category Prop
* @since v8.5.0
*/
readonly xCellId: Id;
/**
* The Id of the Cell that provides each data point's y value. Only finite
* numbers are charted; rows with missing, non-numeric, or non-finite y values
* are ignored.
* @category Prop
* @since v8.5.0
*/
readonly yCellId: Id;
/**
* An optional label to use for the series in axis titles and tooltips,
* defaulting to the y Cell Id.
* @category Prop
* @since v8.5.0
*/
readonly label?: string;
/**
* The Id of the Cell used to sort the charted rows.
* @category Prop
* @since v8.5.0
*/
readonly sortCellId?: Id;
/**
* Whether the charted rows should be sorted in descending order.
* @category Prop
* @since v8.5.0
*/
readonly descending?: boolean;
/**
* The number of sorted rows to skip before charting.
* @category Prop
* @since v8.5.0
*/
readonly offset?: number;
/**
* The maximum number of sorted rows to chart.
* @category Prop
* @since v8.5.0
*/
readonly limit?: number;
};
/**
* The XAxisScale type describes how x-axis values should be interpreted:
* `auto`, `category`, `linear`, or `time`.
* @category Configuration
* @since v8.5.0
*/
export type XAxisScale = 'auto' | 'category' | 'linear' | 'time';
/**
* The TimestampUnit type describes the unit used by numeric timestamp values on
* a time x axis: `millisecond` or `second`.
* @category Configuration
* @since v8.5.0
*/
export type TimestampUnit = 'millisecond' | 'second';
/**
* The TimeValue type describes values that can be used for explicit bounds and
* ticks on a time x axis: numbers, ISO date strings, or Date objects.
* @category Configuration
* @since v8.5.0
*/
export type TimeValue = number | string | Date;
/**
* The BaseXAxisProps type describes props shared by all x-axis configurations.
* @category Configuration
* @since v8.5.0
*/
export type BaseXAxisProps = {
/**
* An optional string that will be added to the class attribute of the x-axis
* SVG group element.
* @category Prop
* @since v8.5.0
*/
readonly className?: string;
/**
* An optional title to use for the x axis, defaulting to the x Cell Id, or to
* a combined title when multiple series use different x Cell Ids.
* @category Prop
* @since v8.5.0
*/
readonly title?: string;
/**
* An optional preferred number of ticks to render on a continuous x axis.
*
* The actual number of ticks may vary so that labels remain readable.
* @category Prop
* @since v8.5.0
*/
readonly tickCount?: number;
};
/**
* The LinearXAxisProps type describes x-axis configuration for automatically
* inferred, categorical, and linear axes.
* @category Configuration
* @since v8.5.0
*/
export type LinearXAxisProps = BaseXAxisProps & {
/**
* An optional scale to use for the x axis.
*
* The default `auto` scale infers linear axes from numeric line-series x
* values, time axes from ISO date strings, and category axes otherwise. Use
* `time` explicitly for numeric Unix timestamp values.
* @category Prop
* @since v8.5.0
*/
readonly scale?: 'auto' | 'category' | 'linear';
/**
* The unit for numeric timestamp values on a time x axis.
*
* This prop is ignored unless the scale prop is `time`, and defaults to
* `millisecond`.
* @category Prop
* @since v8.5.0
*/
readonly timestampUnit?: never;
/**
* An optional minimum x-axis bound for continuous numeric or time x values.
*
* This prop is ignored when the x axis is categorical.
* @category Prop
* @since v8.5.0
*/
readonly min?: number;
/**
* An optional maximum x-axis bound for continuous numeric or time x values.
*
* This prop is ignored when the x axis is categorical.
* @category Prop
* @since v8.5.0
*/
readonly max?: number;
/**
* Optional tick values to use for a continuous numeric or time x axis.
*
* This prop is ignored when the x axis is categorical.
* @category Prop
* @since v8.5.0
*/
readonly ticks?: readonly number[];
/**
* An optional function for formatting x-axis tick labels.
*
* It receives the original tick value for category axes, the numeric tick
* value for linear axes, or a Date object for time axes. For time axes, the
* normalized epoch millisecond timestamp is provided as a second argument.
* @category Prop
* @since v8.5.0
*/
readonly tickFormatter?: (tick: boolean | number | string) => string;
};
/**
* The TimeXAxisProps type describes x-axis configuration for time axes.
* @category Configuration
* @since v8.5.0
*/
export type TimeXAxisProps = BaseXAxisProps & {
/**
* An optional scale to use for the x axis.
*
* The default `auto` scale infers linear axes from numeric line-series x
* values, time axes from ISO date strings, and category axes otherwise. Use
* `time` explicitly for numeric Unix timestamp values.
* @category Prop
* @since v8.5.0
*/
readonly scale: 'time';
/**
* The unit for numeric timestamp values on a time x axis.
*
* This prop is ignored unless the scale prop is `time`, and defaults to
* `millisecond`.
* @category Prop
* @since v8.5.0
*/
readonly timestampUnit?: TimestampUnit;
/**
* An optional minimum x-axis bound for continuous numeric or time x values.
*
* This prop is ignored when the x axis is categorical.
* @category Prop
* @since v8.5.0
*/
readonly min?: TimeValue;
/**
* An optional maximum x-axis bound for continuous numeric or time x values.
*
* This prop is ignored when the x axis is categorical.
* @category Prop
* @since v8.5.0
*/
readonly max?: TimeValue;
/**
* Optional tick values to use for a continuous numeric or time x axis.
*
* This prop is ignored when the x axis is categorical.
* @category Prop
* @since v8.5.0
*/
readonly ticks?: readonly TimeValue[];
/**
* An optional function for formatting x-axis tick labels.
*
* It receives the original tick value for category axes, the numeric tick
* value for linear axes, or a Date object for time axes. For time axes, the
* normalized epoch millisecond timestamp is provided as a second argument.
* @category Prop
* @since v8.5.0
*/
readonly tickFormatter?: (tick: Date, timestamp: number) => string;
};
/**
* The XAxisProps type describes the props that configure the x axis of a
* CartesianChart component, LineChart component, or BarChart component.
*
* The x axis is inferred by default. Use an XAxis component child when you
* want to override its title, scale, continuous bounds, tick values, tick
* count, tick labels, or SVG class name.
* @category Configuration
* @since v8.5.0
*/
export type XAxisProps = LinearXAxisProps | TimeXAxisProps;
/**
* The YAxisProps type describes the props that configure the y axis of a
* CartesianChart component.
*
* The y axis is inferred by default. Use a YAxis component child when you want
* to override its title, numeric bounds, tick values, tick count, tick labels,
* or SVG class name.
* @category Configuration
* @since v8.5.0
*/
export type YAxisProps = {
/**
* An optional string that will be added to the class attribute of the y-axis
* SVG group element.
* @category Prop
* @since v8.5.0
*/
readonly className?: string;
/**
* An optional title to use for the y axis, defaulting to the y Cell Id, y
* series label, or a combined title when multiple series use different y Cell
* Ids or labels.
* @category Prop
* @since v8.5.0
*/
readonly title?: string;
/**
* An optional minimum y-axis bound.
* @category Prop
* @since v8.5.0
*/
readonly min?: number;
/**
* An optional maximum y-axis bound.
* @category Prop
* @since v8.5.0
*/
readonly max?: number;
/**
* Optional numeric tick values to use for the y axis.
* @category Prop
* @since v8.5.0
*/
readonly ticks?: readonly number[];
/**
* An optional preferred number of ticks to render on the y axis.
*
* The actual number of ticks may vary so that labels remain readable.
* @category Prop
* @since v8.5.0
*/
readonly tickCount?: number;
/**
* An optional function for formatting y-axis tick labels.
*
* It receives the numeric tick value.
* @category Prop
* @since v8.5.0
*/
readonly tickFormatter?: (tick: number) => string;
};
/**
* The CartesianChart component renders a chart frame and provides TinyBase
* source and layout context to LineSeries component and BarSeries component
* children.
*
* See the Composing Charts (React) demo for this component in action:
*
* 
*
* The series children declare their own xCellId and yCellId bindings. The
* optional XAxis component and YAxis component children can be used to
* configure axis titles, bounds, ticks, and tick formatting.
* @category Store components
* @since v8.5.0
* @example
* This example creates a Store and renders two LineSeries component children
* in a CartesianChart component.
*
* ```jsx
* import React from 'react';
* import {createRoot} from 'react-dom/client';
* import {createStore} from 'tinybase';
* import {CartesianChart, LineSeries} from 'tinybase/ui-react-dom-charts';
*
* const store = createStore().setTable('pets', {
* hamsters: {order: 1, sold: 12, returned: 1},
* rabbits: {order: 2, sold: 9, returned: 2},
* });
* const App = () => (
*
*
*
*
* );
* const app = document.createElement('div');
* createRoot(app).render(); // !act
* console.log(app.firstChild?.nodeName.toLowerCase());
* // -> 'svg'
* ```
*/
export function CartesianChart(
props: (TableSourceProps | QuerySourceProps) &
ChartProps & {readonly children?: ReactNode},
): ComponentReturnType;
/**
* The XAxis component configures the x axis of a CartesianChart component,
* LineChart component, or BarChart component.
*
* It is a configuration child rather than a separately rendered SVG element:
* include zero or one XAxis component in a chart's children. If omitted, the x
* axis is inferred from the chart's series.
*
* See the Axis Overrides (React) demo for this component in action:
*
* 
* @category Store components
* @since v8.5.0
*/
export function XAxis(props: XAxisProps): ComponentReturnType;
/**
* The YAxis component configures the y axis of a CartesianChart component.
*
* It is a configuration child rather than a separately rendered SVG element:
* include zero or one YAxis component in a CartesianChart component's children.
* If omitted, the y axis is inferred from the chart's series.
*
* See the Axis Overrides (React) demo for this component in action:
*
* 
* @category Store components
* @since v8.5.0
*/
export function YAxis(props: YAxisProps): ComponentReturnType;
/**
* The LineSeries component renders a line series in a CartesianChart component.
* If every x value in every series is a finite number, the x axis is rendered
* as a continuous linear scale. ISO date strings are inferred as a time scale.
* Other strings and booleans are rendered categorically. When sortCellId is
* omitted, rows are sorted by xCellId.
*
* See the Composing Charts (React) demo for this component in action:
*
* 
* @category Store components
* @since v8.5.0
*/
export function LineSeries(props: SeriesProps): ComponentReturnType;
/**
* The BarSeries component renders a bar series in a CartesianChart component.
* Its x values are rendered categorically by default, even when they are finite
* numbers. Add an XAxis component with a `linear` or `time` scale to position
* bars continuously. Boolean category labels are rendered as `true` and
* `false`.
*
* See the Composing Charts (React) demo for this component in action:
*
* 
* @category Store components
* @since v8.5.0
*/
export function BarSeries(props: SeriesProps): ComponentReturnType;
/**
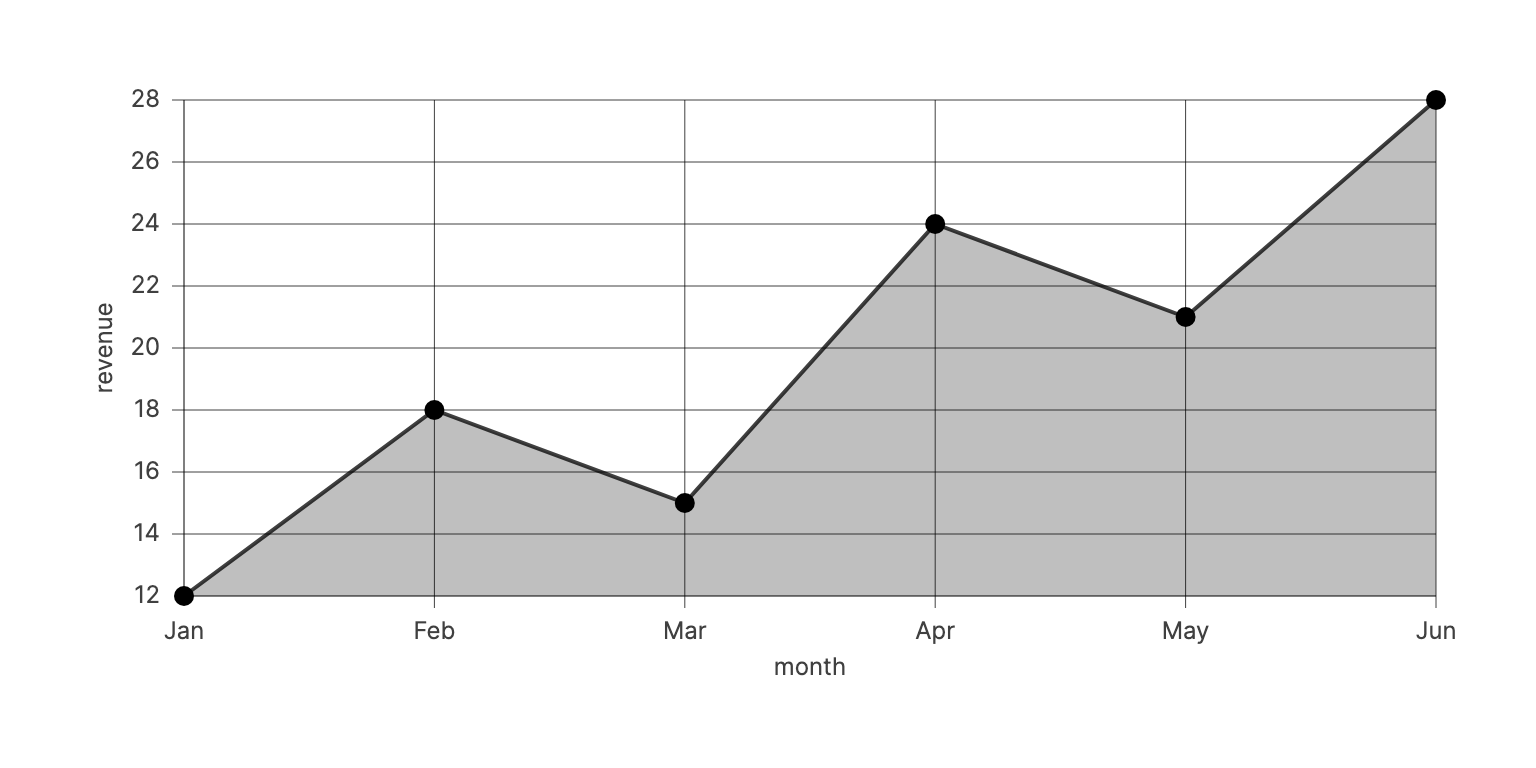
* The LineChart component renders a line chart from TinyBase data. If every x
* value is a finite number, the x axis is rendered as a continuous linear
* scale. ISO date strings are inferred as a time scale. Other strings and
* booleans are rendered categorically. Add XAxis component and YAxis component
* children to override axis configuration. When sortCellId is omitted, rows are
* sorted by xCellId.
*
* See the (React) demo for this component in action:
*
* 
* @category Store components
* @since v8.5.0
* @example
* This example creates a Provider context into which a default Store is
* provided. The LineChart component then renders an SVG chart from Cells in the
* `pets` Table.
*
* ```jsx
* import React from 'react';
* import {createRoot} from 'react-dom/client';
* import {createStore} from 'tinybase';
* import {Provider} from 'tinybase/ui-react';
* import {LineChart} from 'tinybase/ui-react-dom-charts';
*
* const App = ({store}) => (
*
*
*
* );
*
* const store = createStore().setTable('pets', {
* hamsters: {order: 1, sold: 12},
* rabbits: {order: 2, sold: 9},
* });
* const app = document.createElement('div');
* createRoot(app).render(); // !act
* console.log(app.firstChild?.nodeName.toLowerCase());
* // -> 'svg'
* console.log(app.firstChild?.getAttribute('class'));
* // -> 'sales'
* ```
*/
export function LineChart(
props: (TableSourceProps | QuerySourceProps) &
BindingProps &
ChartProps & {readonly children?: ReactNode},
): ComponentReturnType;
/**
* The BarChart component renders a bar chart from TinyBase data. Its x values
* are rendered categorically by default, even when they are finite numbers. Add
* an XAxis component with a `linear` or `time` scale to position bars
* continuously. Boolean category labels are rendered as `true` and `false`.
*
* See the Sorting And Types (React) demo for this component in action:
*
* 
* @category Store components
* @since v8.5.0
* @example
* This example creates a Queries object and provides it through Provider
* context. The BarChart component then renders an SVG chart from Cells in the
* `bySpecies` query.
*
* ```jsx
* import React from 'react';
* import {createRoot} from 'react-dom/client';
* import {createQueries, createStore} from 'tinybase';
* import {Provider} from 'tinybase/ui-react';
* import {BarChart} from 'tinybase/ui-react-dom-charts';
*
* const App = ({queries}) => (
*
*
*
* );
*
* const store = createStore().setTable('pets', {
* hamsters: {species: 'hamster', sold: 12},
* rabbits: {species: 'rabbit', sold: 9},
* });
* const queries = createQueries(store).setQueryDefinition(
* 'bySpecies',
* 'pets',
* ({select}) => {
* select('species');
* select('sold');
* },
* );
* const app = document.createElement('div');
* createRoot(app).render(); // !act
* console.log(app.firstChild?.nodeName.toLowerCase());
* // -> 'svg'
* ```
*/
export function BarChart(
props: (TableSourceProps | QuerySourceProps) &
BindingProps &
ChartProps & {readonly children?: ReactNode},
): ComponentReturnType;