

Stencil.js wrapper for ApexCharts to build interactive visualizations in modern web applications.
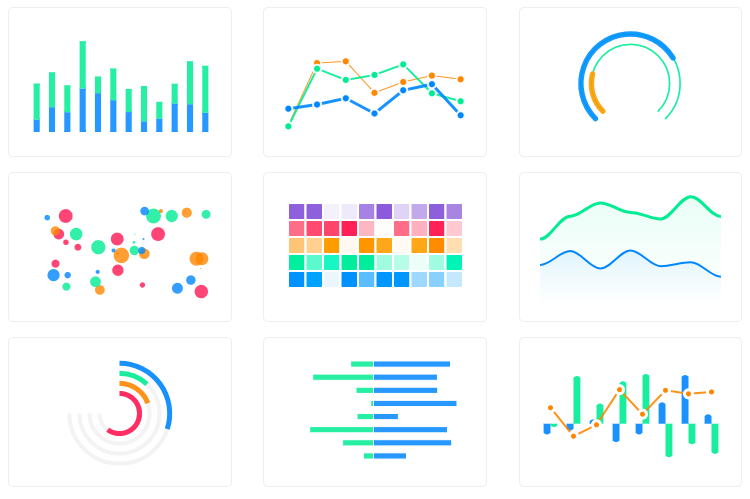
## ⚠️ Breaking Changes in v3.0.0
**Major Updates:**
- 🚀 **Stencil v4** support (requires Stencil 4.x)
- 📊 **ApexCharts v4+** support (requires ApexCharts >=4.0.0)
- 🔧 **TypeScript 5.6** with modern ES2022 target
- 🎯 **New component methods**: `updateSeries()`, `refresh()`
- 📱 **Better responsive behavior** with ResizeObserver
- ⚡ **Performance improvements** and memory leak fixes
**Migration Required:** This is a breaking release. See [Migration Guide](#migration-from-v2x) below.
## Installation
### NPM (Recommended)
```bash
# Install both packages
npm install stencil-apexcharts apexcharts
# Peer dependencies
npm install apexcharts@^4.0.0
```
### Script Tag (CDN)
```html
```
### Modern Framework Integration
#### Stencil/Vanilla JS
```typescript
import { defineCustomElements } from "stencil-apexcharts/loader";
defineCustomElements(window);
```
#### React
```typescript
import { defineCustomElements } from "stencil-apexcharts/loader";
defineCustomElements(window);
// In your component
;
```
#### Vue 3
```typescript
// main.ts
import { defineCustomElements } from 'stencil-apexcharts/loader';
defineCustomElements(window);
// In component
```
## Usage
### Basic Example
```html
```
### Advanced Example with Toolbar
```html
```
### Stacked Charts
```html
```
## API Reference
### Properties
| Property | Attribute | Type | Default | Description |
| ----------- | ------------ | ----------------------- | ----------- | --------------------------------- |
| `type` | `type` | `ChartType` | `undefined` | Chart type (line, bar, pie, etc.) |
| `width` | `width` | `string \| number` | `undefined` | Chart width (e.g., '100%', 400) |
| `height` | `height` | `string \| number` | `undefined` | Chart height (e.g., '300px', 350) |
| `series` | -- | `ApexOptions['series']` | `undefined` | Chart data series |
| `options` | -- | `ApexOptions` | `undefined` | ApexCharts configuration object |
| `toolbar` | -- | `ChartToolbar` | `undefined` | Toolbar configuration |
| `stacked` | `stacked` | `boolean` | `undefined` | Enable stacked charts |
| `stackType` | `stack-type` | `'100%' \| 'normal'` | `undefined` | Stack type for stacked charts |
### Methods
All methods return `Promise` and can be called programmatically:
```typescript
// Update chart configuration
await chart.updateOptions(newOptions, redrawPaths?, animate?);
// Update chart series data
await chart.updateSeries(newSeries, animate?);
// Completely refresh/recreate the chart
await chart.refresh();
```
### Events & Lifecycle
Charts automatically update when properties change:
```javascript
// This will automatically update the chart
chart.series = newData;
chart.options = newOptions;
// Or update programmatically
chart.updateSeries([{ name: "New Data", data: [1, 2, 3] }]);
```
## Migration from v2.x
### Breaking Changes
1. **Peer Dependencies Updated**
```bash
# Old
npm install apexcharts@^3.26.1
# New
npm install apexcharts@^4.0.0
```
2. **Stencil v4 Required**
```bash
npm install @stencil/core@^4.22.0
```
3. **New Component Methods**
```javascript
// New methods available
await chart.updateSeries(newSeries);
await chart.refresh();
```
4. **Improved TypeScript Support**
- Stricter type checking
- Better IntelliSense support
- ES2022 target
### Migration Steps
1. **Update dependencies**:
```bash
npm install stencil-apexcharts@^3.0.0 apexcharts@^4.0.0
```
2. **Check ApexCharts v4 breaking changes**: Review the [ApexCharts v4 migration guide](https://apexcharts.com/docs/migration/)
3. **Update TypeScript config** (if using TypeScript):
```json
{
"compilerOptions": {
"target": "es2022",
"lib": ["dom", "dom.iterable", "es2022"]
}
}
```
4. **Test your charts** to ensure they render correctly with ApexCharts v4
## Development
### Setup
```bash
git clone https://github.com/apexcharts/stencil-apexcharts.git
cd stencil-apexcharts
npm install
```
### Development Server
```bash
npm run start
```
Starts development server at `http://localhost:3333` with hot reloading.
### Building
```bash
npm run build
```
### Testing
```bash
npm run test
```
## Requirements
- **Node.js**: 16+
- **Stencil**: 4.x
- **ApexCharts**: 4.x
- **TypeScript**: 5.x (if using TypeScript)
## Browser Support
- Chrome 88+
- Firefox 78+
- Safari 14+
- Edge 88+
Modern browsers with ES2022 support.
## Contributing
We welcome contributions! Please see our [Contributing Guidelines](CONTRIBUTING.md).
## License
MIT License. See [LICENSE](LICENSE) file for details.