# SciChart.js: High Performance JavaScript Chart Library
> **SciChart.JS v5**
>
> Find out what's new in every Major and Minor release at the [Change Log here](https://www.scichart.com/changelog/scichart-js/)
> **Documentation**
>
> Find out our [Documentation web-site here](https://www.scichart.com/documentation/js/v5/intro)
SciChart.js is a High Performance [JavaScript Chart library](https://www.scichart.com/javascript-chart-features/). Leveraging WebGL and WebAssembly to achieve incredible big-data and real-time performance.
Fast and able to draw millions of datapoints in realtime, our charts will never cause your app to slow down again!
## Why SciChart?
- Learn why we propose SciChart as the [Best JavaScript Chart Library in 2024](https://www.scichart.com/blog/the-best-javascript-chart-10-reasons/) for Big-Data, complex enterprise apps.
- Read performance test results showing SciChart beating Chart.js, HighCharts, Plotly by a wide margin in a [JavaScript Chart Performance Comparison](https://www.scichart.com/blog/scichart-is-the-fastest-js-chart-library-available-and-why-that-matters-in-todays-world/)
- Learn the features and key differences of SciChart.js [JS Charts](https://www.scichart.com/javascript-chart-features/) library.
- Browse the demos of [JavaScript Charts](https://www.scichart.com/demo/react) and [JavaScript 3D Charts](https://www.scichart.com/demo/react/3d-bubble-chart) in our interactive React showcase.
> SciChart has an extremely configurable and extensible API and is
> **perfect for scientific, financial, medical, engineering and enterprise applications**,
> apps with demanding performance requirements or complex and mission critical charting.
[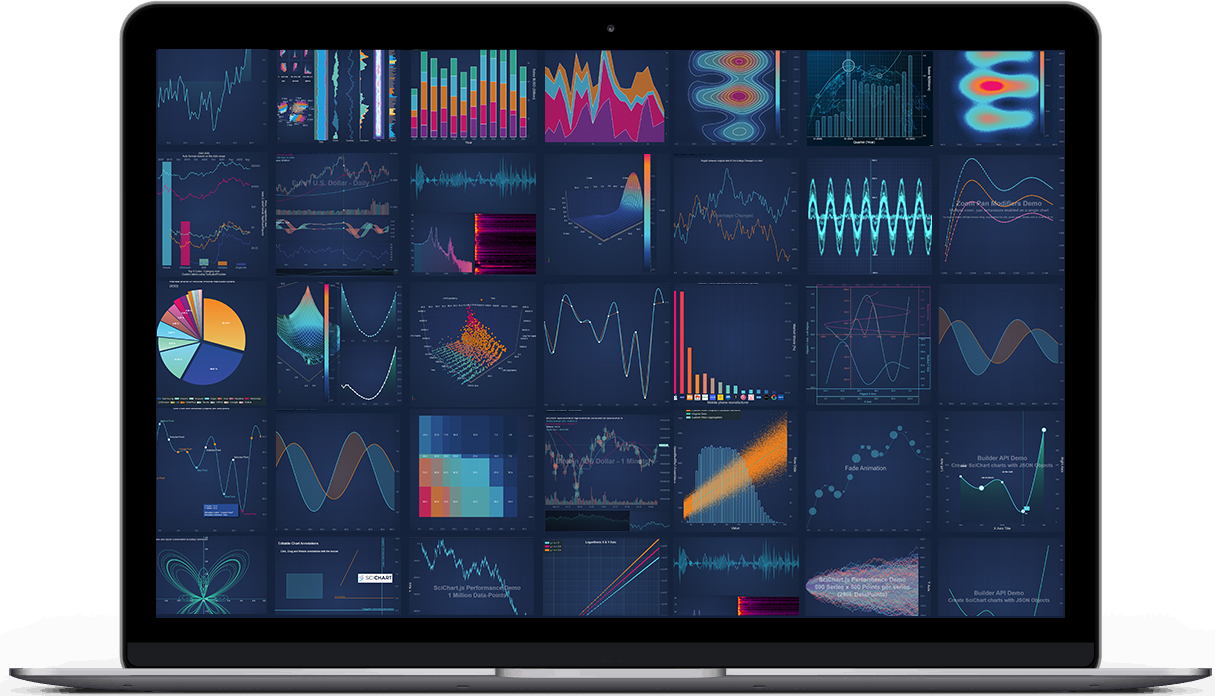](https://www.scichart.com/javascript-chart-features/)
# Releases
In SciChart.js v5 release we’ve focused mostly on performance. Our userbase has demanding requirements from F1 to medical dashboards, IoT telemetry in industrial, aerospace and defense applications and as a result, our team has worked hard over the past few months to make this the leanest, fastest and most feature rich version of SciChart yet.
- [Latest Changes](https://www.scichart.com/changelog/scichart-js/)
- [Financial Drawing Tools v5.2 Release notes](https://www.scichart.com/scichart-js-v5-2-released/) | [Breaking Changes](https://www.scichart.com/documentation/js/v5/whats-new/breaking-changes-v5.1-v5.2/)
- [v5.0 Release notes](https://www.scichart.com/scichart-js-v5-released/) | [Breaking Changes](https://www.scichart.com/documentation/js/v5/whats-new/breaking-changes-v4-v5/)
- [v4.0 Release notes](https://www.scichart.com/scichart-js-v4-0-released/) | [Breaking Changes](https://www.scichart.com/documentation/js/v5/whats-new/breaking-changes-v3-v4/)
- [v3.5 Release notes](https://www.scichart.com/scichart-js-v3-5-released/)
- [Older Releases](https://www.scichart.com/category/scichart-js/)
We release often and if you want to report a bug, request a feature or give general feedback [contact us](https://scichart.com/contact-us)!
## License
> SciChart.js is commercial software which ships with a free community edition for personal, non-commercial, educational or blogger/tutorial use.
>
> **Licensing Links**
>
> - [Free Community Licensing FAQs](https://www.scichart.com/community-licensing/)
> - [Read about our **commercial license terms** here](https://www.scichart.com/scichart-eula/)
> - [**Get Started** by following steps here](https://www.scichart.com/getting-started/scichart-javascript/)
> - [**Purchase commercial licenses** here](https://www.scichart.com/shop/)
> - Academic usage, universities and schools qualify for a free non-watermarked license. Read more about this [here](https://www.scichart.com/educational-discount-programme/).
## Demo Application
- We've published over 100 [JavaScript Chart Demos](https://www.scichart.com/demo/react) with ~100 examples you can try in browser.
- You can clone the repo for the demo app at Github: [github.com/ABTSoftware/SciChart.JS.Examples](https://github.com/ABTSoftware/SciChart.JS.Examples/tree/dev_v5.x)
- Or, checkout our boilerplates for various popular Js frameworks:
- [Vanilla JS](https://github.com/ABTSoftware/SciChart.JS.Examples/tree/dev_v5.x/BoilerPlates/javascript)
- [React](https://github.com/ABTSoftware/SciChart.JS.Examples/tree/dev_v5.x/BoilerPlates/scichart-react) with [scichart-react](https://www.npmjs.com/package/scichart-react) which significantly simplifies wrapping scichart in a react component
- [React + Typescript](https://github.com/ABTSoftware/SciChart.JS.Examples/tree/dev_v5.x/BoilerPlates/react-typescript)
- [React + Vite](https://github.com/ABTSoftware/SciChart.JS.Examples/tree/dev_v5.x/BoilerPlates/react-vite)
- [Vue.js](https://github.com/ABTSoftware/SciChart.JS.Examples/tree/dev_v5.x/BoilerPlates/vue)
- [Angular](https://github.com/ABTSoftware/SciChart.JS.Examples/tree/dev_v5.x/BoilerPlates/angular)
- [Next.js](https://github.com/ABTSoftware/SciChart.JS.Examples/tree/dev_v5.x/BoilerPlates/next)
- [Nuxt](https://github.com/ABTSoftware/SciChart.JS.Examples/tree/dev_v5.x/BoilerPlates/nuxt)
- [Svelte + Vite](https://github.com/ABTSoftware/SciChart.JS.Examples/tree/dev_v5.x/BoilerPlates/svelte-vite)
- [Svelte + Rollup](https://github.com/ABTSoftware/SciChart.JS.Examples/tree/dev_v5.x/BoilerPlates/svelte-rollup)
- [Electron](https://github.com/ABTSoftware/SciChart.JS.Examples/tree/dev_v5.x/BoilerPlates/electron)
# Getting Started
> We've prepared a short [Getting Started guide here](https://www.scichart.com/getting-started/scichart-javascript/).
>
> This will walk you through the entire process of starting in your favourite framework and show you where tutorials and documentation are and examples.
## Useful Links
### Features & benefits
- Learn about [features of SciChart.js](https://www.scichart.com/javascript-chart-features/) here
### Onboarding
- [Tutorials](https://www.scichart.com/documentation/js/v5/get-started/tutorials-js-npm-webpack/tutorial-01-setting-up-npm-project-with-scichart-js/)
- [Getting Started Guide](https://scichart.com/getting-started/scichart-javascript/)
- [Documentation](https://www.scichart.com/documentation/js/v5/intro)
- [CodePen, JSFiddle support](https://www.scichart.com/blog/codepen-codesandbox-and-jsfiddle-support-in-scichart-js/)
### Support
- [Community forums](https://www.scichart.com/questions)
- [Stackoverflow tag](https://stackoverflow.com/tags/scichart)
- [Contact Us (Technical support or sales)](https://www.scichart.com/contact-us/)
### Purchasing
- [Pricing](https://www.scichart.com/shop/)
## Quick Start with NPM and Webpack
> **Tutorial**
>
> See [full npm + Webpack tutorial here](https://www.scichart.com/documentation/js/v5/get-started/tutorials-js-npm-webpack/tutorial-01-setting-up-npm-project-with-scichart-js/)
SciChart.js can be loaded as an ES6 module with Babel or TypeScript transpiler.
1. **Install SciChart.js**
```shell
npm install scichart
```
2. **Create a simple chart** by putting this into `src/index.js` file
```javascript
import { SciChartSurface, NumericAxis } from "scichart";
async function initSciChart() {
const { sciChartSurface, wasmContext } = await SciChartSurface.create("scichart-root");
// Create an X,Y Axis and add to the chart
const xAxis = new NumericAxis(wasmContext);
const yAxis = new NumericAxis(wasmContext);
sciChartSurface.xAxes.add(xAxis);
sciChartSurface.yAxes.add(yAxis);
}
initSciChart();
```
3. **Create src/index.html file**
```html
SciChart.js Tutorial 1
Hello SciChart.js world!
In this example we setup webpack, scichart and create a simple chart with one X and Y axis
```
4. **Run it `npm start`**. As a result you will see a simple line chart.
## Quick Start with Browser Bundle (Iife bundle)
[](https://www.jsdelivr.com/package/npm/scichart)
> **Tutorial**
>
> See the full [browser bundle tutorial here](https://www.scichart.com/documentation/js/v5/get-started/tutorials-cdn/tutorial-01-using-cdn/)
If your environment does not include a bundler like Parcel or Webpack, you can still load SciChart.js using the browser bundle module from [jsDelivr](https://www.jsdelivr.com/package/npm/scichart)
1. **Include index.min.js in your webpage**
```html
```
2. **Create scichart-example.js file with a simple chart**
```javascript
// Equivalent of imports when using index.min.js is to declare global variables like this
const { SciChartSurface, NumericAxis, FastLineRenderableSeries, XyDataSeries } = SciChart;
async function initSciChart() {
// Create the SciChartSurface in the div 'scichart-root'
const { sciChartSurface, wasmContext } = await SciChartSurface.create("scichart-root");
// Create an X,Y Axis and add to the chart
const xAxis = new NumericAxis(wasmContext);
const yAxis = new NumericAxis(wasmContext);
sciChartSurface.xAxes.add(xAxis);
sciChartSurface.yAxes.add(yAxis);
// Add a series
sciChartSurface.renderableSeries.add(
new FastLineRenderableSeries(wasmContext, {
dataSeries: new XyDataSeries(wasmContext, {
xValues: [0, 1, 2, 3, 4],
yValues: [2, 1, 4, 3, 2]
})
})
);
}
```