# react-native-scatter-chart
Very simple scatter chart without native dependencies
 ## Installation
```
npm i --save react-native-scatter-chart
```
(or)
```
yarn add react-native-scatter-chart
```
## Usage
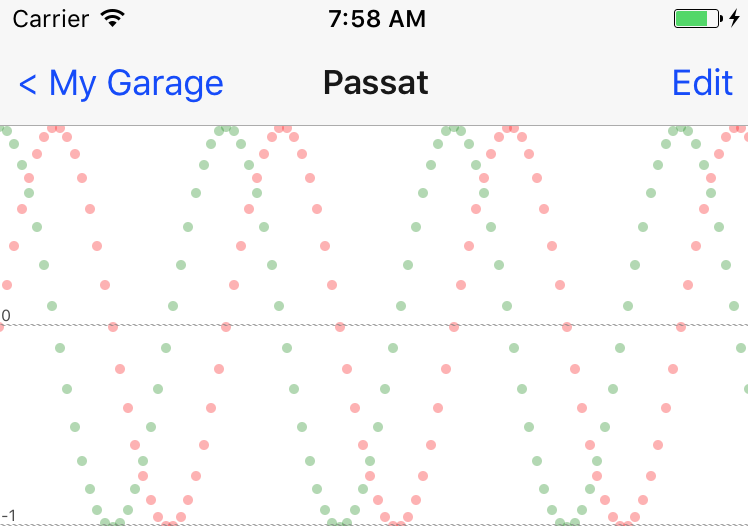
Data format:
```javascript
const chartData = [
{
color: 'red',
unit: '%',
values: [[0,0],[1,0.5877852522924731],[2,0.9510565162951535],[3,0.9510565162951536],[4,0.5877852522924732],[5,1.2246467991473532e-16],[6,-0.587785252292473],[7,-0.9510565162951535],[8,-0.9510565162951536],[9,-0.5877852522924734],[10,-2.4492935982947064e-16],[11,0.5877852522924729],[12,0.9510565162951535],[13,0.9510565162951536],[14,0.5877852522924734],[15,3.6739403974420594e-16],[16,-0.5877852522924728],[17,-0.9510565162951534],[18,-0.9510565162951538],[19,-0.5877852522924735]]
},
{
color: 'green',
unit: '%',
values: [[0,1],[1,0.8090169943749475],[2,0.30901699437494745],[3,-0.30901699437494734],[4,-0.8090169943749473],[5,-1],[6,-0.8090169943749475],[7,-0.30901699437494756],[8,0.30901699437494723],[9,0.8090169943749473],[10,1],[11,0.8090169943749476],[12,0.30901699437494773],[13,-0.3090169943749471],[14,-0.8090169943749472],[15,-1],[16,-0.8090169943749477],[17,-0.30901699437494784],[18,0.309016994374947],[19,0.8090169943749471]]
}
];
```
Inside render:
```javascript
```
## Why this module?
Wanted to display a simple scatter chart in my React Native app and existing modules depended on multiple modules and always needed native components.
## How does it work?
This component draws the chart using only `` and `` react native components.
## Accepted props
```javascript
const propTypes = {
data: PropTypes.arrayOf(
PropTypes.shape({
color: PropTypes.string,
unit: PropTypes.string,
values: PropTypes.arrayOf(
PropTypes.arrayOf(
PropTypes.number
)
)
})
), // takes array of series of data (array of arrays of {x, y})
chartWidth: PropTypes.number, // by default uses entire width of the device
chartHeight: PropTypes.number, // by default 200 scaled px
backgroundColor: PropTypes.string, // 'white' by default
colors: PropTypes.arrayOf(PropTypes.string), // specify the colors for each series of data
minY: PropTypes.number,
maxY: PropTypes.number,
minX: PropTypes.number,
maxX: PropTypes.number,
unitX: PropTypes.string,
unitY: PropTypes.string,
horizontalLinesAt: PropTypes.arrayOf(PropTypes.number),
verticalLinesAt: PropTypes.arrayOf(PropTypes.number),
}
const defaultProps = {
chartHeight: 200,
chartWidth: Dimensions.get('window').width,
backgroundColor: 'white',
unitX: '',
unitY: ''
}
```
## Installation
```
npm i --save react-native-scatter-chart
```
(or)
```
yarn add react-native-scatter-chart
```
## Usage
Data format:
```javascript
const chartData = [
{
color: 'red',
unit: '%',
values: [[0,0],[1,0.5877852522924731],[2,0.9510565162951535],[3,0.9510565162951536],[4,0.5877852522924732],[5,1.2246467991473532e-16],[6,-0.587785252292473],[7,-0.9510565162951535],[8,-0.9510565162951536],[9,-0.5877852522924734],[10,-2.4492935982947064e-16],[11,0.5877852522924729],[12,0.9510565162951535],[13,0.9510565162951536],[14,0.5877852522924734],[15,3.6739403974420594e-16],[16,-0.5877852522924728],[17,-0.9510565162951534],[18,-0.9510565162951538],[19,-0.5877852522924735]]
},
{
color: 'green',
unit: '%',
values: [[0,1],[1,0.8090169943749475],[2,0.30901699437494745],[3,-0.30901699437494734],[4,-0.8090169943749473],[5,-1],[6,-0.8090169943749475],[7,-0.30901699437494756],[8,0.30901699437494723],[9,0.8090169943749473],[10,1],[11,0.8090169943749476],[12,0.30901699437494773],[13,-0.3090169943749471],[14,-0.8090169943749472],[15,-1],[16,-0.8090169943749477],[17,-0.30901699437494784],[18,0.309016994374947],[19,0.8090169943749471]]
}
];
```
Inside render:
```javascript
```
## Why this module?
Wanted to display a simple scatter chart in my React Native app and existing modules depended on multiple modules and always needed native components.
## How does it work?
This component draws the chart using only `` and `` react native components.
## Accepted props
```javascript
const propTypes = {
data: PropTypes.arrayOf(
PropTypes.shape({
color: PropTypes.string,
unit: PropTypes.string,
values: PropTypes.arrayOf(
PropTypes.arrayOf(
PropTypes.number
)
)
})
), // takes array of series of data (array of arrays of {x, y})
chartWidth: PropTypes.number, // by default uses entire width of the device
chartHeight: PropTypes.number, // by default 200 scaled px
backgroundColor: PropTypes.string, // 'white' by default
colors: PropTypes.arrayOf(PropTypes.string), // specify the colors for each series of data
minY: PropTypes.number,
maxY: PropTypes.number,
minX: PropTypes.number,
maxX: PropTypes.number,
unitX: PropTypes.string,
unitY: PropTypes.string,
horizontalLinesAt: PropTypes.arrayOf(PropTypes.number),
verticalLinesAt: PropTypes.arrayOf(PropTypes.number),
}
const defaultProps = {
chartHeight: 200,
chartWidth: Dimensions.get('window').width,
backgroundColor: 'white',
unitX: '',
unitY: ''
}
```