# react-native-animated-chart
A React Native bar chart component animated fully on UI thread and with non external dependecies
## Installation
Run `npm install react-native-animated-charts` in your project directory.
## Usage
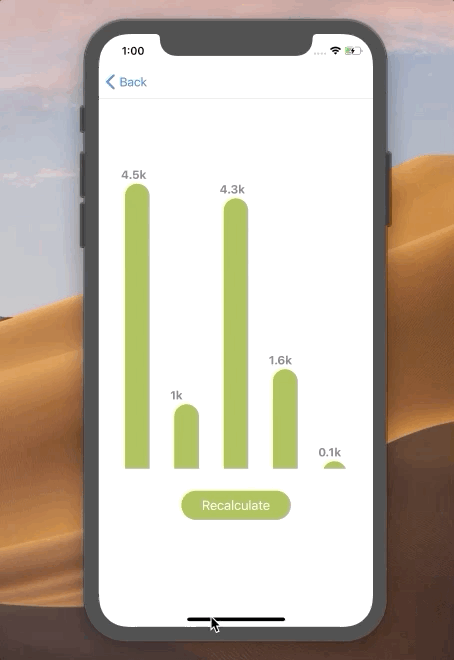
This snippet would produce the output shown in the above gif
```
import React, { Component } from 'react';
import {View, Dimensions, StyleSheet} from 'react-native';
import {BarChart} from 'react-native-animated-charts'
let WIDTH = Dimensions.get('window').width;
let HEIGHT = Dimensions.get('window').height;
export default class Test extends Component {
constructor() {
super()
this.state = {
dataY:[10,2,1.2,4.5,3],
labels:['10k','2k','1.2k','4.5k','3k']
}
}
recalculate = ()=>{
let values = Array.from({length: 5}, () => Math.round(10*Math.random() * 5)/10)
this.setState({
dataY:values,
labels: values.map(v=>(Math.round(v*10)/10)+'k')
})
}
render() {
return (
Recalculate
);
}
}
const styles = StyleSheet.create({
container: {
alignItems:"center"
},
button: {
backgroundColor:"#a7bd4f",
marginTop:30,
width:WIDTH*.4,
height:40,
borderRadius:30,
alignItems:"center",
justifyContent:"center"
},
buttonText: {
color:"white",
fontSize:18
},
barChart: {
backgroundColor:"transparent",
height:HEIGHT*.6,
width:WIDTH,
marginTop:20
},
});
```
## Props
The barChart renders data passed by props:
* `dataY`: An array containing numeric values to render bars on y-axis.
* `labels`: An array of string labels to be shown above the bars .
Other styling props:
* `color`: A color for the bars.
* `height`: A fixed height for the chart.
* `containerStyles`: Styles for the barchart container View component.
## Pending Tasks
- [ ] Make property for filling x-axis labels.
- [ ] Make the barchart compatible with flex heights, currently it only supports receiving a fixed height
## Contributing
This is project is still in beta at the moment, but is still very basic, so if you want to work on the above mention tasks, or you find a bug just open a PR or an issue and ping me!