# QdtPicasso
Create a chart in [Picasso.js](https://picassojs.com/) using the Engine API ([Nov 2019 docs](https://help.qlik.com/en-US/sense-developer/November2019/APIs/EngineAPI/index.html)) in:
- [Vanilla JavaScript](#vanilla-javascript)
- [React](#react-jsx)
- [Angular](#angular)
### Properties
| prop | type | description |
| :---: | :---: | :--- |
| type | String | `comboLineBarchart`, `horizontalBarchart`, `lineChart`, `multiLineChart`, `pie`, `piechart`, `pointDistribution`, `pyramid`, `rangeArea`, `scatterplot`, `stackedBarchart`, `verticalBarchart`, `verticalGauge`, `verticalGroupBarchart`, `verticalRangeGauge` |
| cols | Array | `[dimension, measure]` |
| options | Object | `color` |
| prio | String | `canvas` or `svg`. If omitted, it defaults to canvas |
## Examples
|[Horizontal Barchart](./HorizontalBarChart)|[Vertical Barchart](./VerticalBarChart)|[Pie Chart](./PieChart)|[Scatterplot](./ScatterplotChart)|[Line Chart](./LineChart)|
|:---:|:---:|:---:|:---:|:---:|
|[](https://qdt-apps.qlik.com/qdt-components/react/#/picasso-horizontal-barchart)|[](https://qdt-apps.qlik.com/qdt-components/react/#/picasso-vertical-barchart)|[](https://qdt-apps.qlik.com/qdt-components/react/#/picasso-pie-chart)|[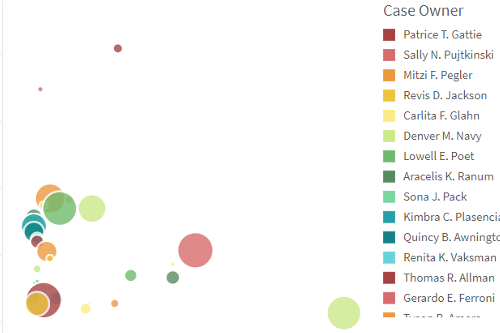](https://qdt-apps.qlik.com/qdt-components/react/#/picasso-scatterplot)|[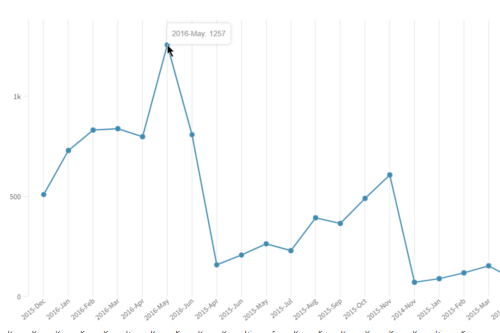](https://qdt-apps.qlik.com/qdt-components/react/#/picasso-line-chart)|
|[Multi-Line Chart](./MultiLineChart)|[Stacked Bar Chart](./StackedBarChart)|[Gauge](./Gauge)|[Range Area](./RangeArea)|[Vertical Group Bar Chart](./VerticalGroupBarChart)|
|:---:|:---:|:---:|:---:|:---:|
|[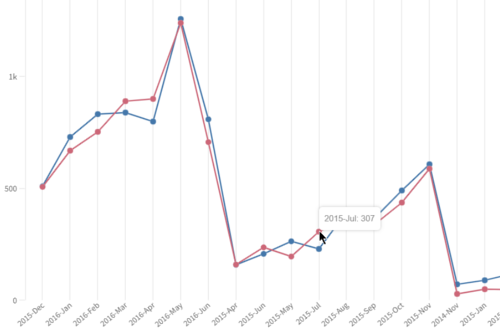](https://qdt-apps.qlik.com/qdt-components/react/#/picasso-multi-line-chart)|[](https://qdt-apps.qlik.com/qdt-components/react/#/stacked-barchart)|[](https://qdt-apps.qlik.com/qdt-components/react/#/gauge)|[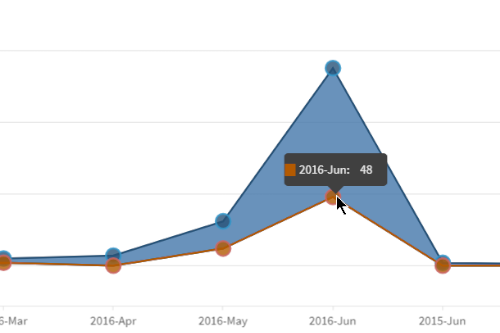](https://qdt-apps.qlik.com/qdt-components/react/#/picasso-range-area-chart)|[](https://qdt-apps.qlik.com/qdt-components/react/#/picasso-vertical-group-barchart)|
|[Gantt Chart](./Gantt)|[Marimekko Chart](./Mekko)|[Custom Chart](./CustomChart)|[Point Distribution](./PointDistribution)|[Pyramid](./Pyramid)|
|:----:|:----:|:----:|:----:|:----:|
|[](https://qdt-apps.qlik.com/qdt-components/react/#/picasso-gantt)|[](https://qdt-apps.qlik.com/qdt-components/react/#/picasso-mekko)|[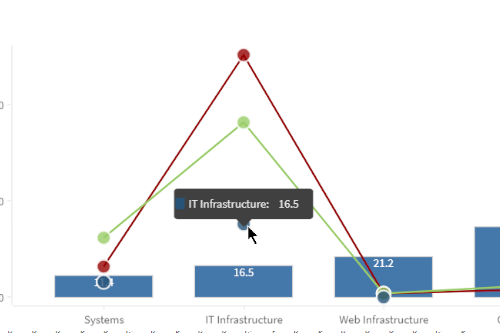](https://qdt-apps.qlik.com/qdt-components/react/#/picasso-custom-combo-chart)|[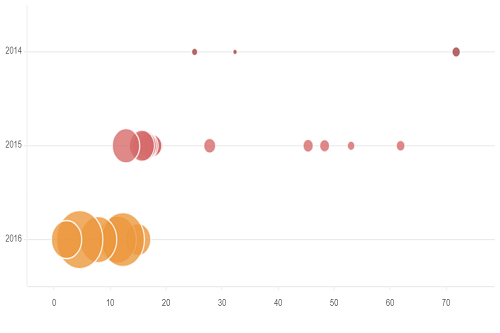](https://qdt-apps.qlik.com/qdt-components/react/#/picasso-point-distribution)|[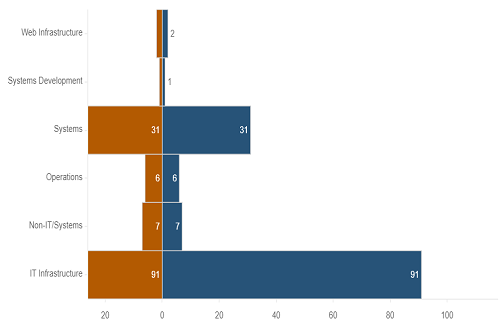](https://qdt-apps.qlik.com/qdt-components/react/#/picasso-pyramid)|
[[↑] Back to top](#top)
## Code
### Vanilla JavaScript
- See the [HTML Template](https://github.com/qlik-demo-team/qdt-components/blob/master/docs/usage/Html.md) for the
basic page setup. The two main items are:
- qdt-components.js `