
Playwright Timeline Reporter
[](https://github.com/vitalets/playwright-timeline-reporter/actions/workflows/lint.yml)
[](https://github.com/vitalets/playwright-timeline-reporter/actions/workflows/test.yml)
[](https://www.npmjs.com/package/playwright-timeline-reporter)
[](https://www.npmjs.com/package/playwright-timeline-reporter)
**Playwright Timeline Reporter** renders your [Playwright](https://playwright.dev/) tests as an interactive timeline. You can use it to optimize your test run performance:
- identify slow tests
- detect costly or repeated hooks and fixtures
- evaluate worker utilization
- get ready-to-use prompt for AI analysis
Plug it into any Playwright project and get a self-contained HTML report.
## Live Demo
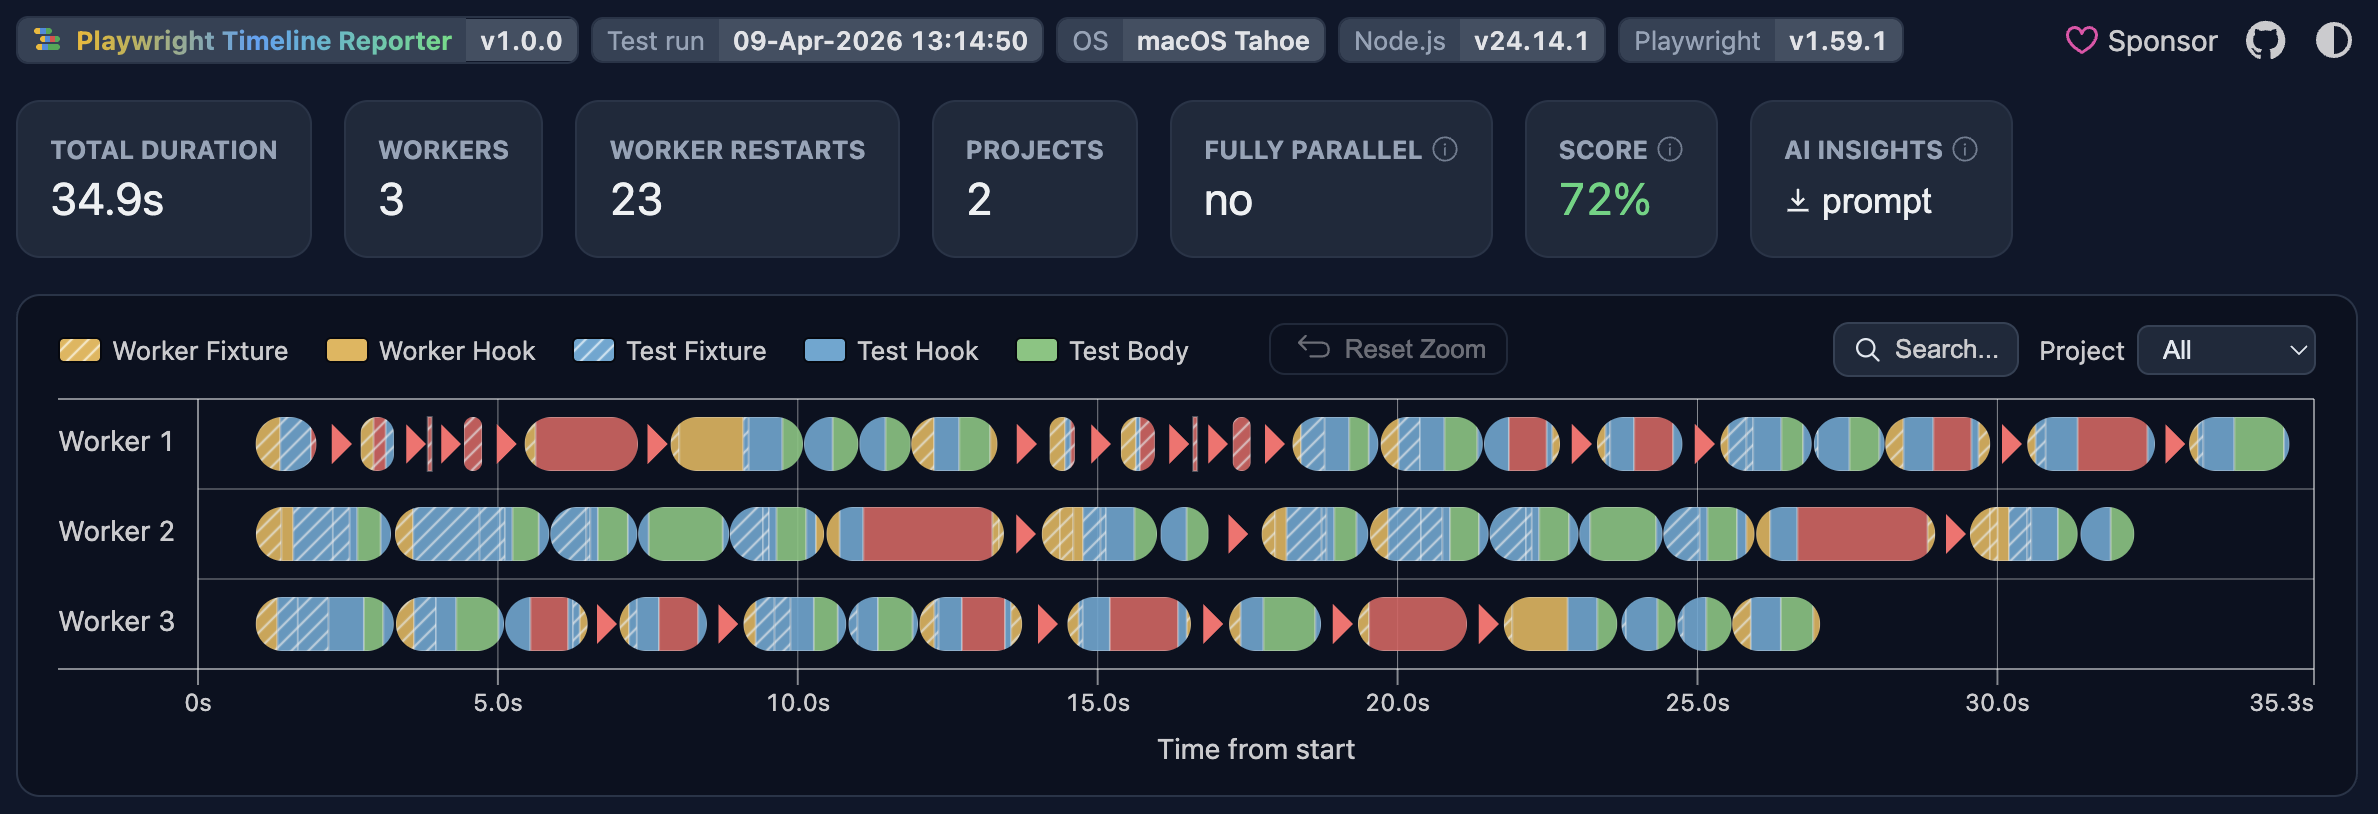
Click the screenshot to open the live report ↗
> Also check out the **sharded** report [demo](https://vitalets.github.io/playwright-timeline-reporter/demos/shards.html).
## Installation
Install with any package manager:
### npm
```sh
npm install --save-dev playwright-timeline-reporter
```
### pnpm
```sh
pnpm add --save-dev playwright-timeline-reporter
```
### Yarn
```sh
yarn add --dev playwright-timeline-reporter
```
## Configuration
Add the reporter to your `playwright.config.ts`:
```ts
import { defineConfig } from '@playwright/test';
export default defineConfig({
reporter: [
['playwright-timeline-reporter']
],
});
```
Additionally, you can provide [options](#options):
```ts
import { defineConfig } from '@playwright/test';
export default defineConfig({
reporter: [
['playwright-timeline-reporter', { /* reporter options */ }],
],
});
```
## Usage
Run your tests and open `./timeline-report/index.html` in any browser.
In the report you can do the following:
- **Review the timeline** to spot the slowest spans.
- **Hover any span** to inspect its type, details, and source location.
- **Click spans** to isolate a specific test, hook, or fixture.
- **Inspect restart markers** to understand worker restart reasons.
- **Switch projects** to isolate project-specific bottlenecks.
- **Focus on a worker or shard** by clicking its label.
- **Select a region** to zoom in for deeper investigation.
- **Search** for files, tests, tags, or error messages.
- **Copy the AI prompt** and paste it into any AI chat for analysis.
> [!NOTE]
> **Your input is appreciated:** you can help improve the reporter by upvoting these Playwright issues: [#38350](https://github.com/microsoft/playwright/issues/38350), [#38962](https://github.com/microsoft/playwright/issues/38962), [#40175](https://github.com/microsoft/playwright/issues/40175).
## Sharding
For sharded runs, configure each shard to produce a blob report, then merge them into a single timeline.
**1. Run each shard with the blob reporter:**
```ts
import { defineConfig } from '@playwright/test';
export default defineConfig({
reporter: [
['blob']
],
});
```
```sh
npx playwright test --shard=1/3
npx playwright test --shard=2/3
npx playwright test --shard=3/3
```
**2. Merge the blob reports:**
```sh
npx playwright merge-reports --reporter=playwright-timeline-reporter ./blob-report
```
Open `./timeline-report/index.html` to see the unified timeline across all shards.
> For more details on sharding see the [Playwright sharding docs](https://playwright.dev/docs/test-sharding).
## Options
#### `outputFile`
- **Type:** `string`
- **Default:** `./timeline-report/index.html`
- **Env var:** `PLAYWRIGHT_TIMELINE_OUTPUT_FILE`
Path for the generated report file, relative to config dir.
#### `promptTemplateFile`
- **Type:** `string`
- **Default:** —
Path to a custom LLM prompt template, must contain `{data}` exactly once. See the [default prompt](https://github.com/vitalets/playwright-timeline-reporter/blob/main/src/report/cards/prompt/default-prompt.ts).
#### `debug`
- **Type:** `boolean`
- **Default:** `false`
- **Env var:** `PLAYWRIGHT_TIMELINE_DEBUG`
Enables debug logging in the reporter and extra debug details in the generated HTML report.
Example with options:
```ts
import { defineConfig } from '@playwright/test';
export default defineConfig({
reporter: [
[
'playwright-timeline-reporter',
{
outputFile: './reports/timeline.html',
debug: true,
},
],
],
});
```
## Learning Playwright
You can also use this reporter to better understand and visualize different Playwright concepts. Feel free to add timelines to your posts and presentations. Deploy it to GitHub Pages and share a link with your readers so they can explore the chart themselves.
Example articles:
- [Playwright in Pictures: Fully Parallel Mode](https://dev.to/vitalets/playwright-in-pictures-fully-parallel-mode-3ecj)
- [Playwright in Pictures: Why Workers Restart?](https://dev.to/vitalets/playwright-in-pictures-why-workers-restart-34bp)
## Integration with Playwright HTML Reporter
You can integrate a link to the timeline inside Playwright's built-in HTML report:
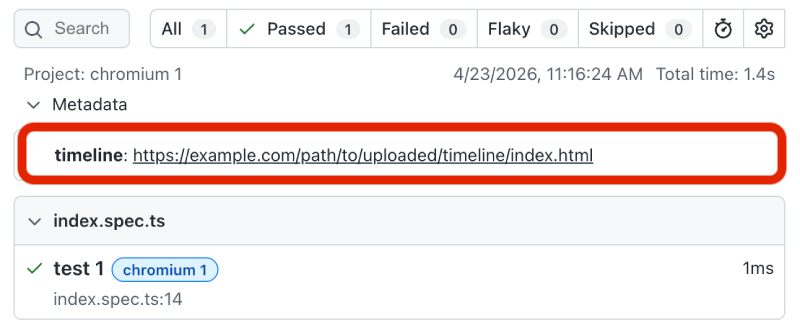 Add a timeline report link to the `metadata` object in the Playwright config:
```ts
export default defineConfig({
metadata: {
timeline: 'https://path/to/uploaded/timeline/index.html',
}
});
```
Then open the HTML report with a **special hash** `#show-metadata-other`:
```
http://localhost:9323/#show-metadata-other
```
> Customization of Playwright HTML report is a bit awkward, see [#35614](https://github.com/microsoft/playwright/issues/35614).
## Data Privacy
The reporter embeds all collected data directly into the generated HTML file. It does not send it to any third-party services. Your data remains local unless you choose to share the HTML file yourself.
## Limitations
Playwright's API does not provide a reliable way to reconstruct worker lanes exactly as they were executed ([#40175](https://github.com/microsoft/playwright/issues/40175)). This reporter does its best to approximate the original worker distribution, but in some cases the lane assignment may be not 100% accurate.
If you notice a bug or have any feedback, feel free to [open an issue](https://github.com/vitalets/playwright-timeline-reporter/issues).
## Packages to speedup tests
- [@global-cache/playwright](https://github.com/vitalets/global-cache) - Cache and reuse data between Playwright workers.
- [request-mocking-protocol](https://github.com/vitalets/request-mocking-protocol) - Mock server-side API calls in tests.
## License
This project is licensed under the [MIT License](https://github.com/vitalets/playwright-timeline-reporter/blob/main/LICENSE).
The generated report includes attribution links to this repository and the sponsor page. You are welcome to use and modify the tool freely — please keep those links intact in the report output.
Add a timeline report link to the `metadata` object in the Playwright config:
```ts
export default defineConfig({
metadata: {
timeline: 'https://path/to/uploaded/timeline/index.html',
}
});
```
Then open the HTML report with a **special hash** `#show-metadata-other`:
```
http://localhost:9323/#show-metadata-other
```
> Customization of Playwright HTML report is a bit awkward, see [#35614](https://github.com/microsoft/playwright/issues/35614).
## Data Privacy
The reporter embeds all collected data directly into the generated HTML file. It does not send it to any third-party services. Your data remains local unless you choose to share the HTML file yourself.
## Limitations
Playwright's API does not provide a reliable way to reconstruct worker lanes exactly as they were executed ([#40175](https://github.com/microsoft/playwright/issues/40175)). This reporter does its best to approximate the original worker distribution, but in some cases the lane assignment may be not 100% accurate.
If you notice a bug or have any feedback, feel free to [open an issue](https://github.com/vitalets/playwright-timeline-reporter/issues).
## Packages to speedup tests
- [@global-cache/playwright](https://github.com/vitalets/global-cache) - Cache and reuse data between Playwright workers.
- [request-mocking-protocol](https://github.com/vitalets/request-mocking-protocol) - Mock server-side API calls in tests.
## License
This project is licensed under the [MIT License](https://github.com/vitalets/playwright-timeline-reporter/blob/main/LICENSE).
The generated report includes attribution links to this repository and the sponsor page. You are welcome to use and modify the tool freely — please keep those links intact in the report output.