# MatAnim – Mathematical Animation Library
A lightweight JavaScript library for creating engaging mathematical animations and visualizations for educational purposes. Perfect for teachers, students, and anyone looking to make math concepts come alive through interactive visualizations.
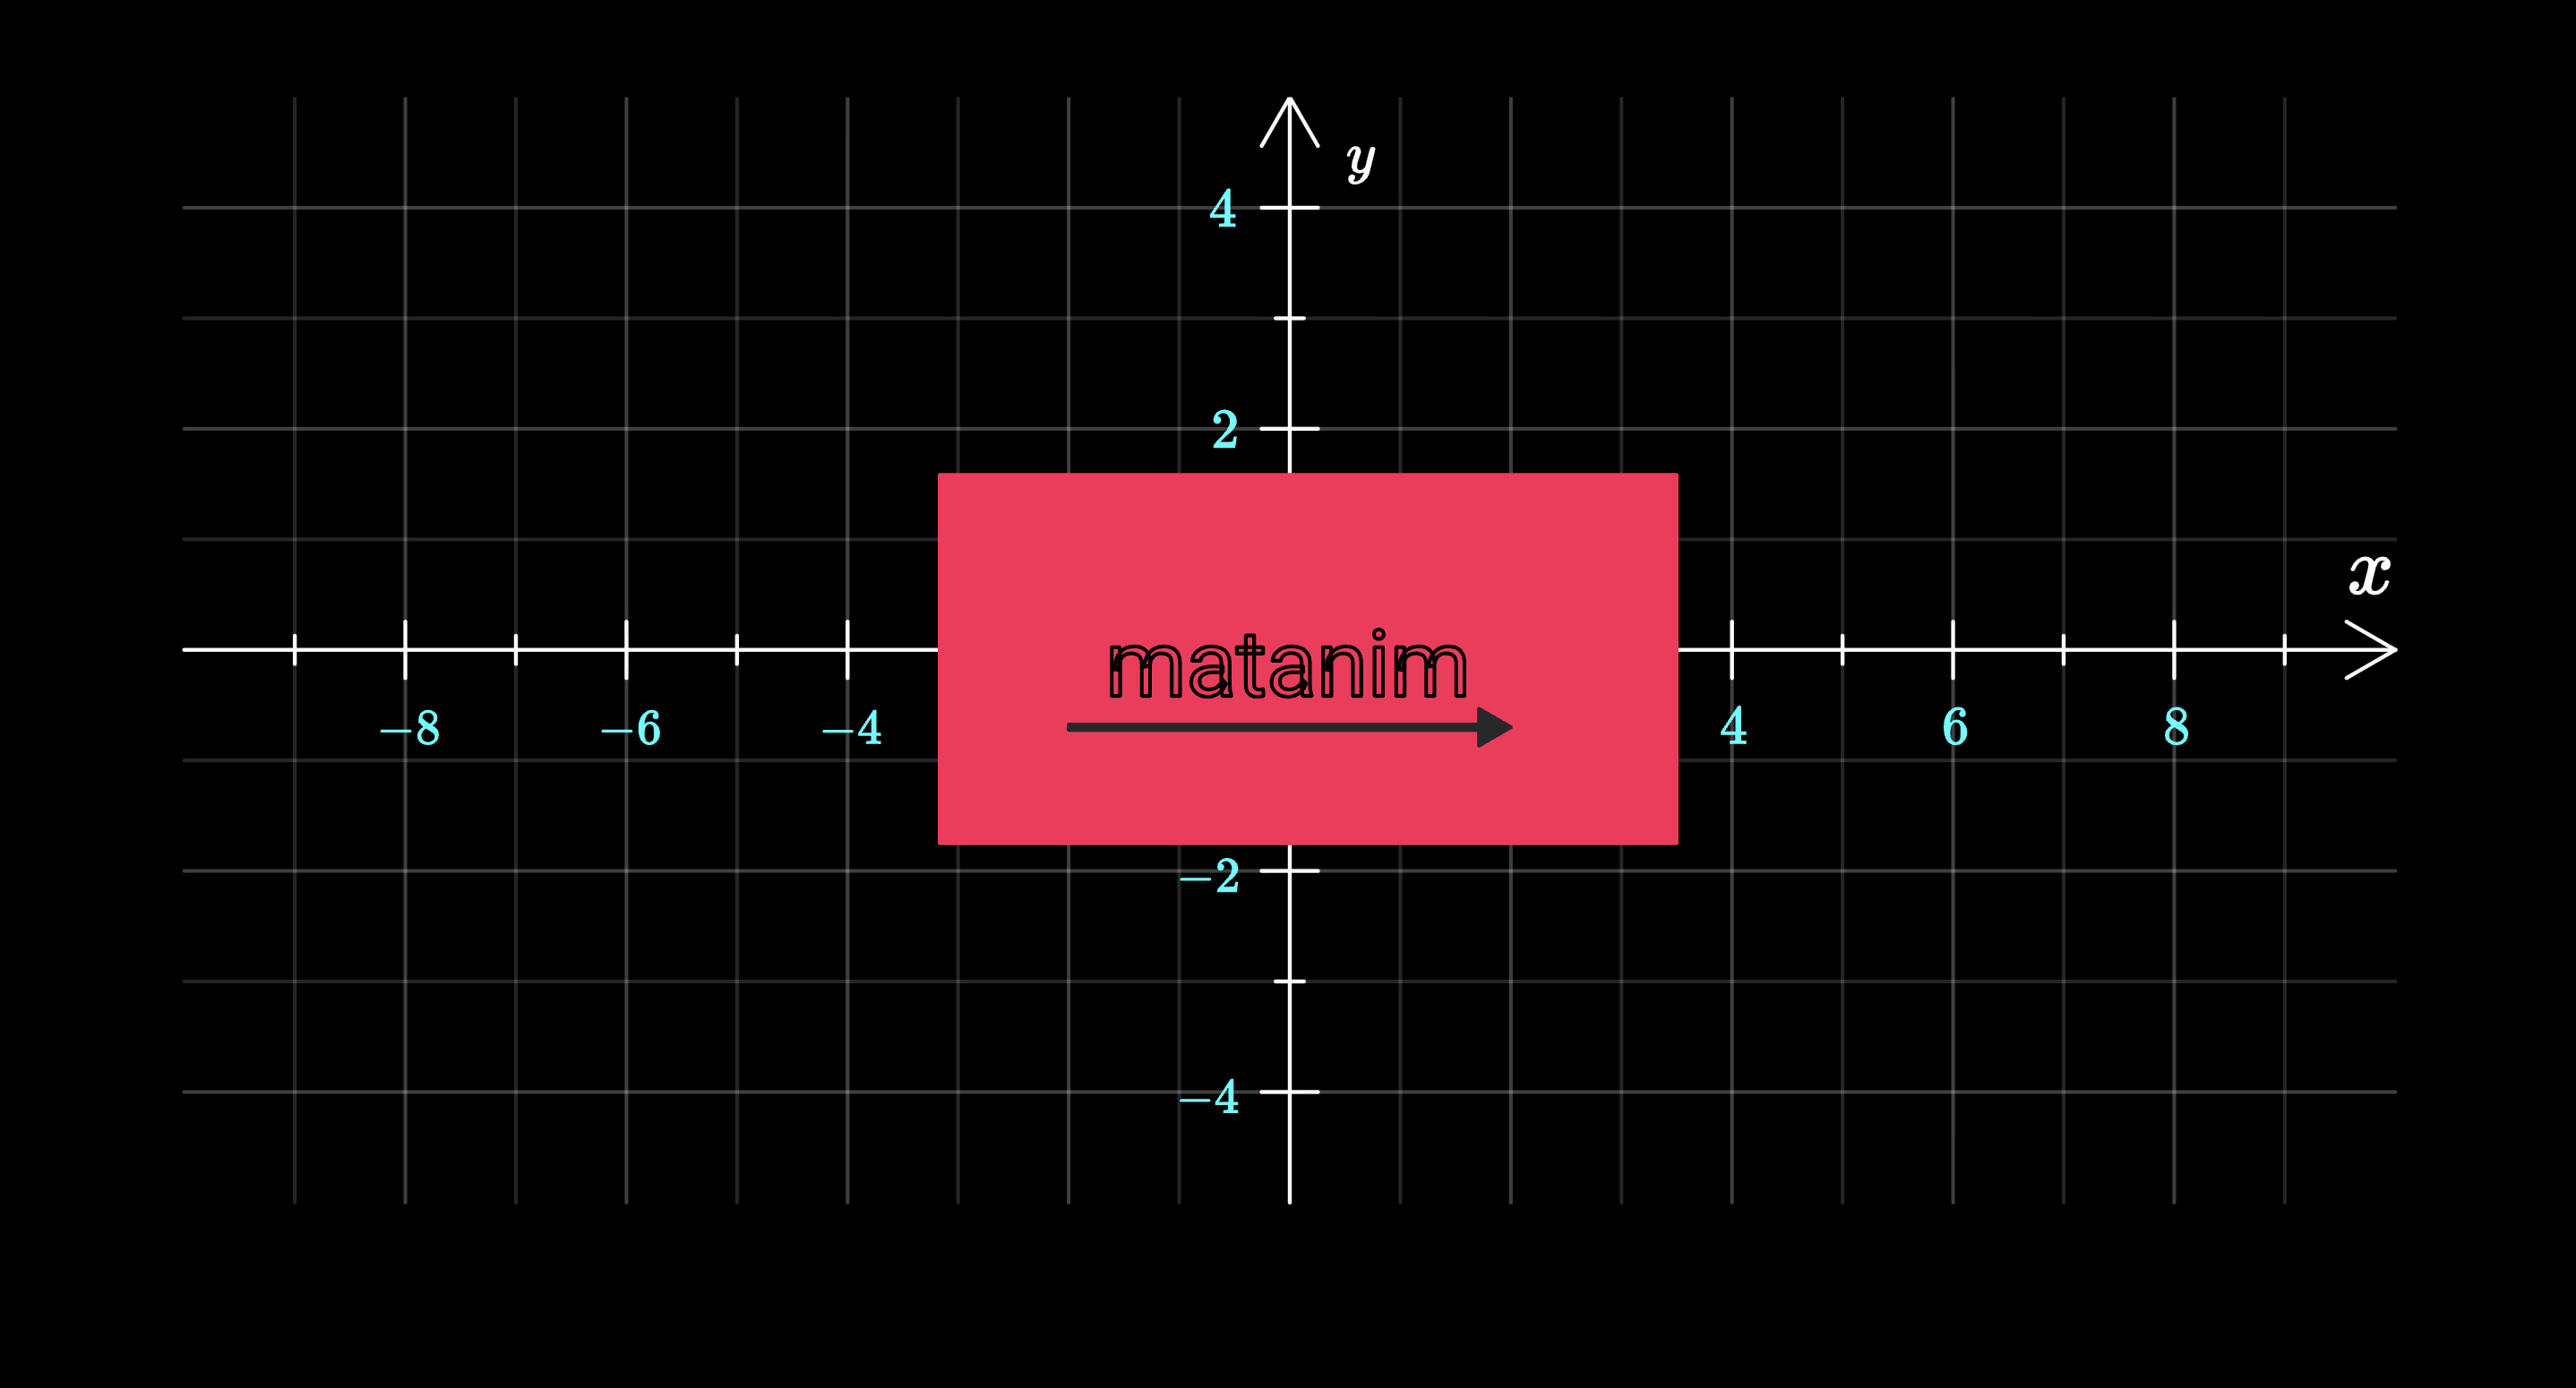
---
## ✨ Features
- **Canvas-based rendering** – Smooth 60fps animations
- **Mathematical objects** – Coordinate systems, function plots, vectors, and more
- **Character animation** – Animated Pi character with facial expressions
- **LaTeX support** – Render mathematical expressions directly
- **Easing functions** – Multiple easing functions for natural motion
- **Flexible animation system** – Combine multiple animations seamlessly
---
## 📦 Installation
### npm
```bash
npm install matanim
```
### Browser (ES Modules)
```html
```
---
## 🚀 Quick Start
```javascript
import {
Scene,
Circle,
AnimationManager,
OutlineThanFillAnimation,
CoordinateSystem,
FunctionPlot,
PiCharacter,
TranslateAnimation,
ScaleAnimation,
easeInOutSine,
} from "matanim";
// Setup scene
const canvas = document.querySelector("canvas");
const scene = new Scene(canvas);
// Create a coordinate system
const coordinateSystem = new CoordinateSystem(
[
{ x: 100, y: 300 },
{ x: 1300, y: 300 },
],
[-10, 10],
[-5, 5],
{
tickStep: 2,
hasLabels: true,
hasGrid: true,
xAxisLabel: "x",
yAxisLabel: "y",
}
);
// Plot a function
const sineWave = new FunctionPlot(coordinateSystem, (x) => Math.sin(x), {
lineWidth: 4,
color: "#4cc9f0",
dashed: true,
});
// Add a Pi character
const piCharacter = new PiCharacter([{ x: 100, y: 400 }]);
// Add objects to scene
scene.add(coordinateSystem);
scene.add(sineWave);
scene.add(piCharacter);
// Animate!
const animationManager = new AnimationManager(scene);
animationManager.add(
new OutlineThanFillAnimation(coordinateSystem, {
duration: 1500,
})
);
animationManager.add(
new TranslateAnimation(piCharacter, {
delta: { x: 200, y: 0 },
duration: 1000,
easingFunction: easeInOutSine,
})
);
```
---
## 📚 API Reference
### Core Classes
#### Scene
The main container for all graphical objects.
```javascript
const scene = new Scene(canvasElement);
scene.add(graphicalObject);
```
#### GraphicalObject
Base class for all graphical objects with transformation capabilities.
**Methods:**
- `translate(delta, notify = true)`
- `scale(xScale, yScale, pivot = getCenter(), notify = true)`
- `getCenter()`
- `getBoundingBox()`
---
## 📐 Graphical Objects
### Circle
```javascript
const circle = new Circle([{ x: 200, y: 200 }], 50, {
fillColor: "red",
borderColor: "white",
lineWidth: 2,
});
```
### Rectangle
```javascript
const rect = new Rectangle([{ x: 100, y: 100 }], 200, 100, {
fillColor: "blue",
borderColor: "yellow",
});
```
### Line
```javascript
const line = new Line(
[
{ x: 100, y: 100 },
{ x: 300, y: 300 },
],
{
lineWidth: 3,
color: "green",
}
);
```
### Text & MathText
```javascript
const text = new Text([{ x: 100, y: 100 }], "Hello World", {
fontSize: 24,
color: "white",
});
const mathText = new MathText([{ x: 100, y: 150 }], "f(x) = \\sin(x)", {
fontSize: 32,
fillColor: "#4cc9f0",
});
```
### CoordinateSystem
```javascript
const coordinateSystem = new CoordinateSystem(
[
{ x: 100, y: 300 },
{ x: 1300, y: 300 },
],
[-10, 10],
[-5, 5],
{
tickStep: 2,
hasLabels: true,
hasGrid: true,
xAxisLabel: "x",
yAxisLabel: "y",
}
);
```
### FunctionPlot
```javascript
const parabola = new FunctionPlot(coordinateSystem, (x) => x * x, {
lineWidth: 3,
color: "red",
dashed: false,
});
```
### Vector
```javascript
const vector = new Vector(
[coordinateSystem.pointToCoords(0, 0), coordinateSystem.pointToCoords(3, 2)],
{
color: "orange",
lineWidth: 3,
}
);
```
### PiCharacter
```javascript
const piCharacter = new PiCharacter([{ x: 100, y: 100 }]);
piCharacter.scale(0.5, 0.5);
piCharacter.leftEye;
piCharacter.rightEye;
```
### BubbleWithText
```javascript
const bubble = new BubbleWithText(
[{ x: 200, y: 200 }],
"Hello!\nThis is a speech bubble.",
{
fontSize: 16,
}
);
```
### BezierCurve
```javascript
const curve = new BezierCurve(
[
{ x: 100, y: 200 },
{ x: 200, y: 100 },
{ x: 300, y: 300 },
{ x: 400, y: 200 },
],
{
color: "white",
fill: false,
}
);
```
### Eye
Composite object used internally by `PiCharacter`, but also available for standalone usage.
```javascript
const eye = new Eye([{ x: 100, y: 100 }], {
eyeDirectionDeg: 45,
irisRadius: 10,
pupileRadius: 2,
});
```
### NumberLine
Highly configurable number line with ticks, labels, arrows and rotation.
```javascript
const numberLine = new NumberLine(
[
{ x: 100, y: 300 },
{ x: 600, y: 300 },
],
[-5, 5],
{
tickStep: 1,
hasGrid: false,
label: "x",
}
);
```
### MultiLineText
Supports mixed regular text and inline LaTeX expressions.
```javascript
const text = new MultiLineText(
[{ x: 100, y: 100 }],
"This is text with with\n multiple lines.",
{ fontSize: 24 }
);
```
---
## 🎞 Animation System
### AnimationManager
```javascript
const animationManager = new AnimationManager(scene);
animationManager.add(animation);
```
### Animation Types
#### OutlineThanFillAnimation
```javascript
new OutlineThanFillAnimation(object, {
duration: 1000,
toTop: false,
strokeColor: "blue",
});
```
#### TranslateAnimation
```javascript
new TranslateAnimation(object, {
delta: { x: 200, y: 100 },
duration: 1000,
easingFunction: easeInOutSine,
});
```
#### ScaleAnimation
```javascript
new ScaleAnimation(object, {
xScale: 2,
yScale: 2,
center: object.getCenter(),
duration: 1000,
easingFunction: easeInOutElastic,
});
```
#### Fade Animations
```javascript
new FadeInAnimation(object, { duration: 1000 });
new FadeOutAnimation(object, { duration: 1000 });
```
---
## 🎭 Character Animations
```javascript
new SquintingEyeAnimation(eyeObject);
new UnSquintingEyeAnimation(eyeObject);
new WavingRightArmAnimation(piCharacter, {
easingFunction: easeInOutBack,
animationManager: animationManager,
});
```
---
## 📈 Easing Functions
MatAnim provides a rich set of easing functions:
- `easeInSine`
- `easeInOutSine`
- `easeInOutCirc`
- `easeInQuad`
- `easeInCubic`
- `easeInExpo`
- `easeInElastic`
- `easeOutElastic`
- `easeInOutElastic`
- `easeInBounce`
- `easeOutBounce`
- `easeInOutBounce`
```javascript
new TranslateAnimation(object, {
delta: { x: 100, y: 0 },
duration: 1000,
easingFunction: easeInOutElastic,
});
```
---
## 🧪 Examples
### Animated Graph
```javascript
const coordinateSystem = new CoordinateSystem(
[
{ x: 100, y: 350 },
{ x: 1300, y: 350 },
],
[-Math.PI, Math.PI],
[-2, 2],
{ hasGrid: true, hasLabels: true }
);
const sine = new FunctionPlot(coordinateSystem, (x) => Math.sin(x), {
color: "#4cc9f0",
lineWidth: 3,
});
const cosine = new FunctionPlot(coordinateSystem, (x) => Math.cos(x), {
color: "#f72585",
lineWidth: 3,
dashed: true,
});
const piCharacter = new PiCharacter([{ x: 100, y: 400 }]);
setTimeout(() => {
animationManager.add(
new OutlineThanFillAnimation(coordinateSystem, { duration: 1500 })
);
}, 500);
setTimeout(() => {
animationManager.add(new OutlineThanFillAnimation(sine, { duration: 2000 }));
animationManager.add(
new OutlineThanFillAnimation(cosine, { duration: 2000 })
);
}, 2500);
```
---
## 🌍 Browser Support
- Modern browsers with ES6 module support
- Canvas API required
- ❌ Internet Explorer not supported
---
## ❤️ Acknowledgments
- Designed for mathematics education
- Inspired by manim
> **Note:** MatAnim is designed for short, focused educational animations that clearly illustrate mathematical concepts.