
# Markvis
> 在 markdown 中生成可视化。
[](https://npmjs.com/package/markvis) [](https://npmjs.com/package/markvis) [](https://travis-ci.org/geekplux/markvis) [](https://coveralls.io/github/geekplux/markvis) [](https://geekplux.github.io/donate)
[](https://app.fossa.io/projects/git%2Bhttps%3A%2F%2Fgithub.com%2Fgeekplux%2Fmarkvis?ref=badge_shield)
 - [文档](https://markvis.js.org)
- [在线试用](https://markvis-editor.js.org)
## 预览

# 快速开始
## 安装
```bash
yarn add markvis --save
npm install markvis --save
```
## 使用
```js
const md = require('markdown-it')()
const vis = require('markvis')
const d3 = require('d3') // 浏览器环境
const d3node = require('d3-node') // node 环境
md.use(vis).render(`
your markdown content
`, {
d3, // 浏览器环境
d3node // node 环境
})
```
这里有几个 [例子](https://github.com/geekplux/markvis/tree/master/examples) 是在node 环境下的.
# 动机
有时候写文章需要插入一些数据来增强说服力,但是单纯的数字又不直观,所以可视化图表是必须的。紧接着就会出现一个问题:如何把图表添加到文章中。通常的做法是用一些现成的工具生成图片,然后把图片贴到文章中。这样一来就非常繁琐,尤其是用markdown写作时你还得把图片先上传到一个图床中。另一方面,访客阅读文章时,图片的加载比网页元素肯定更耗时。一旦加载过慢就会给阅读造成非常不好的体验。
# API
!> markvis 有许多配置项。但涉及到图表样式的配置,我推荐你最好直接设置图表的配置项,比如: [markvis-bar](https://github.com/geekplux/markvis-bar), [markvis-line](https://github.com/geekplux/markvis-line), [markvis-pie](https://github.com/geekplux/markvis-pie).
## options
### data
- Type: `Array`
要加载的数据。
### d3
- Type: `Object`
[d3](https://github.com/d3/d3) 库,用在 **浏览器** 环境中。
### d3node
- Type: `Function`
[d3-node](https://github.com/d3-node/d3-node) 的构造函数,用在 **node** 环境中。
### layout
- Type: `String`
你想要自定义的图表布局的名称。
### render
- Type: `Function`
为你的自定义图表添加渲染器。
### container
- Type: `String`
- Default: ``
加载你图表的容器元素。
### selector
- Type: `String`
- Default: `'#chart'`
选择器。
### style
- Type: `String`
- [文档](https://markvis.js.org)
- [在线试用](https://markvis-editor.js.org)
## 预览

# 快速开始
## 安装
```bash
yarn add markvis --save
npm install markvis --save
```
## 使用
```js
const md = require('markdown-it')()
const vis = require('markvis')
const d3 = require('d3') // 浏览器环境
const d3node = require('d3-node') // node 环境
md.use(vis).render(`
your markdown content
`, {
d3, // 浏览器环境
d3node // node 环境
})
```
这里有几个 [例子](https://github.com/geekplux/markvis/tree/master/examples) 是在node 环境下的.
# 动机
有时候写文章需要插入一些数据来增强说服力,但是单纯的数字又不直观,所以可视化图表是必须的。紧接着就会出现一个问题:如何把图表添加到文章中。通常的做法是用一些现成的工具生成图片,然后把图片贴到文章中。这样一来就非常繁琐,尤其是用markdown写作时你还得把图片先上传到一个图床中。另一方面,访客阅读文章时,图片的加载比网页元素肯定更耗时。一旦加载过慢就会给阅读造成非常不好的体验。
# API
!> markvis 有许多配置项。但涉及到图表样式的配置,我推荐你最好直接设置图表的配置项,比如: [markvis-bar](https://github.com/geekplux/markvis-bar), [markvis-line](https://github.com/geekplux/markvis-line), [markvis-pie](https://github.com/geekplux/markvis-pie).
## options
### data
- Type: `Array`
要加载的数据。
### d3
- Type: `Object`
[d3](https://github.com/d3/d3) 库,用在 **浏览器** 环境中。
### d3node
- Type: `Function`
[d3-node](https://github.com/d3-node/d3-node) 的构造函数,用在 **node** 环境中。
### layout
- Type: `String`
你想要自定义的图表布局的名称。
### render
- Type: `Function`
为你的自定义图表添加渲染器。
### container
- Type: `String`
- Default: ``
加载你图表的容器元素。
### selector
- Type: `String`
- Default: `'#chart'`
选择器。
### style
- Type: `String`
- Default: `''`
图表样式。
### width
- Type: `Number`
- Default: `960`
SVG 元素的宽度。
### height
- Type: `Number`
- Default: `500`
SVG 元素的高度。
### margin
- Type: `Object`
- Default: `{ top: 20, right: 20, bottom: 20, left: 20 }`
SVG 中第一个 标签的外边距,通常用于添加坐标轴。
# Contributing
1. Fork it!
2. Create your feature branch: `git checkout -b my-new-feature`
3. Commit your changes: `git commit -am 'Add some feature'`
4. Push to the branch: `git push origin my-new-feature`
5. Submit a pull request :D
# LICENSE
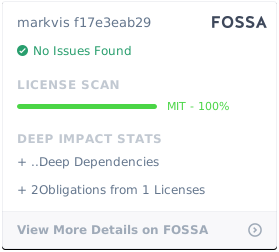
**markvis** © [geekplux](https://github.com/geekplux), Released under the [MIT](./LICENSE) License.
Authored and maintained by geekplux with help from contributors ([list](https://github.com/geekplux/markvis/contributors)).
> [geekplux.com](http://geekplux.com) · GitHub [@geekplux](https://github.com/geekplux) · Twitter [@geekplux](https://twitter.com/geekplux)
[](https://app.fossa.io/projects/git%2Bhttps%3A%2F%2Fgithub.com%2Fgeekplux%2Fmarkvis?ref=badge_large)