# mapbox-map-tool
> 地图核心组件库
[TOC]
## 安装方法
``` bash
# 安装插件
npm install mapbox-map-tool --save
```
## 地图Vue组件
### 地图容器
> Mapbox地图容器,支持封装展示自动读取token或签名,底部自带区划和经纬度工具条
#### 使用方法
``` javascript
# 引入插件
import {MapContainer} from "mapbox-map-tool";
import "mapbox-map-tool/dist/css/mapbox-gl.css"
import "mapbox-map-tool/dist/css/mapbox-map-tool.css"//建议在main.js中全局引入
# components中引入
components:{
MapContainer
},
# 组件使用
```
#### 参数与事件
- 参数
| 参数名 | 类型 | 说明 | 默认值 |
| :------------ | :------ | :---------------------------------------------------- | ---------------------------------- |
| styleUrl | text | 地图style地址 | mapbox://styles/mapbox/streets-v11 |
| authType | text | 认证方式, Authorization/Signature/'',空为不需要认证 | 空 |
| defaultLevel | number | 默认地图等级 | 4 |
| defaultCenter | Array | 默认地图中心 | [104.496806,36.104630] |
| debuggerMode | boolean | 是否开启调试模式,调试模式显示fps | |
| rotateAble | boolean | 是否支持旋转和倾斜 | |
| options | object | 其他选项 | 见后文 |
- options
|参数名|类型|说明|默认值|
| ---- | ---- | ---- | ---- |
| showBottom | boolean | 是否展示底部经纬度、区划状态栏 | true |
- 事件
| 参数名 | 参数类型 | 说明 |
| :----- | :------- | -------------- |
| load | object | 参数为地图实例 |
### 图层控制
> 组件内只包含图层显隐控制
>
> 拖动与最小化功能需要加载外层容器上
>
> 支持搜索
#### 使用方法
```vue
import {LayerControl} from "mapbox-map-tool";
components:{LayerControl},
```
#### 参数
| 参数名 | 参数类型 | 说明 |
| ------------ | -------- | -------------- |
| map | Object | mapbox地图实例 |
| ignoreLayers | Array | 需要隐藏的图层 |
## 地图工具
### 罗盘工具
> - 拖动罗盘外环可旋转
> - 地图旋转,罗盘同步旋转
> - 拖动内环,地图倾角发生变化

#### 引入方法
```javascript
import {CompassControl} from "mapbox-map-tool";
let control=new CompassControl({rotateAble:true,pitchAble:true});
map.addControl(control, 'bottom-right');
```
#### 可选参数
| 参数名 | 释义 | 类型 | 默认值 |
| ---------- | ------------ | ------- | ------ |
| rotateAble | 是否支持旋转 | boolean | true |
| pitchAble | 是否支持倾斜 | boolean | true |
| className | 类名 | string | "" |
### 编辑工具
> 支持传入geojson,进行编辑
>
> 双击绘制完成
``` javascript
//引入
import {EditArea} from "mapbox-map-tool";
let edit= new EditArea(map,{
callBack:res=>{
//双击绘制完成回调
console.log(res)
},
errorCallBack:res=>{
//发生错误回调
console.log(res)
},
//需要编辑的要素
feature:{
"id":"ssssssssssssssssssss",
"type": "Feature",
"properties": {},
"geometry": {
"type": "Polygon",
"coordinates": [
[
[
14.765625,
68.13885164925573
],
[
-9.140625,
-16.63619187839765
],
[
152.578125,
-15.28418511407642
],
[
161.015625,
69.90011762668541
],
[
14.765625,
68.13885164925573
]
]
]
}
}
});
edit.start()//开始编辑
// edit.close();关闭编辑
```
### 点击地块编辑工具
>支持点击面图层,然后对其进行编辑
- 引入方法
```
import {ClickEdit} from "mapbox-map-tool";
let tool= new ClickEdit(map,{clickLayers:["测试地块"],callBack:(feature)=>{
console.log(feature)
},features:[],
clickLayersFilters:[]});
tool.start();
//tool.close();
```
- 参数
| 名称 | 类型 | 解释 | 默认值 | 备注 |
| :----------------- | :------------ | :--------------------------------------------------- | ------ | ------------------------------------------------------------ |
| map | mapboxgl.Map | 地图实例 | null | |
| clickLayers | Array[String] | 需要点选的图层 | [] | 图层id数组 |
| clickLayersFilters | Array | 点击图层的数据过滤器,符合指定条件的不会触发点击事件 | [] | 示例[ { layer: "养殖地块", key: "zytype", value: "03" }, { layer: "种植地块", key: "zytype", value: "03" } ] |
| feature | Feature | 传入的需要编辑的要素 | null | |
| isFill | boolean | 传入的图层是否是面类型 | false | 图层id数组 |
| callBack | function | 绘制完成的回调函数 | null | |
| errorCallBack | function | 绘制失败的回调函数 | null | |
### 地图绘制控件
1. 多边形绘制
2. 撤销点
3. 重做点
4. 双击地图完成绘制
5. 右键地图完成绘制
``` javascript
//引入
import {DrawAreaControl} from "mapbox-map-tool";
let control=new DrawAreaControl((res)=>{
console.log(re)//绘制成功回调
},err=>{
console.log(err)//绘制失败回调
});
map.addControl(control, 'bottom-right');
```
- 参数
|参数名|类型|说明|默认值|
|:----- |:----- |:----- |----- |
|参数1|function |绘制成功回调 |null|
|参数2|function |绘制取消回调 |null|
|参数3|function |绘制失败回调 |null|
### 速选工具
> 支持在H5和浏览器端,通过快速点选地块
>
> - 可以通过挂载到mapbox的工具栏上,通过点击按钮触发激活与关闭
> - 可以通过代码控制,执行开始与关闭方法,触发激活与关闭
- 引入方法
```javascript
import {SelectPolygon} from "mapbox-map-tool";
let control=new SelectPolygon({
continueSelect:true,
clickLayers:["种植地块"],
showIcon:true,
callBack:(res)=>{
console.log(res)//绘制成功回调
},errorCallBack:err=>{
console.log(err)//绘制失败回调
},
});
map.addControl(control, 'bottom-right');
```
- 参数options
| 名称 | 类型 | 解释 | 默认值 | 备注 |
| :----------------- | :------------- | :--------------------------------------------------- | ----------------------- | ------------------------------------------------------------ |
| map | mapboxgl.Map | 地图实例 | null | |
| showIcon | boolean | 是当被添加到地图时,否展示图标 | true | |
| iconCLassName | string | 按钮图标类名 | "iconfont-map map-icon-tianjia" | |
| callBackName | string | 绘制完成时,触发的地图事件,空则不触发 | “ ” | |
| errorEventName | string | 绘制错误时,触发的地图事件,空则不触发 | “ ” | |
| chineseName | string | 中文工具名称 | "点选" | |
| continueSelect | boolean | 是否连续绘制 | true | |
| clickLayers | Array[String] | 需要点选的图层 | [] | 图层id数组 |
| clickLayersFilters | Array | 点击图层的数据过滤器,符合指定条件的不会触发点击事件 | [] | 示例[ { layer: "养殖地块", key: "zytype", value: "03" }, { layer: "种植地块", key: "zytype", value: "03" } ] |
| features | Array[Feature] | 需要预先展示为高亮的要素 | [] | |
| stopLayers | Array[String] | 阻挡点击事件向下传递的图层 | [] | 图层id数组 |
| callBack | function | 绘制完成的回调函数 | null | |
| errorCallBack | function | 绘制失败的回调函数 | null | |
- 方法
- `start` 开始绘制
- `close` 关闭工具,移除地图上的效果
- `clear` 移除地图上涂鸦效果
- 事件
- `tool_bind` 工具绑定
- `tool_remove` 工具移除
- `tool_active` 工具激活
- `tool_inactive` 工具冻结
### 绘制编辑工具
> 支持在H5和浏览器端,绘制地块然后拖动节点进行编辑
>
> - 是用了内置的mapbox-gl-draw
> - 可以通过代码控制,执行开始与关闭方法,触发激活与关闭
- 引入方法
```javascript
import {SelectPolygon} from "mapbox-map-tool";
let control=new SelectPolygon({
continueSelect:true,
clickLayers:["种植地块"],
showIcon:true,
callBack:(res)=>{
console.log(res)//绘制成功回调
},errorCallBack:err=>{
console.log(err)//绘制失败回调
},
});
map.addControl(control, 'bottom-right');
```
- 参数options
| 名称 | 类型 | 解释 | 默认值 | 备注 |
| :----------------- | :------------- | :--------------------------------------------------- | ----------------------- | ------------------------------------------------------------ |
| map | mapboxgl.Map | 地图实例 | null | |
| showIcon | boolean | 是当被添加到地图时,否展示图标 | true | |
| iconCLassName | string | 按钮图标类名 | "iconfont-map map-icon-tianjia" | |
| callBackName | string | 绘制完成时,触发的地图事件,空则不触发 | “ ” | |
| errorEventName | string | 绘制错误时,触发的地图事件,空则不触发 | “ ” | |
| chineseName | string | 中文工具名称 | "点选" | |
| continueSelect | boolean | 是否连续绘制 | true | |
| clickLayers | Array[String] | 需要点选的图层 | [] | 图层id数组 |
| clickLayersFilters | Array | 点击图层的数据过滤器,符合指定条件的不会触发点击事件 | [] | 示例[ { layer: "养殖地块", key: "zytype", value: "03" }, { layer: "种植地块", key: "zytype", value: "03" } ] |
| features | Array[Feature] | 需要预先展示为高亮的要素 | [] | |
| stopLayers | Array[String] | 阻挡点击事件向下传递的图层 | [] | 图层id数组 |
| callBack | function | 绘制完成的回调函数 | null | |
| errorCallBack | function | 绘制失败的回调函数 | null | |
- 方法
- `start` 开始绘制
- `close` 关闭工具,移除地图上的效果
- `clear` 移除地图上涂鸦效果
- 事件
- `tool_bind` 工具绑定
- `tool_remove` 工具移除
- `tool_active` 工具激活
- `tool_inactive` 工具冻结
### 线绘制工具
> 支持线段和折线绘制
>
> - 右键或双击完成绘制
> - 支持绘制时实时回调,和长度计算
- 引入方法
```javascript
import {DrawLineTool} from "mapbox-map-tool";
let control=new DrawLineTool({
callBack:(e)=>{
console.log("绘制完成",e)
},
moveCallBack:(e)=>{
console.log("移动",e)
},
});
map.addControl(control, 'bottom-right')
```
- 参数options
| 名称 | 类型 | 解释 | 默认值 |
| :------------ | :----------- | :------------------------------------- | ----------------------- |
| map | mapboxgl.Map | 地图实例 | null |
| showIcon | boolean | 是当被添加到地图时,否展示图标 | true |
| iconCLassName | string | 按钮图标类名 | "iconfont-map map-icon-zhexian" |
| callBackName | string | 绘制完成时,触发的地图事件,空则不触发 | “ ” |
| errorCallBack | string | 绘制错误时,回调事件 | “ ” |
| callBack | function | 绘制完成的回调函数 | null |
| errorCallBack | function | 绘制失败的回调函数 | null |
| moveCallBack | function | 鼠标移动时回调函数 | null |
| moveCallName | string | 鼠标移动触发地图事件名称 | “ ” |
| chineseName | string | 中文工具名称 | "线" |
| isBrokenLine | boolean | 是否绘制折线,否绘制线段 | true |
| checkValid | boolean | 是否检测自相交,自相交时会调用错误回调 | false |
| showLength | boolean | 是否实时展示长度 | false |
| lineColor | string | 线颜色 | #00FA9A |
| lineWidth | number | 线的宽度 | 1 |
| pointColor | string | 点的颜色 | #00BFFF |
| pointSize | number | 点的大小 | 5 |
- 方法
- `start` 开始绘制
- `close` 关闭工具,移除地图上的效果
- `clear` 移除地图上绘制效果
- 事件
- `tool_bind` 工具绑定
- `tool_remove` 工具移除
- `tool_active` 工具激活
- `tool_inactive` 工具冻结
### 点绘制工具
> 支持单个点和批量绘制
>
> - 右键或双击完成绘制
> - 支持绘制时实时显示坐标
- 引入方法
```javascript
import {DrawPointTool} from "mapbox-map-tool";
let control=new DrawLineTool({
showPosition:true,
callBack:(e)=>{
console.log("绘制完成",e)
},
moveCallBack:(e)=>{
console.log("移动",e)
},
});
map.addControl(control, 'bottom-right')
```
- 参数options
| 名称 | 类型 | 解释 | 默认值 |
| :------------ | :----------- | :------------------------------------- | -------------------- |
| map | mapboxgl.Map | 地图实例 | null |
| showIcon | boolean | 是当被添加到地图时,否展示图标 | true |
| iconCLassName | string | 按钮图标类名 | "iconfont-map map-icon-dian" |
| callBackName | string | 绘制完成时,触发的地图事件,空则不触发 | “ ” |
| errorCallBack | string | 绘制错误时,回调事件 | “ ” |
| callBack | function | 绘制完成的回调函数 | null |
| errorCallBack | function | 绘制失败的回调函数 | null |
| moveCallBack | function | 鼠标移动时回调函数 | null |
| moveCallName | string | 鼠标移动触发地图事件名称 | “ ” |
| chineseName | string | 中文工具名称 | "带你" |
| continueDraw | boolean | 是否连续绘制 | true |
| showPosition | boolean | 是否实时展示最新绘制的点位 | false |
| pointColor | string | 点的颜色 | #00BFFF |
| pointSize | number | 点的大小 | 5 |
- 方法
- `start` 开始绘制
- `close` 关闭工具,移除地图上的效果
- `clear` 移除地图上绘制效果
- 事件
- `tool_bind` 工具绑定
- `tool_remove` 工具移除
- `tool_active` 工具激活
- `tool_inactive` 工具冻结
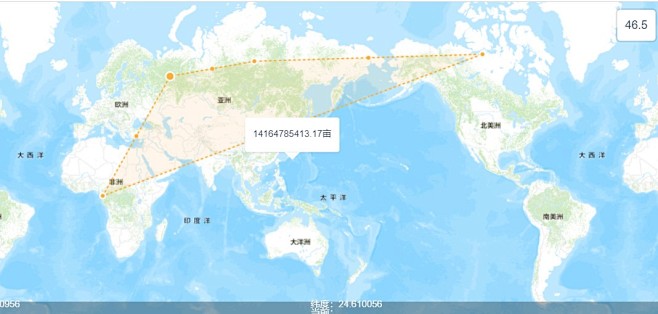
### 面绘制工具
> 鼠标点击地图即可操作
>
> - 自带工具条
> - 支持外部撤销、回退、加点、十字丝等
- 引入方法
```javascript
import {DrawArea} from "mapbox-map-tool";
let control=new DrawArea({
showIcon:true,
showArea:true,
checkValid:true,
showTool:true,
continueDraw:true,
callBack:(res)=>{
console.log("完成",res)//绘制成功回调
},
updateCallBack:(res)=>{
console.log("更新",res)//绘制成功回调
},
errorCallBack:err=>{
console.log("错误",err)//绘制失败回调
},
});
map.addControl(control, 'bottom-right')
```
- 参数options
| 名称 | 类型 | 解释 | 默认值 |
| :-------------- | :----------- | :------------------------------------- | ------------------------------------------------------------ |
| map | mapboxgl.Map | 地图实例 | null |
| showIcon | boolean | 是当被添加到地图时,否展示图标 | true |
| iconCLassName | string | 按钮图标类名 | "iconfont-map map-icon-huizhi" |
| callBackName | string | 绘制完成时,触发的地图事件,空则不触发 | “ ” |
| errorCallBack | string | 绘制错误时,回调事件 | “ ” |
| callBack | function | 绘制完成的回调函数 | null |
| errorCallBack | function | 绘制失败的回调函数 | null |
| updateCallBack | function | 绘制过程回调函数 | null |
| updateEventName | string | 绘制过程触发地图事件名称 | “ ” |
| chineseName | string | 中文工具名称 | "绘制" |
| showCross | boolean | 是否显示屏幕十字丝 | false |
| checkValid | boolean | 是否检测自相交,自相交时会调用错误回调 | false |
| showArea | boolean | 是否实时展示面积 | false |
| showTool | boolean | 是否显示撤销工具条 | false |
| toolPosition | string | 工具条位置 | 工具条位置,'top-left' , 'top-right' , 'bottom-left' ,和 'bottom-right' 。默认为 'top-right' |
- 方法
- `start` 开始绘制
- `close` 关闭工具,移除地图上的效果
- `clear` 移除地图上绘制效果
- `cancel` 取消绘制
- `redo` 重新绘制点
- `undo` 撤销上一个点
- `drawFinish` 绘制完成
- `addPoint` 添加屏幕中心点
- 事件
- `tool_bind` 工具绑定
- `tool_remove` 工具移除
- `tool_active` 工具激活
- `tool_inactive` 工具冻结
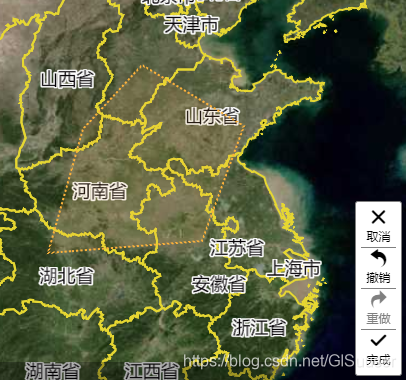
### 分割工具
> 选择多边形然后绘制线进行分割
>
> - 支持传入多边形或手动选择多边形
>
> - 绘制线段后自动分割
>
> - 支持实时显示分割后面积
- 引入方法
```javascript
import {SplitTool} from "mapbox-map-tool";
let control=new SplitTool({
features:[],
clickLayers:["测试地块"],
callBack:(e)=>{
console.log("绘制完成",e)
},
moveCallBack:(e)=>{
console.log("移动",e)
},
});
map.addControl(control, 'bottom-right')
```
- 参数options
| 名称 | 类型 | 解释 | 默认值 |
| :------------ | :----------- | :------------------------------------- | ---------------------- |
| map | mapboxgl.Map | 地图实例 | null |
| showIcon | boolean | 是当被添加到地图时,否展示图标 | true |
| iconCLassName | string | 按钮图标类名 | "iconfont-map map-icon-fenge" |
| callBackName | string | 绘制完成时,触发的地图事件,空则不触发 | “ ” |
| errorCallBack | string | 绘制错误时,回调事件 | “ ” |
| callBack | function | 绘制完成的回调函数 | null |
| errorCallBack | function | 绘制失败的回调函数 | null |
| chineseName | string | 中文工具名称 | "分割" |
| showArea | boolean | 是否实时预览分割面积 | false |
| checkValid | boolean | 是否检测自相交,自相交时会调用错误回调 | false |
| showLength | boolean | 是否实时展示长度 | false |
| clickLayers | Array[String] | 需要点选的图层 | [] |
| clickLayersFilters | Array | 点击图层的数据过滤器,符合指定条件的不会触发点击事件 | [] |
| features | Array[Feature] | 需要预先展示为高亮的要素 | [] |
| stopLayers | Array[String] | 阻挡点击事件向下传递的图层 | [] |
- 方法
- `start` 开始绘制
- `close` 关闭工具,移除地图上的效果
- `clear` 移除地图上绘制效果
- 事件
- `tool_bind` 工具绑定
- `tool_remove` 工具移除
- `tool_active` 工具激活
- `tool_inactive` 工具冻结
### 合并工具
> 选择多边形然双击或者右键开始合并
>
> - 支持传入多边形或手动选择多边形
- 引入方法
```javascript
import {MergeTool} from "mapbox-map-tool";
let control=new MergeTool({
features:[],
clickLayers:["测试地块"],
callBack:(e)=>{
console.log("合并完成",e)
},
});
map.addControl(control, 'bottom-right')
```
- 参数options
| 名称 | 类型 | 解释 | 默认值 |
| :------------ | :----------- | :------------------------------------- | ---------------------- |
| map | mapboxgl.Map | 地图实例 | null |
| showIcon | boolean | 是当被添加到地图时,否展示图标 | true |
| iconCLassName | string | 按钮图标类名 | "iconfont-map map-icon-hebing" |
| callBackName | string | 绘制完成时,触发的地图事件,空则不触发 | “ ” |
| errorCallBack | string | 绘制错误时,回调事件 | “ ” |
| callBack | function | 绘制完成的回调函数 | null |
| errorCallBack | function | 绘制失败的回调函数 | null |
| chineseName | string | 中文工具名称 | "合并" |
| checkValid | boolean | 是否检测自相交,自相交时会调用错误回调 | false |
| clickLayers | Array[String] | 需要点选的图层 | [] |
| clickLayersFilters | Array | 点击图层的数据过滤器,符合指定条件的不会触发点击事件 | [] |
| features | Array[Feature] | 需要预先展示为高亮的要素 | [] |
| stopLayers | Array[String] | 阻挡点击事件向下传递的图层 | [] |
- 方法
- `start` 开始绘制
- `close` 关闭工具,移除地图上的效果
- `clear` 移除地图上绘制效果
- 事件
- `tool_bind` 工具绑定
- `tool_remove` 工具移除
- `tool_active` 工具激活
- `tool_inactive` 工具冻结
### 抠除工具
> 选择多边形然后绘制线进行分割
>
> - 支持传入多边形或手动选择多边形
>
> - 绘制线段后自动分割
>
> - 支持实时显示分割后面积
- 引入方法
```javascript
import {DeductTool} from "mapbox-map-tool";
let control=new DeductTool({
features:[],
clickLayers:["测试地块"],
callBack:(e)=>{
console.log("绘制完成",e)
},
});
map.addControl(control, 'bottom-right')
```
- 参数options
| 名称 | 类型 | 解释 | 默认值 |
| :------------ | :----------- | :------------------------------------- | ---------------------- |
| map | mapboxgl.Map | 地图实例 | null |
| showIcon | boolean | 是当被添加到地图时,否展示图标 | true |
| iconCLassName | string | 按钮图标类名 | "iconfont-map map-icon-kouchu" |
| callBackName | string | 绘制完成时,触发的地图事件,空则不触发 | “ ” |
| errorCallBack | string | 绘制错误时,回调事件 | “ ” |
| callBack | function | 绘制完成的回调函数 | null |
| errorCallBack | function | 绘制失败的回调函数 | null |
| chineseName | string | 中文工具名称 | "抠除" |
| showArea | boolean | 是否实时预览扣除区域面积 | false |
| checkValid | boolean | 是否检测自相交,自相交时会调用错误回调 | false |
| clickLayers | Array[String] | 需要点选的图层 | [] |
| clickLayersFilters | Array | 点击图层的数据过滤器,符合指定条件的不会触发点击事件 | [] |
| features | Array[Feature] | 需要预先展示为高亮的要素 | [] |
| stopLayers | Array[String] | 阻挡点击事件向下传递的图层 | [] |
| showTool | boolean | 中间绘制面时是否需展示工具条 | false |
- 方法
- `start` 开始
- `close` 关闭工具,移除地图上的效果
- `clear` 移除地图上绘制效果
- 事件
- `tool_bind` 工具绑定
- `tool_remove` 工具移除
- `tool_active` 工具激活
- `tool_inactive` 工具冻结
### 涂鸦工具
> 支持在H5和浏览器端,通过拖拽的方式生成涂鸦
>
> - 可以通过挂载到mapbox的工具栏上,通过点击按钮触发激活与关闭
> - 可以通过代码控制,执行开始与关闭方法,触发激活与关闭
- 引入方法
```javascript
import {Graffiti} from "mapbox-map-tool";
let control=new Graffiti({
showArea:true,
checkValid:true,
continueDraw:true,
callBackName:"test",
showIcon:true,
callBack:(res)=>{
console.log(res)//绘制成功回调
},errorCallBack:err=>{
console.log(err)//绘制失败回调
},
});
map.addControl(control, 'bottom-right');
map.on("test",function (e){
console.log("test",e)
})
control.start();
```
- 参数options
| 名称 | 类型 | 解释 | 默认值 |
| :------------- | :----------- | :------------------------------------- | -------------------- |
| map | mapboxgl.Map | 地图实例 | null |
| showIcon | boolean | 是当被添加到地图时,否展示图标 | true |
| iconCLassName | string | 按钮图标类名 | "iconfont-map map-icon-tuya" |
| callBackName | string | 绘制完成时,触发的地图事件,空则不触发 | “ ” |
| errorEventName | string | 绘制错误时,触发的地图事件,空则不触发 | “ ” |
| chineseName | string | 中文工具名称 | "涂鸦" |
| continueDraw | boolean | 是否连续绘制 | true |
| checkValid | boolean | 是否检测自相交,自相交时会调用错误回调 | false |
| showArea | boolean | 是否实时展示面积 | false |
| callBack | function | 绘制完成的回调函数 | null |
| errorCallBack | function | 绘制失败的回调函数 | null |
| drawLineOnly | boolean | 为true时只绘制线,先不自动闭合 | false |
- 方法
- `start` 开始绘制
- `close` 关闭工具,移除地图上的效果
- `clear` 移除地图上涂鸦效果
- 事件
- `tool_bind` 工具绑定
- `tool_remove` 工具移除
- `tool_active` 工具激活
- `tool_inactive` 工具冻结
### 工具状态管理器
>在将众多工具,引入到地图上时,各类工具切换时的状态管理就成了一个很大的问题。这里提供一个简单的工具,对地图工具的切换进行管理。
- 引入方法
```javascript
import {StateManager} from "mapbox-map-tool";
```
- constructor(changeEvent,defaultStatueMaker)
- `changeEvent` 工具切换回调
- `defaultStatueMaker` 默认工具构造器
```javascript
this.stateManager = new StateManager(
funId => {
console.log("切换工具到" + funId)
},
()=>{
return new SelectPolygon({
map: this.map,
continueSelect: true,
clickLayers: ["测试地块"],
stopLayers:["采集地块"],
showIcon: false,
callBack: (res) => {
this.curFeatures=res.features
}, errorCallBack: err => {
console.log(err)//绘制失败回调
},
});
}
);
```
- 方法
- setCurFun(control) 设置当前工具
```javascript
let control = new DrawArea({
map: this.map,
showIcon: false,
showArea: true,
checkValid: true,
showTool: true,
continueDraw: false,
showCross:true,
toolPosition:"top-left",
callBack: (res) => {
this.stateManager.removeCurrent();
console.log("完成", res)//绘制成功回调
},
updateCallBack: (res) => {
console.log("更新", res)//绘制成功回调
},
errorCallBack: err => {
console.log("错误", err)//绘制失败回调
},
});
this.stateManager.setCurFun(control)
```
- removeCurrent() 移除当前工具
- getCurrentFunId() 获取当前工具的id
- setDefaultMaker() 设置默认的工具构造器
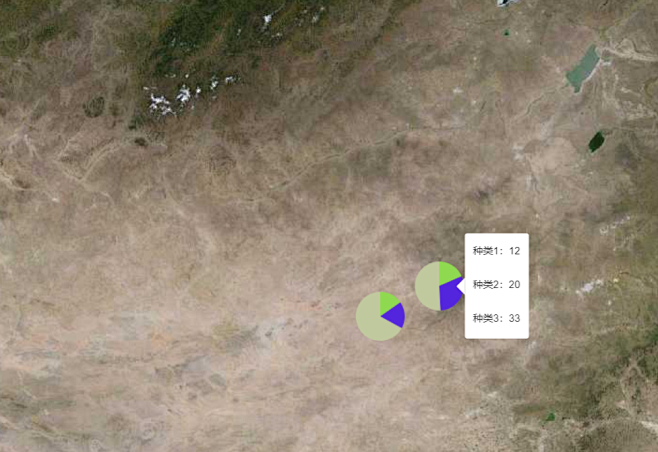
## 图表图层
### 饼图
> 通过坐标在地图上生成饼,并支持鼠标滑过显示提示信息
- 使用方法
```javascript
import {PieCustomLayer} from "mapbox-map-tool";
let chartLayer=new PieCustomLayer("统计图",[{ point:[112.6,45],values:[35.6,41.2,155.9]},{ point:[114,45.5],values:[12,20,33]}])
chartLayer.addToMap(map);
```
- constructor
| 参数 | 类型 | 说明 | 备注 |
| ------------ | --------- | ------ | ------------------------------------------------------------ |
| 第一参数id | string | 图层id | |
| 第二参数data | JsonArray | 数据源 | [{ point:[112.6,45],values:[35.6,41.2,155.9]},{ point:[114,45.5],values:[12,20,33]}] |
| options | Json | 配置项 | 见下表 |
- options
| 参数 | 类型 | 说明 | 备注 |
| ----------------- | ------------- | ------------------------ | ------------------------------------------------------------ |
| width | int | 图标宽度 | 单位px,偶数 默认60 |
| height | int | 图标宽度 | 强制等于宽度 |
| chartAnchor | string | 锚点位置 | 'center' , 'top' , 'bottom' , 'left' , 'right' , 'top-left' , 'top-right' , 'bottom-left' , and 'bottom-right' 'center' , 'top' , 'bottom' , 'left' , 'right' , 'top-left' , 'top-right' , 'bottom-left' , and 'bottom-right' 默认center |
| showPopup | boolean | 是否展示popup | 默认false |
| popupAnchor | string | popup锚点 | 'center'` , `'top'` , `'bottom'` , `'left'` , `'right'` , `'top-left'` , `'top-right'` , `'bottom-left'` ,以及 `'bottom-right' 默认left |
| popupClassName | string | popup的className | |
| popupHtmlTemplate | string | popup的模版 | 示例:"种类1:${val0}
种类2:${val1}
种类3:${val2}
",${val0}会自动替换data中values中的第一个值,以此类推 |
| colors | array[string] | 分类颜色16进制 | 颜色为空或比值的种类少,会自动补充随机颜色 |
| popupOffsets | json | popup偏移量 | 默认{ 'top': [0, 0], 'left': [20, 0], 'bottom': [0, 0], } |
| clickCallBack | function | 点击标签回调 | |
| overCallBack | function | 鼠标滑过标签回调 | |
| clickCallBackName | function | 点击标签触发地图事件名 | |
| overCallBackName | function | 鼠标经过触发地图事件名称 | |
- 方法
| 参数名 | 类型 | 说明 |
| -------- | ------------ | ---------------------- |
| addToMap | mapboxgl.Map | 将图层添加到地图并渲染 |
| remove | - | 移除当前图层 |
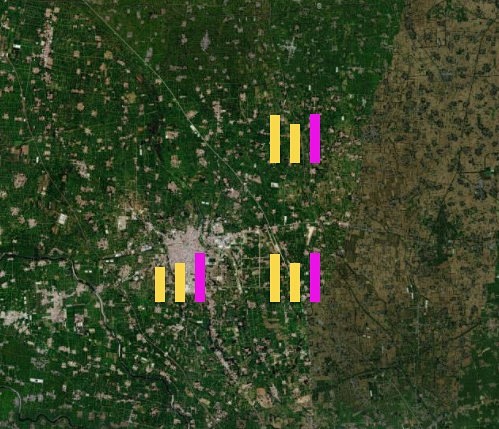
### 柱状图
> 通过坐标在地图上生成柱状图,并支持鼠标滑过显示提示信息
- 使用方法
```javascript
//引入
import {BarCustomLayer} from "mapbox-map-tool";
let chartLayer = new BarCustomLayer("统计图", [
{
point: [114.514780, 33.777750],
values: [[2011, 32], [2012, 36], [2022, 45]]
},
{point: [114.614780, 33.777750],
values: [[2011, 44], [2012, 36], [2022, 45]]
},
{point: [114.614780, 33.877750],
values: [[2011, 44], [2012, 36], [2022, 45]]
} ], {
clickCallBack: (data) => {
console.log(data)
},
width: 60,
height: 60,
})
chartLayer.addToMap(map)
```
- constructor
| 参数 | 类型 | 说明 | 备注 | |
| ------------ | --------- | ------ | ------------------------------------------------------------ |
| 第一参数id | string | 图层id | |
| 第二参数data | JsonArray | 数据源 | [{point:[114.514780,33.777750],values:[[2011,32],[2012,36],[2022,45]]},{point:[114.614780,33.777750],values:[[2011,44],[2012,36],[2022,45]]},{point:[114.614780,33.877750],values:[[2011,44],[2012,36],[2022,45]]}] |
| options | Json | 配置项 | 见下表 |
- options
| 参数 | 类型 | 说明 | 备注 |
| ----------------- | ------------- | ------------------------ | ------------------------------------------------------------ |
| width | int | 图标宽度 | 单位px,偶数 默认60 |
| height | int | 图标宽度 | 单位px,偶数 默认60 |
| chartAnchor | string | 锚点位置 | 'center' , 'top' , 'bottom' , 'left' , 'right' , 'top-left' , 'top-right' , 'bottom-left' , and 'bottom-right' 'center' , 'top' , 'bottom' , 'left' , 'right' , 'top-left' , 'top-right' , 'bottom-left' , and 'bottom-right' 默认center |
| showPopup | boolean | 是否展示popup | 默认false |
| popupAnchor | string | popup锚点 | 'center'` , `'top'` , `'bottom'` , `'left'` , `'right'` , `'top-left'` , `'top-right'` , `'bottom-left'` ,以及 `'bottom-right' 默认left |
| popupClassName | string | popup的className | |
| popupHtmlTemplate | string | popup的模版 | 示例:"种类1:${val0}
种类2:${val1}
种类3:${val2}
",${val0}会自动替换data中values中的第一个值,以此类推 |
| colors | array[string] | 分类颜色16进制 | 颜色为空或比值的种类少,会自动补充随机颜色,如果想颜色一致,数组里填充 一样的颜色即可 |
| popupOffsets | json | popup偏移量 | 默认{ 'top': [0, 0], 'left': [20, 0], 'bottom': [0, 0], } |
| clickCallBack | function | 点击标签回调 | |
| overCallBack | function | 鼠标滑过标签回调 | |
| clickCallBackName | function | 点击标签触发地图事件名 | |
| overCallBackName | function | 鼠标经过触发地图事件名称 | |
| barMargin | Number | 柱间距 | 默认10 |
| barMaxWidth | Number | 柱最大宽度 | 默认100 |
- 方法
| 参数名 | 类型 | 说明 |
| -------- | ------------ | ---------------------- |
| addToMap | mapboxgl.Map | 将图层添加到地图并渲染 |
| remove | - | 移除当前图层 |
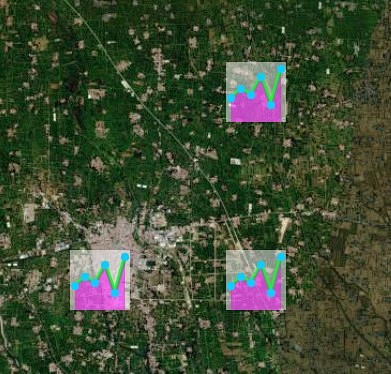
### 折线图
> 通过坐标在地图上生成折线图,并支持鼠标滑过显示提示信息
- 使用方法
```javascript
//引入
import {LineCustomLayer} from "mapbox-map-tool";
let chartLayer = new LineCustomLayer("统计图", [
{
point: [114.514780, 33.777750],
values: [35,48,39,65,24,76]
},
{point: [114.614780, 33.777750],
values: [35,48,39,65,24,76]
},
{point: [114.614780, 33.877750],
values: [35,48,39,65,24,76]
}
], {
clickCallBack: (data) => {
console.log(data)
},
width: 60,
height: 60,
})
chartLayer.addToMap(map)
```
- constructor
| 参数 | 类型 | 说明 | 备注 | |
| ------------ | --------- | ------ | ------------------------------------------------------------ | ---- |
| 第一参数id | string | 图层id | | |
| 第二参数data | JsonArray | 数据源 | [{point:[114.514780,33.777750],values:[35,48,39,65,24,76]},{point:[114.614780,33.777750],values:[35,48,39,65,24,76]},{point:[114.614780,33.877750],values:[35,48,39,65,24,76]}] | |
| options | Json | 配置项 | 见下表 | |
- options
| 参数 | 类型 | 说明 | 备注 |
| ----------------- | ------------- | ------------------------ | ------------------------------------------------------------ |
| width | int | 图标宽度 | 单位px,偶数 默认60 |
| height | int | 图标宽度 | 单位px,偶数 默认60 |
| chartAnchor | string | 锚点位置 | 'center' , 'top' , 'bottom' , 'left' , 'right' , 'top-left' , 'top-right' , 'bottom-left' , and 'bottom-right' 'center' , 'top' , 'bottom' , 'left' , 'right' , 'top-left' , 'top-right' , 'bottom-left' , and 'bottom-right' 默认center |
| showPopup | boolean | 是否展示popup | 默认false |
| popupAnchor | string | popup锚点 | 'center'` , `'top'` , `'bottom'` , `'left'` , `'right'` , `'top-left'` , `'top-right'` , `'bottom-left'` ,以及 `'bottom-right' 默认left |
| popupClassName | string | popup的className | |
| popupHtmlTemplate | string | popup的模版 | 示例:"种类1:${val0}
种类2:${val1}
种类3:${val2}
",${val0}会自动替换data中values中的第一个值,以此类推 |
| colors | array[string] | 分类颜色16进制 | 颜色为空或比值的种类少,会自动补充随机颜色,如果想颜色一致,数组里填充 一样的颜色即可 |
| popupOffsets | json | popup偏移量 | 默认{ 'top': [0, 0], 'left': [20, 0], 'bottom': [0, 0]} |
| clickCallBack | function | 点击标签回调 | |
| overCallBack | function | 鼠标滑过标签回调 | |
| clickCallBackName | function | 点击标签触发地图事件名 | |
| overCallBackName | function | 鼠标经过触发地图事件名称 | |
| lineColor | string | 折线颜色 | 默认#0DFE29 |
| fillColor | string | 折线下方填充颜色 | 默认rgba(255,0,255,0.5) |
| lineWidth | number | 折线宽度 | 默认4 |
| pointColor | string | 折点颜色 | #0DCEFE |
| pointSize | number | 折点大小 | 默认4 |
| backgroundColor | string | 折线图背景色 | 默认rgba(255,255,255,0.5) |
- 方法
| 参数名 | 类型 | 说明 |
| -------- | ------------ | ---------------------- |
| addToMap | mapboxgl.Map | 将图层添加到地图并渲染 |
| remove | - | 移除当前图层 |
## 通用工具
### 地图长按H5
> 支持在H5页面上实现移动端的长按事件
- 使用方法
```javascript
import {LongTouch} from "mapbox-map-tool";
//新增长按监听
let longTouch=new LongTouch(map,"test",res=>{
console.log(res);
})
longTouch.close();//移除长按监听
```
```
- constructor
| 参数 | 类型 | 说明 | 备注 | |
| ------------ | --------- | ------ | ------------------------------------------------------------ |
| 第一参数id | string | 图层id | |
| 第二参数data | JsonArray | 数据源 | [{point:[114.514780,33.777750],values:[[2011,32],[2012,36],[2022,45]]},{point:[114.614780,33.777750],values:[[2011,44],[2012,36],[2022,45]]},{point:[114.614780,33.877750],values:[[2011,44],[2012,36],[2022,45]]}] |
| options | Json | 配置项 | 见下表 |
- options
| 参数 | 类型 | 说明 | 备注 |
| ----------------- | ------------- | ------------------------ | ------------------------------------------------------------ |
| width | int | 图标宽度 | 单位px,偶数 默认60 |
| height | int | 图标宽度 | 单位px,偶数 默认60 |
| chartAnchor | string | 锚点位置 | 'center' , 'top' , 'bottom' , 'left' , 'right' , 'top-left' , 'top-right' , 'bottom-left' , and 'bottom-right' 'center' , 'top' , 'bottom' , 'left' , 'right' , 'top-left' , 'top-right' , 'bottom-left' , and 'bottom-right' 默认center |
| showPopup | boolean | 是否展示popup | 默认false |
| popupAnchor | string | popup锚点 | 'center'` , `'top'` , `'bottom'` , `'left'` , `'right'` , `'top-left'` , `'top-right'` , `'bottom-left'` ,以及 `'bottom-right' 默认left |
| popupClassName | string | popup的className | |
| popupHtmlTemplate | string | popup的模版 | 示例:"种类1:${val0}
种类2:${val1}
种类3:${val2}
",${val0}会自动替换data中values中的第一个值,以此类推 |
| colors | array[string] | 分类颜色16进制 | 颜色为空或比值的种类少,会自动补充随机颜色,如果想颜色一致,数组里填充 一样的颜色即可 |
| popupOffsets | json | popup偏移量 | 默认{ 'top': [0, 0], 'left': [20, 0], 'bottom': [0, 0], } |
| clickCallBack | function | 点击标签回调 | |
| overCallBack | function | 鼠标滑过标签回调 | |
| clickCallBackName | function | 点击标签触发地图事件名 | |
| overCallBackName | function | 鼠标经过触发地图事件名称 | |
| barMargin | Number | 柱间距 | 默认10 |
| barMaxWidth | Number | 柱最大宽度 | 默认100 |
- 方法
| 参数名 | 类型 | 说明 |
| -------- | ------------ | ---------------------- |
| addToMap | mapboxgl.Map | 将图层添加到地图并渲染 |
| remove | - | 移除当前图层 |
## 通用工具
### 地图长按H5
> 支持在H5页面上实现移动端的长按事件
- 使用方法
```javascript
import {LongTouch} from "mapbox-map-tool";
//新增长按监听
let longTouch=new LongTouch(map,"test",res=>{
console.log(res);
})
longTouch.close();//移除长按监听
```
- 参数
| 参数名 | 类型 | 说明 | 默认值 |
| :-------- | :---------- | :------------------------ | ------ |
| map | MapBoxGlMap | 地图对象 | null |
| layerId | text | 图层id | null |
| callback | function | 回调函数,返回值为Feature | null |
| timeValue | number | 长按时间 | 1000 |
## 其他
### 地图点击H5(兼容长按)
> 在H5地图上,同时支持touch和longTouch事件。可有效减少对同一图层的监听数量,避免长按和点击监听的冲突。与前面的LongTouch使用方法一样,只是回调函数返回值不同。
- 使用方法
```javascript
import {Touch} from "mapbox-map-tool";
//新增长按监听
let touch=new Touch(map,"test",res=>{
console.log(res);
})
touch.close();//移除长按监听
```
- 参数
| 参数名 | 类型 | 说明 | 默认值 |
| :-------- | :---------- | :----------------------- | ------ |
| map | MapBoxGlMap | 地图对象 | null |
| layerId | text | 图层id | null |
| callback | function | 回调函数,返回值参考下面 | null |
| timeValue | number | 长按时间 | 1000 |
- 返回值
```json
{
"type":"LongTouch",//点击事件返回“Touch”,长按事件返回“LongTouch”
"data":Fearure //geojson格式
}
```
### 通用方法集
> 地图操作的常用方法
- 使用方法
```javascript
import {Touch} from "mapbox-map-tool";
MapCommon.copyLineToAreaFit(this.map,"种植地块","种植地块_面");
```
- 主要方法
| 方法名 | 用途 | 返回值 |
| ------------------------------------------------------------ | ----------------------------------------------- | ------- |
| deductPolygon(polygon,maskPolygon) | 计算从一个多边形中扣除另一个多边形的剩余部分 | polygon |
| removeLayerAndSource(map,id) | 同时移除id相同的图层和数据源 | |
| addHighLightPolygon(map,geoJson) | 将多边形高亮到地图 | 图层id |
| hideLayerById(layerId,map) | 根据id隐藏图层 | |
| hideLayers(layerIds,map) | 批量隐藏图层 | |
| showLayerById(layerId,map) | 根据id显示图层 | |
| showLayers(layerIds,map) | 批量显示图层 | |
| fitBoundsWkt(map,wkt) | 定位地图到wkt四至范围 | |
| fitBoundsGeoJson(map,geoJson) | 定位地图到geojson四至范围 | |
| handleMultiPolygon(coordinates,featuresR,properties) | 将multiPolygon的coordinates解析成polygonFeature | |
| splitPolygon(polygon,line) | 通过线分割多边形 | polygon |
| unionPolygons(polygonArr = [],buffer = 2) | 合并,合并多个polygon | polygon |
| merge_polygon_tow_buffer(polygonA,polygonB,buffer=10) | 合并(只能合并两个polygon) | polygon |
| merge_polygon_tow(polygonA,polygonB) | 合并(只能合并两个polygon) | polygon |
| unionFeatures(featureArr) | 将feature合并为一个feature | |
| nextLevelLoaded(map,layerId) | 图层加载完成回调 | Promise |
| zoomToLayer(map,layerId) | 缩放到这个图层的可见范围 | |
| removeSource(map,sourceId) | 移除数据源 | |
| removeLayer(map,layerId) | 移除图层 | |
| filterLayers(map,filterProp,filter,layer,commonSrcLayers) | 根据条件过滤指定图层,给地图增加过滤条件 | |
| offClickLayer(map,srcLayerName) | 关闭图层所有点击事件 | |
| addClickLayer(map,srcLayerName,targetLayerName,clickCallBack,context) | 将原图层复制为一个可点击的面图层 | |
| copyLineToArea(map,srcLayerName,targetLayerName) | 将线图层复制为面图层 | |
# 更新记录
- 1.0.1 新增多边形编辑
- 1.0.4 新增地图容器,支持自动获取tk信息
- 1.0.7 新增长按监听和公共函数
- 1.2.4 地图绘制控件
- 1.2.5 地图绘制控件增加取消回调
- 1.2.8 增加Touch对象,同时支持H5上的点击和长按
- 1.2.9 增加罗盘组件
- 1.2.10 增加图层控制组件
- 1.2.13 增加柱状图和饼状图工具
- 1.2.14 增加折线图工具
- 1.2.15 增加绘制线工具
- 1.2.16 升级面绘制工具,新增分割、扣除、合并工具
- 1.2.25 新增批量点绘制工具