# japan-choropleth
日本の行政区域・衆議院小選挙区のポリゴンデータと、コロプレス(塗り分け)地図を作成するための JavaScript パッケージです。JavaScriptの動作には[Leaflet](https://github.com/leaflet/Leaflet)が必要です。
ポリゴンデータだけを使うことも、付属の JavaScript でWeb向けのコロプレス地図を作成することもできます。`data/` には TopoJSON と GeoJSON のポリゴンデータ、`dist/` にはWeb用のJavaScriptを収録しています。
## インストール
```bash
npm install japan-choropleth leaflet
```
ポリゴンデータのみ使用する場合や、JavaScriptをCDNから利用する場合はインストール不要です。(後述)
## ポリゴンデータ
ポリゴンデータは `data/` 以下にあります。Web 配信には TopoJSON、GIS ツールやデータ加工には GeoJSON が向いています。
| データ | 件数 | 全国版 | 都道府県別 |
| --- | ---: | --- | --- |
| 行政区域境界(都道府県) | 47 | あり | なし |
| 行政区域境界(市区町村) | 1,905 | あり | あり |
| 衆院小選挙区境界 | 289 | あり | あり |
| 行政区域境界×小選挙区境界 | 1,927 | あり | あり |
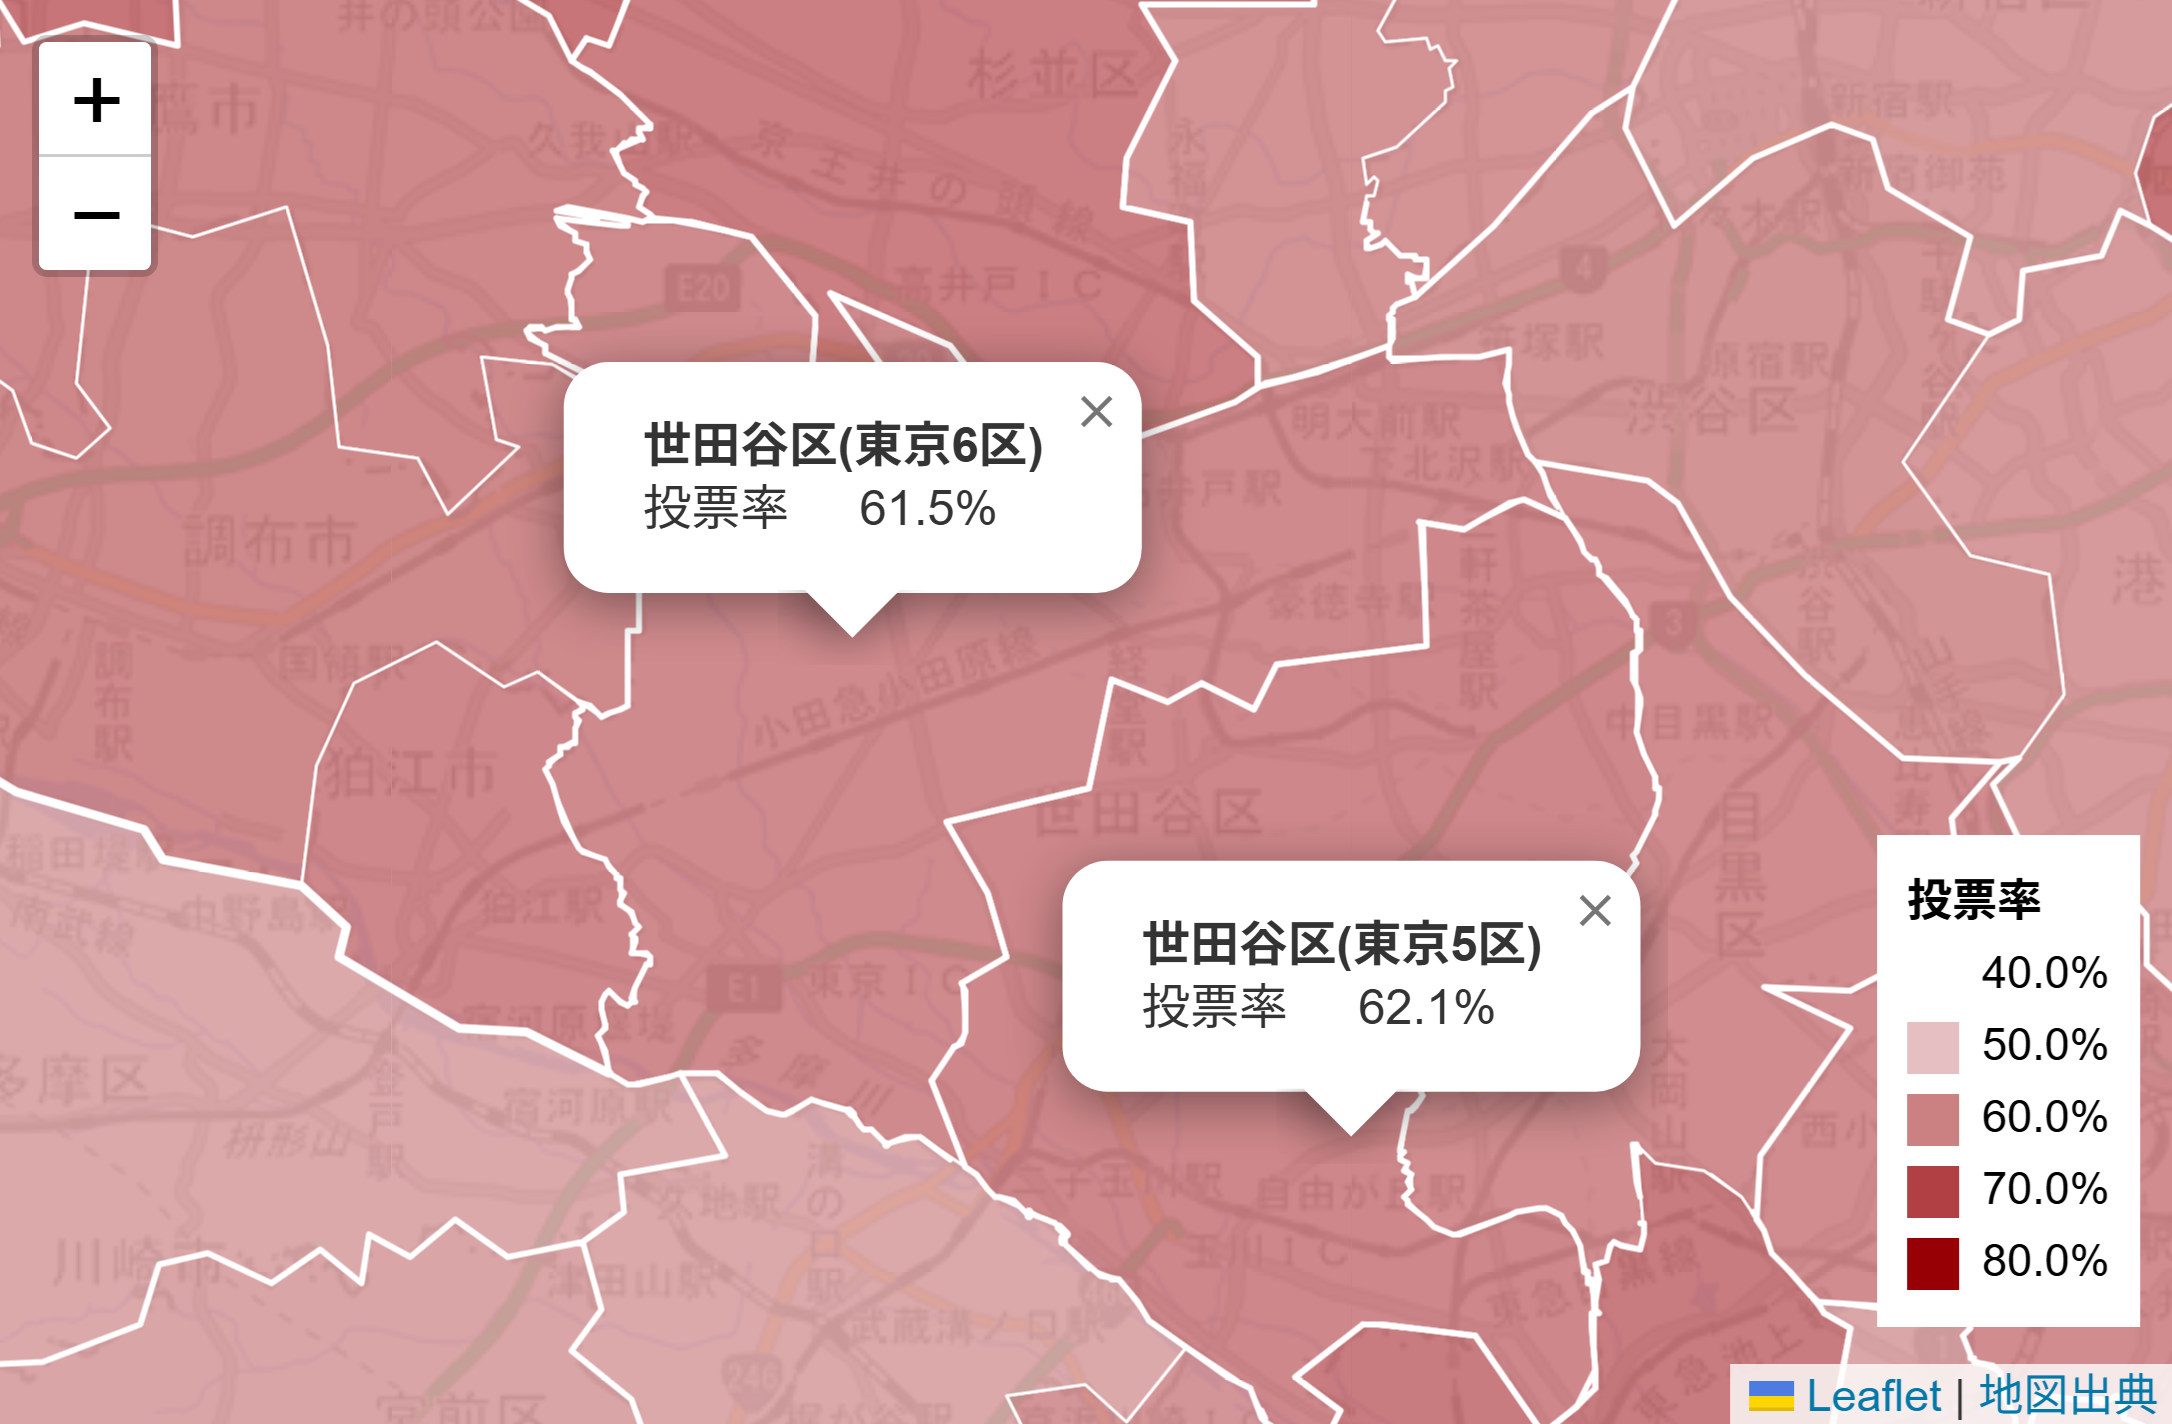
行政区域境界×小選挙区境界データを使うと、大規模市や特別区など、複数の小選挙区に分割された行政区域も小選挙区単位で塗り分けできます。(上記画像)
全国版のファイルは次の通りです。
```text
data/topojson/prefectures.topojson
data/topojson/municipalities.topojson
data/topojson/electoral-districts.topojson
data/topojson/municipality-district-intersections.topojson
data/geojson/prefectures.geojson
data/geojson/municipalities.geojson
data/geojson/electoral-districts.geojson
data/geojson/municipality-district-intersections.geojson
```
都道府県別ファイルは、都道府県コード2桁のディレクトリにあります。
```text
data/topojson/by-prefecture/13/municipalities.topojson
data/topojson/by-prefecture/13/electoral-districts.topojson
data/topojson/by-prefecture/13/municipality-district-intersections.topojson
data/geojson/by-prefecture/13/municipalities.geojson
data/geojson/by-prefecture/13/electoral-districts.geojson
data/geojson/by-prefecture/13/municipality-district-intersections.geojson
```
### Flourish で使う
Flourish でポリゴンデータを使用するには、`data/geojson/` 以下のファイルをアップロードしてください。
1. Flourish で `Projection map (Blank)` を選びます。
2. `Region geometry` タブに GeoJSON ファイルをアップロードします。
3. `Data` タブで GeoJSON の geometry 列を指定します。
4. `Geo region key` に、値データと結合するためのキー列を指定します。
5. 値データ側にも同じキー列を用意します。
[詳細はこちら(Flourish)](https://helpcenter.flourish.studio/hc/en-us/articles/8827954135951-How-to-add-your-own-map-regions)
全国版の市区町村、小選挙区、市区町村×小選挙区はファイルサイズが大きいため、Flourish では都道府県別ファイルの利用を推奨します。キー列には、ポリゴンデータの `id` と同じ値を使います。
## ID と属性
| データ | `id` の例 | 内容 |
| --- | --- | --- |
| 都道府県 | `13` | 都道府県コード2桁 |
| 市区町村 | `13102` | 市区町村コード5桁 |
| 小選挙区 | `1302` | 小選挙区コード4桁 |
| 市区町村×小選挙区 | `131021302` | 市区町村コード5桁 + 小選挙区コード4桁 |
主な属性は次の通りです。
| データ | 主な属性 |
| --- | --- |
| 都道府県 | `name` |
| 市区町村 | `prefecture`, `subPrefecture`, `county`, `municipality`, `ward`, `displayName` |
| 小選挙区 | `prefectureCode`, `districtNumber`, `name` |
| 市区町村×小選挙区 | `municipalityCode`, `municipalityName`, `districtCode`, `districtName` |
市区町村×小選挙区は、自治体と小選挙区の重なりを1 featureにしたものです。分区がある自治体では、同じ市区町村コードに複数の小選挙区コードが対応します。
TopoJSON の object 名は次の通りです。
| ファイル | object 名 |
| --- | --- |
| `prefectures.topojson` | `prefectures` |
| `municipalities.topojson` | `municipalities` |
| `electoral-districts.topojson` | `electoralDistricts` |
| `municipality-district-intersections.topojson` | `municipalityDistrictIntersections` |
## JavaScript でコロプレス地図を作成する
付属の JavaScript をLeafletと同時に用いることで、Web向けのコロプレス地図を作成できます。
### CDN で使う
都道府県別の値を塗り分ける例です。
```html
```
JavaScriptのインポート時に必要な地図だけを指定することで、データ転送量を節約できます。
| データ | CDN bundle | グローバル名 | メソッド名 |
| --- | --- | --- | --- |
| 都道府県 | `dist/prefectures.global.min.js` | `JapanChoroplethPrefectures` | `createPrefectureChoropleth` |
| 市区町村 | `dist/municipalities.global.min.js` | `JapanChoroplethMunicipalities` | `createMunicipalityChoropleth` |
| 小選挙区 | `dist/electoral-districts.global.min.js` | `JapanChoroplethElectoralDistricts` | `createElectoralDistrictChoropleth` |
| 市区町村×小選挙区 | `dist/municipality-district-intersections.global.min.js` | `JapanChoroplethMunicipalityDistrictIntersections` | `createMunicipalityDistrictChoropleth` |
### 入力データ
入力データは `{code: string, value: number}` の配列です。
```ts
[
{ code: "13101", value: 61.2 },
{ code: "13102", value: 58.4 }
]
```
`code` は地図の種類ごとに異なります。
| 地図 | `code` の例 | 内容 |
| --- | --- | --- |
| 都道府県 | `13` | 2桁の都道府県コード |
| 市区町村 | `13102` | 5桁の市区町村コード |
| 小選挙区 | `1302` | 4桁の小選挙区コード |
| 市区町村×小選挙区 | `131021302` | 市区町村コード5桁 + 小選挙区コード4桁 |
### npm で使う
npm から利用する場合は、必要な地図だけを subpath import できます。TypeScriptにも対応しています。
```bash
npm install japan-choropleth leaflet
```
```ts
import { createPrefectureChoropleth } from "japan-choropleth/prefectures";
import { createMunicipalityChoropleth } from "japan-choropleth/municipalities";
import { createElectoralDistrictChoropleth } from "japan-choropleth/electoral-districts";
import { createMunicipalityDistrictChoropleth } from "japan-choropleth/municipality-district-intersections";
```
市区町村別の値を塗り分ける例です。
TopoJSON は、Web から読める場所に置いたうえで `topoJsonBaseUrl` にそのURLを指定します。以下の例では、同梱の `data/topojson/` を公開ディレクトリの `/topojson/` に置いています。
```ts
import "leaflet/dist/leaflet.css";
import * as L from "leaflet";
import { createMunicipalityChoropleth } from "japan-choropleth/municipalities";
const map = L.map("map").setView([36.2, 138.25], 5);
await createMunicipalityChoropleth(
map,
[
{ code: "13101", value: 61.2 },
{ code: "13102", value: 58.4 }
],
{
min: 0,
max: 100,
topoJsonBaseUrl: "/topojson/"
}
);
```
## 表示オプション
既定の色は `0` が白、`100` が `rgb(151,0,5)` です。値がないポリゴンは塗りつぶしません。
| オプション | 内容 |
| --- | --- |
| `min`, `max` | 色を割り当てる値域 |
| `startColor`, `endColor` | グラデーションの両端の色 |
| `legend` | 凡例のタイトル、単位、小数点以下の桁数など |
| `prefCode` | 都道府県別 TopoJSON を読む場合の都道府県コード |
| `topoJsonBaseUrl` | TopoJSON を置いたベースURL |
| `topoJsonUrl` | 読み込む TopoJSON を直接指定 |
| `tileLayer` | 背景地図のタイル設定。`false` で追加しません |
| `popup` | 吹き出しの内容。`false` で表示しません |
```ts
{
min: 40,
max: 80,
legend: {
title: "投票率",
unit: "%",
digits: 1
}
}
```
## サンプル
共同通信集計の、第51回(2026年)衆院選の投票率を使った HTML サンプル兼テンプレートを `examples/` 以下に配置しています。
```text
examples/prefectures.html
examples/municipalities.html
examples/electoral-districts.html
examples/municipality-district-intersections.html
```
## ライセンス
Copyright (c) 2026 一般社団法人共同通信社
JavaScript、TypeScript、ビルドスクリプト、サンプルコードなどのコード部分は MIT ライセンスで提供します。**`data/` 以下のポリゴンデータには MIT ライセンスを適用しません。出典元の利用条件に従ってください。**
## 地図出典
japan-choropleth の地図・ポリゴンデータは、以下を加工して作成しました。
### 行政区域
国土交通省 国土数値情報「[行政区域データ 2025年版](https://nlftp.mlit.go.jp/ksj/gml/datalist/KsjTmplt-N03-2025.html)」([CC-BY 4.0](https://creativecommons.org/licenses/by/4.0/))を加工。**二次利用にあたっては、原著者のクレジット表示などが必要です。**
### 小選挙区
地域・交通データ研究所(西澤明代表)「[衆議院議員選挙・小選挙区の統計データ及び地図データ](https://gtfs-gis.jp/senkyoku/)」(パブリックドメイン)を加工。
### 背景地図(JavaScriptのみ)
国土地理院「[地理院タイル](https://maps.gsi.go.jp/development/siyou.html)」を標準で使用します。背景地図を別のタイルに差し替える場合は、提供元の利用条件に従ってください。