# Homebridge Prometheus Exporter
[](https://github.com/lstrojny/homebridge-prometheus-exporter/actions/workflows/build.yml) [](https://sonarcloud.io/summary/new_code?id=lstrojny_homebridge-prometheus-exporter) [](https://badge.fury.io/js/homebridge-prometheus-exporter)  
> What if we could store homebridge metrics in Prometheus
*homebridge-prometheus-exporter* is a plugin for *homebridge* that provides a metrics endpoint for *Prometheus* to scrape.
Once the metrics are in *Prometheus*, they can be consumed and presented in various ways. One can use *Prometheus
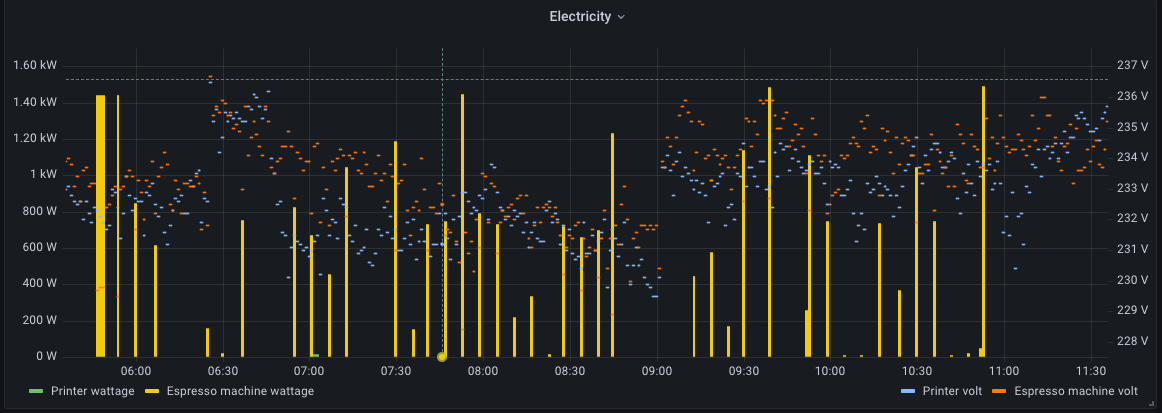
Alerting Rules* to trigger actions on certain thresholds or *Grafana* to build informative graphs or alerts.
## Installing
### Install the plugin
Run this command to install the plugin as a global *nodejs* module:
```shell
npm install -g homebridge-prometheus-exporter
```
### Configure *homebridge*
Edit the *homebridge* `config.json` to load the plugin:
```json lines
{
// …
"platforms": [
{
"platform": "PrometheusExporter",
"pin": "123-12-123",
},
// …
]
}
```
### Customize *homebridge* startup
For *homebridge-prometheus-exporter* to work, *homebridge* has to run in "insecure mode". This means that any user who
has access to your network can control your *homebridge* devices. This is usually not a big problem but it is still
something you should consciously decide. *homebridge-config-ui-x*
[requires running in insecure mode](https://github.com/oznu/homebridge-config-ui-x/wiki/Enabling-Accessory-Control)
if you want to control your devices from *homebridge-config-ui-x*.
To enable "insecure mode", edit the startup script for *homebridge* and add `--insecure` or `-I`. Assuming you run
systemd, the proper way to override the config would be to use *systemd’s* drop-in mechanism.
Create `/etc/systemd/system/homebridge.service.d` folder:
```shell
mkdir /etc/systemd/system/homebridge.service.d
```
Write this drop-in configuration file to `/etc/systemd/system/homebridge.service.d/insecure.conf`:
```ini
[Service]
ExecStart=
ExecStart=/usr/lib/node_modules/homebridge/bin/homebridge --insecure
```
The first and empty `ExecStart` tells *systemd* to forget about the `ExecStart` from the original service definition
and the second `ExecStart` declares the new file. Run `systemctl daemon-reload` to refresh *systemd’s* unit database
and then run `systemd-delta --type=extended` to check if the drop-in worked as expected.
You should see something like this in the output:
```text
…
[EXTENDED] /lib/systemd/system/homebridge.service → /etc/systemd/system/homebridge.service.d/insecure.conf
…
```
If you are not using *systemd*, first of all, you absolutely should but second of all you will likely have some sort
of env file, e.g. `/etc/defaults/homebridge` to customize the *homebridge* start command. Restart *homebridge* using
`systemctl restart homebridge`.
Test that the metrics endpoint is available by accesing `http://homebridge-host:36123/metrics`. You should see a
response similar to this:
```text
# TYPE homebridge_air_purifier_active gauge
homebridge_air_purifier_active{name="…",…} 0 1667914208196
# TYPE homebridge_air_purifier_current_air_purifier_state gauge
homebridge_air_purifier_current_air_purifier_state{name="…",…} 0 1667914208196
```
### Configuring *Prometheus*
With *homebridge-prometheus-exporter* up and running, it is now time to configure *Prometheus* to scrape the config
endpoint. Go to your prometheus host and edit `/etc/prometheus/prometheus.yml` and add the following scrape config:
```yml
scrape_configs:
- job_name: homebridge-exporter
static_configs:
- targets:
- homebridge-host:36123
```
Once *Prometheus* is restarted, metrics with the `homebridge_` prefix should start to be ingested.
### Customize *homebridge-prometheus-exporter*
*homebridge-prometheus-exporter* offers a few advanced settings to customize its behavior.
```json5
{
// ...
"platforms": [
{
"platform": "PrometheusExporter",
// Pin
//
// Homebridge PIN for service authentication
"pin": "",
// Debug
//
// Default: false
"debug": "",
// Metrics prefix
//
// Default: "homebridge"
"prefix": "",
// Metrics server port
//
// TCP port where the Prometheus metrics server listens
//
// Default: 36123
"port": "",
// Metrics server interface
//
// Interface where the Prometheus metrics server listens. Can be an IP, a
// hostname, "0.0.0.0" for all IPv4 interfaces, "::1" for all IPv6 interfaces.
// Default is "::" which means "any interface"
//
// Default: "::"
"interface": "",
// Service refresh interval
//
// Discover new services every seconds
//
// Default: 60
"refresh_interval": "",
// Request timeout
//
// Request timeout when interacting with homebridge instances
//
// Default: 10
"request_timeout": "",
// Service discovery timeout
//
// Discovery timeout after which the current discovery is considered failed
//
// Default: 20
"discovery_timeout": "",
// TLS cert file
//
// Path to TLS certificate file (in PEM format)
"tls_cert_file": "",
// TLS key file
//
// Path to TLS key file
"tls_key_file": "",
// Basic auth username/password pairs
//
// Usernames and passwords for basic auth. Object key is the username, object
// value is the password. Password must be encoded with bcrypt. Example:
// {"joanna": "$2a$12$5/mmmRB28wg9yzaXhee5Iupq3UrFr/qMgAe9LvAxGoY5jLcfVGTUq"}
"basic_auth": "