# flame-chart-js
[](https://www.npmjs.com/package/flame-chart-js)
### Installation
`npm i flame-chart-js`
### Demo
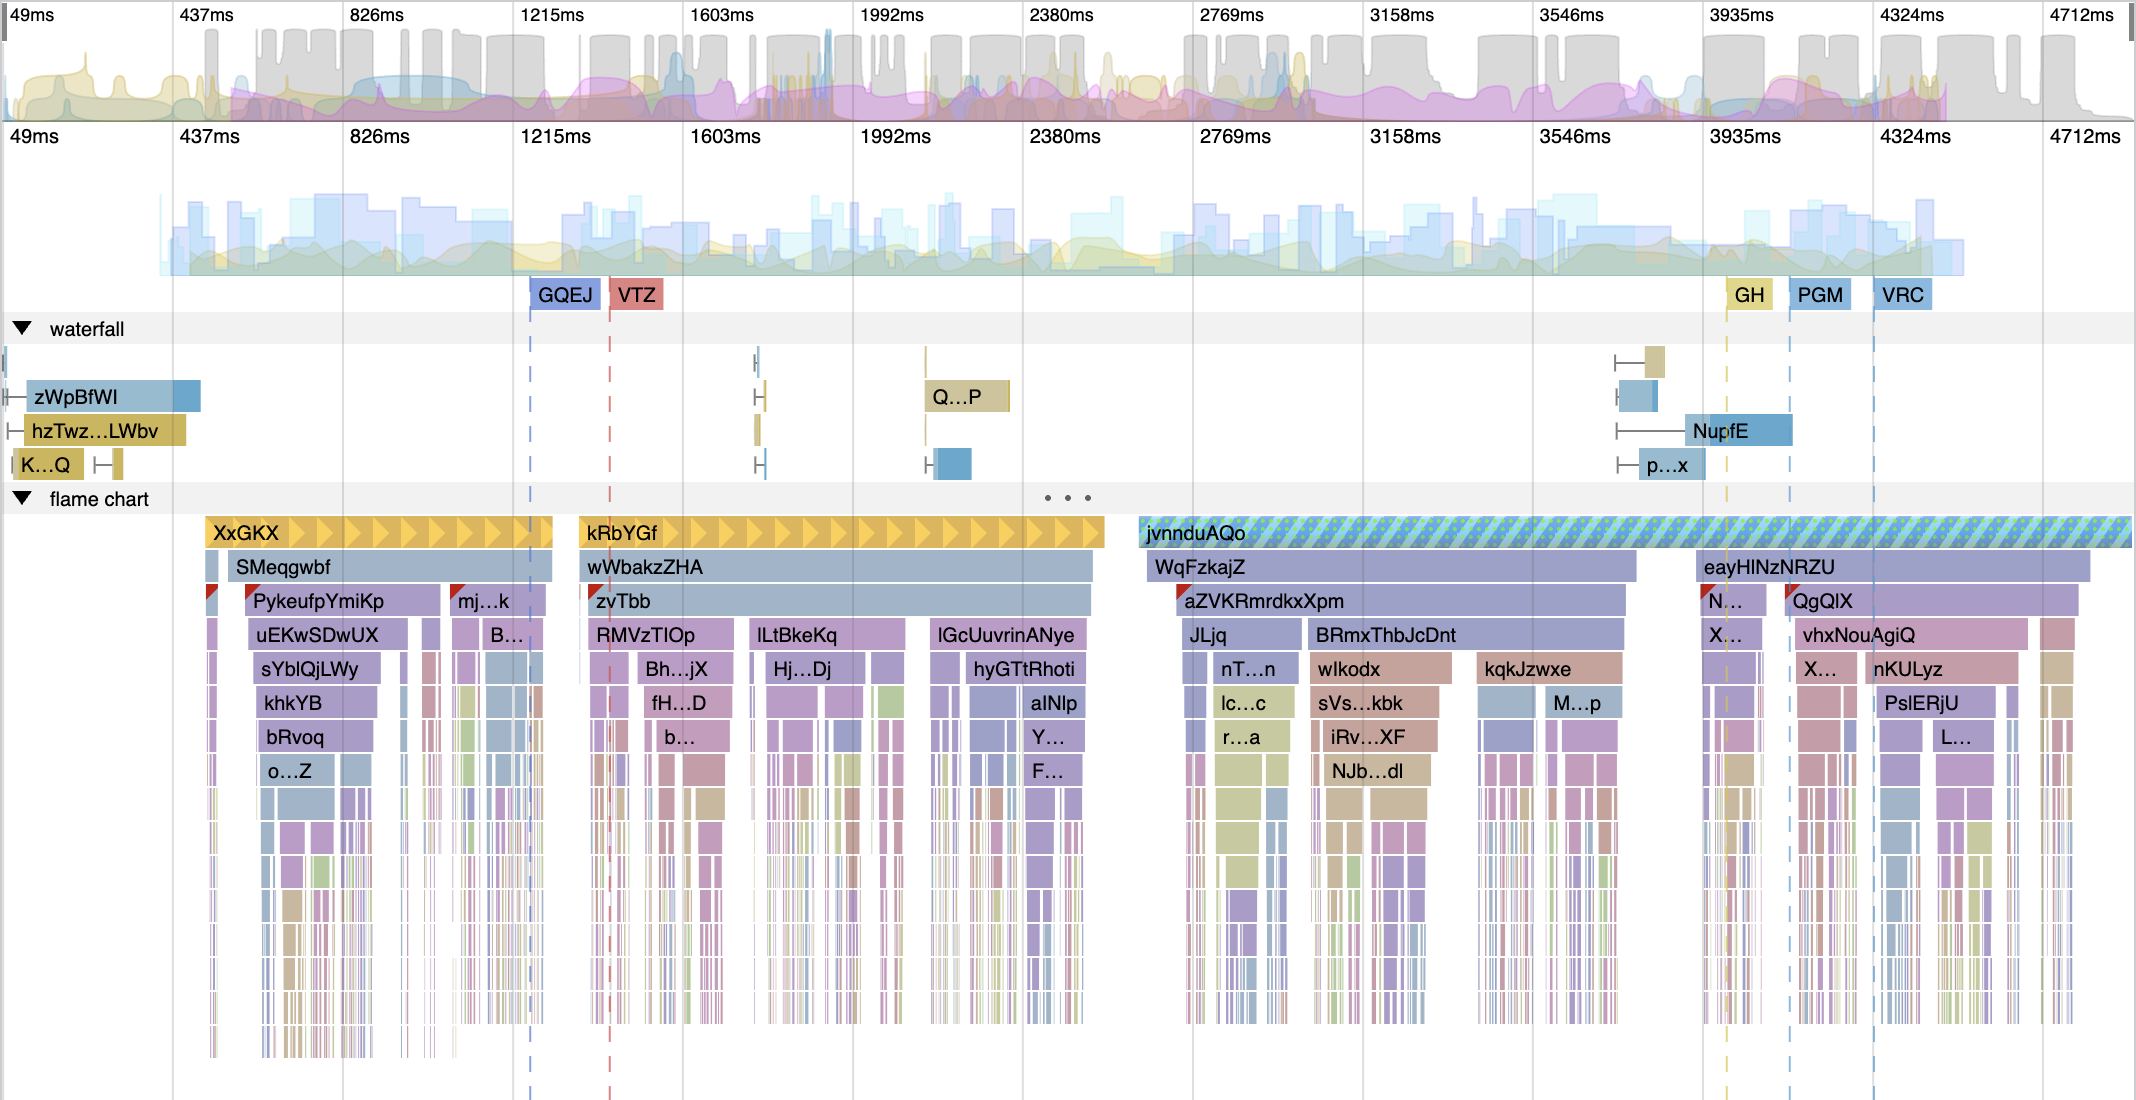
https://pyatyispyatil.github.io/flame-chart-js
### Roadmap
You can find some [plans on the wiki](https://github.com/pyatyispyatil/flame-chart-js/wiki/Roadmap)
### Usage
#### Initialization
You can ignore any of the marks, data, or waterfall arguments to initialize only the items you want. The flame chart will automatically adjust and hide unused plugins.
```js
import { FlameChart } from 'flame-chart-js';
const canvas = document.getElementById('canvas');
canvas.width = 800;
canvas.height = 400;
const flameChart = new FlameChart({
canvas, // mandatory
data: [
{
name: 'foo',
start: 300,
duration: 200,
type: 'task',
children: [
{
name: 'foo',
start: 310,
duration: 50,
type: 'sub-task',
color: '#AA0000',
},
],
},
],
marks: [
{
shortName: 'DCL',
fullName: 'DOMContentLoaded',
timestamp: 500,
},
],
waterfall: {
/* ... */
},
timeseries: [/* ... */],
timeframeTimeseries: [/* ... */],
colors: {
task: '#FFFFFF',
'sub-task': '#000000',
},
settings: {
hotkeys: {
active: true, // enable navigation using arrow keys
scrollSpeed: 0.5, // scroll speed (ArrowLeft, ArrowRight)
zoomSpeed: 0.001, // zoom speed (ArrowUp, ArrowDown, -, +)
fastMultiplayer: 5, // speed multiplier when zooming and scrolling (activated by Shift key)
},
options: {
tooltip: () => {
/*...*/
}, // see section "Custom Tooltip" below
timeUnits: 'ms',
},
styles: customStyles, // see section "Styles" below
},
});
flameChart.on('select', (node, type) => {
/*...*/
});
```
#### Public methods
```ts
class FlameChart {
// set zoom, which start argument is a left bound and end argument is a right bound
setZoom = (start: number, end: number) => boolean
// set only position of the flame-chart
setFlameChartPosition = ({ x: number, y: number }) => void 0
// render all when animationFrame fired
render = () => void 0
// set new data for the flame-chart
setNodes = (nodes: FlameChartNodes) => void 0
// set marks for marks plugin
setMarks = (data: Marks) => void 0
// set chart data for timeseries plugin
setTimeseries = (data: Timeseries) => void 0
// resize canvas
resize = (width: number, height: number) => void 0
// apply new settings, which includes styles or something else
setSettings = (settings: Object) => void 0
// enable/disable navigation using arrow keys
hotkeys = (status: boolean) => void 0
}
```
#### Usage with plugins
```ts
import { FlameChartContainer, TimeGridPlugin, MarksPlugin, FlameChartPlugin } from 'flame-chart-js';
const canvas = document.getElementById('canvas');
canvas.width = 800;
canvas.height = 400;
const flameChart = new FlameChartContainer({
canvas, // mandatory
plugins: [
new TimeGridPlugin({ styles: timeGridPluginStyles }),
new MarksPlugin({ data: marks }),
new FlameChartPlugin({ data: flameChartData1, colors: flameChartColors, name: 'flameChart1' }),
new FlameChartPlugin({ data: flameChartData2, colors: flameChartColors, name: 'flameChart2' }),
],
});
```
#### Usage with React
Default flame chart:
```tsx
import { FlameChartComponent } from 'flame-chart-js/react';
export const DefaultFlameChart = ({
flameChartData,
stylesSettings,
onSelect,
}) => {
const settings = useMemo(
() => ({
styles: stylesSettings,
}),
[stylesSettings],
);
return (
);
};
```
Custom flame chart:
```tsx
import { FlameChartContainerComponent } from 'flame-chart-js/react';
const CustomFlameChart = ({ flameChartData, stylesSettings }) => {
const plugins = useMemo(() => {
return [
new TimeGridPlugin(),
new TogglePlugin('FlameChart 1'),
new FlameChartPlugin({
name: 'flameChart1',
data: flameChartData[0],
}),
new TogglePlugin('FlameChart 2'),
new FlameChartPlugin({
name: 'flameChart2',
data: flameChartData[1],
}),
];
}, [flameChartData]);
const settings = useMemo(
() => ({
styles: stylesSettings,
}),
[stylesSettings],
);
return ;
};
```
#### Settings
##### Patterns
For each span, it is possible to set their display style.
To do this, you need to define these styles using pattern settings.
```ts
const flameChart = new FlameChart({
settings: {
patterns: [
{
name: 'your-pattern-name',
pattern: 'stripes',
config: { /* ... */ }
}
]
}
});
```
Next, you need to specify the name of the created pattern in one of the nodes in data.
```ts
const node = {
name: 'your-node-name',
start: 0,
duration: 100,
type: 'your-node-type',
pattern: 'your-pattern-name',
}
```
or in waterfall interval
```ts
const interval = {
name: 'your-interval-name',
type: 'block',
start: 'your-start-timing-name',
end: 'your-end-timing-name',
pattern: 'your-pattern-name',
}
```
##### Default patterns
###### Stripes
```ts
type StripesPattern = {
type: 'stripes',
name: string, // your pattern name
config: {
color?: string, // color of the stripes
background?: string, // background color
lineWidth?: number, // width of the stripes
spacing?: number, // spacing between stripes
angle?: number, // angle of the stripes (for example: 90 - vertical, 45 - diagonal, 180 - horizontal)
dash: number[], // dash of the stripes (for example: [10, 5] - 10px line, 5px space)
}
}
```
###### Dots
```ts
type DotsPattern = {
type: 'dots',
name: string, // your pattern name
config: {
color?: string; // color of the dots
background?: string; // background color
size?: number; // diameter of the dots
rows?: number; // number of rows
align?: 'center' | 'top' | 'bottom'; // align of the dots
spacing?: number; // spacing between dots
verticalSpicing?: number; // vertical spacing between rows (default = spacing)
horizontalSpicing?: number; // horizontal spacing between dots (default = spacing)
}
}
```
###### Gradient
```ts
type GradientPattern = {
type: 'gradient',
name: string, // your pattern name
config: {
colors: {
offset: number; // offset of the color (from 0 to 1)
color: string // color of the gradient point
}[]
}
}
```
###### Triangles
```ts
type TrianglesPattern = {
type: 'triangles',
name: string, // your pattern name
config: {
color?: string; // color of the triangles
background?: string; // background color
width?: number; // width of the triangles
height?: number; // height of the triangles
align?: 'center' | 'top' | 'bottom'; // align of the triangles
// direction of the triangles (the direction where the vertex of the triangle will face)
direction?: 'top' | 'bottom' | 'left' | 'right' | 'top-left' | 'top-right' | 'bottom-left' | 'bottom-right';
spacing?: number; // spacing between triangles
}
}
```
###### Combined
A combined pattern will allow you to combine several patterns.
For each pattern, you can use transparency using the color or
background config option (`color: 'rgba(75, 25, 10, 0.5)'`) and then
you will get a beautiful layering of layers on top of each other.
```ts
type CombinedPattern = {
type: 'combined',
name: string, // your pattern name
config: Array
}
```
###### Custom
You can also create your own pattern.
```ts
import FlameChart from './flame-chart';
const flameChart = new FlameChart({
settings: {
patterns: [
{
name: 'your-pattern-name',
creator: (engine) => {
const canvas = document.createElement('canvas')!;
const ctx = canvas.getContext('2d')!;
// set canvas size
canvas.width = 20;
canvas.height = engine.blockHeight;
// draw something on canvas
ctx.fillStyle = 'red';
ctx.fillRect(0, 0, 10, 10);
return {
pattern: engine.ctx.createPattern(canvas, 'repeat')!,
}
}
}
]
}
});
```
##### Styles
You can override whatever style you want. For example:
```ts
const flameChart = new FlameChart({
settings: {
styles: {
'main': {
'blockHeight': 20
}
}
}
});
```
After applying this style, the blocks of the flame chart will be 20 pixels high instead of 16 pixels.
To learn more about styles, you can take a look at [the example](https://pyatyispyatil.github.io/flame-chart-js) -
all styles will be available in one of the dropdowns on the left side of the interface.
##### Custom Tooltip
You can override or prevent the tooltip render by defining this within the settings objet.
```ts
const flameChart = new FlameChart({
settings: {
options: {
tooltip: undefined
}
}
});
```
For example:
```ts
// prevent tooltip render
chart.setSettings({ options: { tooltip: false } });
// override tooltip render
chart.setSettings({
options: {
tooltip: (data, renderEngine, mouse) => undefined,
},
});
```
#### [Data types](https://github.com/pyatyispyatil/flame-chart-js/blob/master/src/types.ts#L1)
```ts
type Mark = {
shortName: string;
fullName: string;
timestamp: number;
color: string;
};
type Marks = Array;
type Node = {
name: string; // node name
start: number; // node start time
duration: number; // node duration
type?: string; // node type (use it for custom colorization)
color?: string; // node color (use it for current node colorization)
pattern?: string; // node pattern (use it for customize node view - see section Patterns)
badge?: string; // node badge color (if present, the badge will be displayed in the upper left corner of the node)
children?: Array; // node children (same structure as for node)
};
type Nodes = Array;
type WaterfallItems = Array<{
name: string;
intervals: string | WaterfallInterval; // if you use a string, then the intervals will be taken from the array of intervals
timing: {
[string: key]: number; // The timing name must match the start and end fields within the described intervals
};
}>;
type WaterfallInterval = {
name: string;
color: string;
pattern?: string; // interval pattern (use it for customize interval view - see section Patterns)
type: 'block' | 'line';
start: string; // timing name
end: string; // timing name
// if true, then the interval will be displayed on the timeframe chart,
// if color string, then the interval will be displayed on the timeframe chart with the specified color (same colors will be merged)
timeframeChart: boolean | string;
};
type WaterfallIntervals = {
[string: intervalName]: WaterfallInterval;
};
type Waterfall = {
items: WaterfallItems;
intervals: WaterfallIntervals;
};
type TimeseriesChart = {
points: [number, number][]; // data points to render - the first element of the internal array is the timestamp and the second element is the value of the point
group?: string; // group to calculate common minimum, maximum for multiple charts
units?: string; // points to be used for grouping (if the group field is missing) and for rendering the tooltip (for example '%', 'mb', 'kb/s')
name?: string; // the name will be used to display the tooltip
style?: Partial;
min?: number; // if absent, then min and max will be calculated from points
max?: number; // same
dynamicMinMax?: boolean; // dynamically calculate minimum and maximum based on current zoom level
};
type Timeseries = TimeseriesChart[];
```
#### Updating
```js
flameChart.setData(newData);
flameChart.setMarks(newMarks);
flameChart.setWaterfall(newWaterfall);
flameChart.setTimeseries(newTimeseries);
```
#### Scaling
```js
window.addEventListener('resize', () => {
flameChart.resize(window.innerWidth, window.innerHeight);
});
```
#### Plugins
##### You can create your own plugin
```ts
import { UIPlugin } from 'flame-chart-js';
class MyPlugin extends UIPlugin {
constructor({ name = 'myOwnPlugin' }) {
super(name);
}
height = 100; // height of the plugin in pixels
// this method will be called on each render
override render() {
// do something
this.renderEngine.addRect({ color: 'red', x: 10, y: 10, w: 20 });
}
}
```
## Local Development
```bash
npm i && npm start
```