# dygraphs JavaScript charting library
The dygraphs JavaScript library produces interactive, zoomable charts of time series:
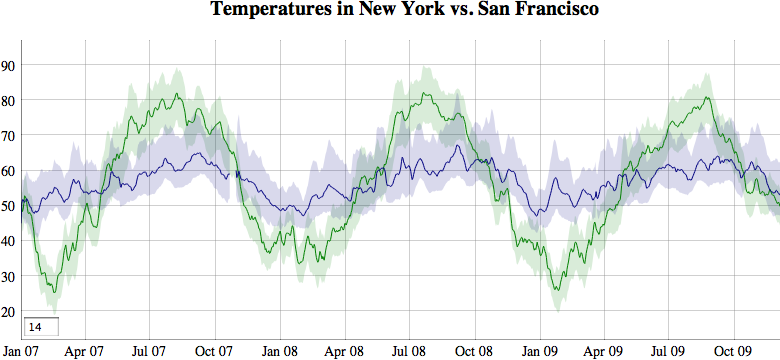
Learn more about it at [dygraphs.com](http://www.dygraphs.com).
Get help with dygraphs on [Stack Overflow][] (preferred) and [Google Groups][].
## Features
* Plots time series without using an external server or Flash
* Supports [error bands][] around data series
* Interactive [pan and zoom][]
* Displays values [on mouseover][]
* Adjustable [averaging period][]
* Extensive set of [options][] for customization.
* Compatible with the [Google Visualization API][gviz]
## Minimal Example
```html
```
Learn more by reading [the tutorial][] and seeing demonstrations of what
dygraphs can do in the [gallery][]. You can get `dygraph.js` and `dygraph.css`
from [UNPKG][], [cdnjs][] or [from NPM][npm] (see below).
## Usage with a module loader
Get dygraphs from NPM:
npm install dygraphs
**Do not install from the git repository!** Always use a tarball install,
which contains the prebuilt files; `npm` fails to build the source code
on install from github. (The tarball from the GitHub Registry is fine.)
You'll find pre-built JS & CSS files in `node_modules/dygraphs/dist/`. If you're
using a module bundler like browserify or webpack, you can import dygraphs:
```js
import Dygraph from 'dygraphs';
// or: const Dygraph = require('dygraphs');
const g = new Dygraph('graphdiv', data, { /* options */ });
```
Check out the [dygraphs-es6 repo][] for a fully-worked example.
## Development
To get going, install the following Debian packages…
- `jq`
- `mksh`
- `pax`
- `python3`
… clone the repo and run:
npm install
npm run build-jsonly
Then open `tests/demo.html` in your browser.
Read more about the dygraphs development process in the [developer guide](/DEVELOP.md).
## License(s)
dygraphs is available under the MIT license, included in [LICENSE.txt](./LICENSE.txt).
[UNPKG]: https://unpkg.com/dygraphs/
[cdnjs]: https://cdnjs.com/libraries/dygraph
[the tutorial]: http://www.dygraphs.com/tutorial.html
[gallery]: http://www.dygraphs.com/gallery
[error bands]: http://dygraphs.com/tests/legend-values.html
[pan and zoom]: http://dygraphs.com/tests/link-interaction.html
[on mouseover]: http://dygraphs.com/tests/legend-values.html
[averaging period]: http://dygraphs.com/tests/temperature-sf-ny.html
[options]: http://www.dygraphs.com/options.html
[Stack Overflow]: https://stackoverflow.com/questions/tagged/dygraphs?sort=votes&pageSize=50
[Google Groups]: http://groups.google.com/group/dygraphs-users
[gviz]: http://dygraphs.com/data.html#datatable
[npm]: https://www.npmjs.com/package/dygraphs
[dygraphs-es6 repo]: https://github.com/danvk/dygraphs-es6