






A [DeepSeek Harness](https://github.com/deepseek-ai/deepseek-harness) (dsh) web GUI plugin that shows **live hardware load** right where you work: a self-contained, dependency-free companion to `btop`. Watch your GPU while your local model thinks, without leaving the chat.
```bash
npx @deepseek-ai/dsh plugin --profile web add dsh-vitals
```
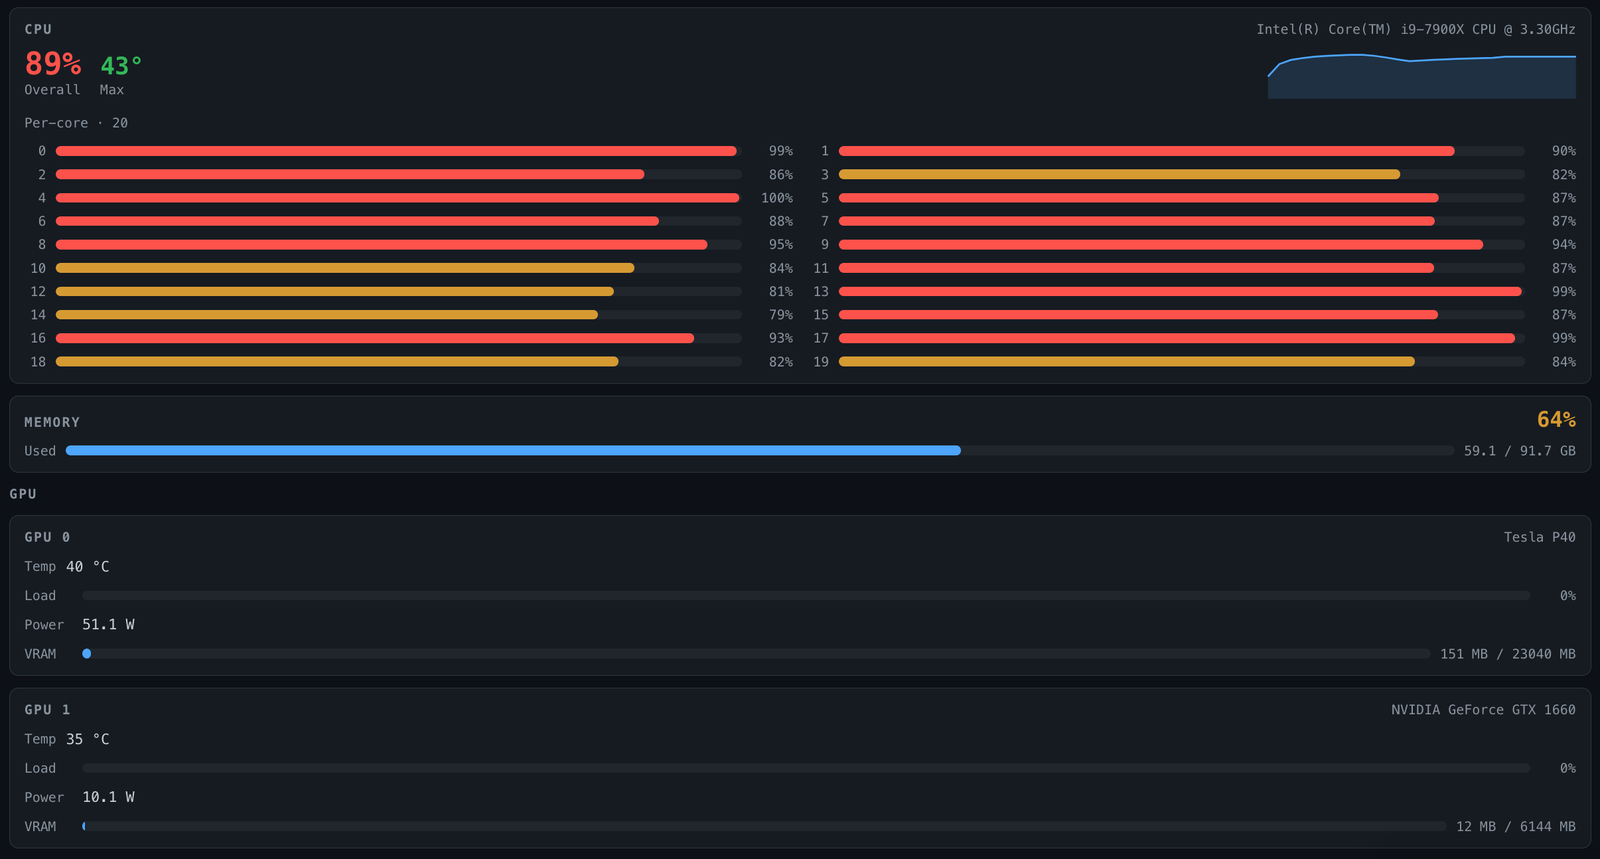
No restart needed (the web profile reloads live). Reload the browser tab: CPU and GPU load appear in the session header, and the full **Hardware** tab sits next to Chat / Trajectory. Full details under [Install](#install).

The mini widget in the session header: always visible while you chat. Click it to jump to the full Hardware tab.
## What it shows
- **CPU** — overall utilisation, a live 60s sparkline, highest temperature reading, and per-core load (every physical core, any count) — with per-thermal-zone detail when there's more than one sensor
- **Memory** — used / available / total with utilisation %
- **GPUs** — one card each: name, temperature, utilisation, power draw, and VRAM (used / total)
Data is sampled host-side on every poll (~0.5 s) and rendered live.
## How it works
- **Host** — a `GET`-only route registered on the dsh web server
(`/plugins/dsh-vitals/data`) that reads the OS's own sources
with **no privileged access** and returns JSON.
- **Client** — a single self-contained bundle that polls the route and draws
the panels with inline styles (no CSS pipeline, no assets).
### Where it shows up
Two access points, both live the moment the plugin is bundled — no setup:
- **A mini widget in the session header**, next to the "⋯" menu: CPU and
per-GPU load as tiny bars, always visible while you chat. Hover for temps
and VRAM; click to jump to the full tab.
- **A full `Hardware` tab** next to **Chat** / **Trajectory** at the top of
the conversation view: per-core CPU, memory, temperatures and every GPU.
### Platform support
Linux, macOS and Windows. Each signal uses the best unprivileged source the OS
offers and hides itself when there is none. Linux is tested live; the macOS and
Windows readers are only checked against sample output (`npm test`) so far.
Reports from real Macs and Windows machines are very welcome.
| Signal | Linux | macOS | Windows |
| ------ | ----- | ----- | ------- |
| CPU load (overall + per core) | `/proc/stat` | `os.cpus()` | `os.cpus()` |
| Memory | `/proc/meminfo` | `vm_stat` (counts cache as available, like Activity Monitor) | `os.freemem()` |
| CPU temperature | `/sys/class/thermal` | hidden (needs root) | WMI thermal zones, when the board exposes them (often needs dsh running as admin) |
| NVIDIA GPUs | `nvidia-smi` | `nvidia-smi` | `nvidia-smi.exe` (PATH or `NVSMI` folder) |
| Apple / other GPUs | — | `ioreg` utilisation + memory in use | — |
Everything degrades gracefully: a missing source hides that panel or shows a
placeholder instead of breaking the tab. Any number of GPUs and any CPU core
count is supported.
## Install
Into your dsh **web profile** (`web` below is the profile name; use whichever
profile backs your web GUI). From a source checkout, use `pnpm dsh` instead of
`npx @deepseek-ai/dsh`:
```bash
npx @deepseek-ai/dsh plugin --profile web add dsh-vitals
```
This installs the package into the profile and adds it to
`dsh.profile.bundles` for you — no manual `package.json` editing. (No local
`dsh` binary? Run the equivalent by hand from the profile directory, e.g.
`~/.dsh/profiles/web/`: `pnpm add dsh-vitals`, then add `"dsh-vitals"` to
that `package.json`'s `dsh.profile.bundles` array yourself.)
The published package ships its built `lib/` output, so no build step runs
on install.
No restart: the shipped `web` profile reloads live, so the plugin shows up under
**Plugins** right away. Reload the browser tab — see
[Where it shows up](#where-it-shows-up) above for how to find it.
## Building from source
Requires Node 20+. Dependencies are dev-only (esbuild); the published package
has **zero runtime npm dependencies**.
```bash
git clone https://github.com/JoblessJoe/dsh-vitals.git
cd dsh-vitals
pnpm install
node scripts/build.mjs # emits lib/index.js + lib/client.js
```
`package.json` declares a `build` script, so `pnpm build` works too.
## Configuration
None. The plugin reads whatever the host exposes; there is no config surface.
## Security
The data route sits outside the dsh web server's `/api` trust fence, so it
enforces that fence itself: `Sec-Fetch-Site: cross-site` requests are rejected
(403) and only `GET`/`HEAD` are served (405 otherwise). All sources are read-only.
## License
MIT
> **中文简介** · DeepSeek Harness (dsh) Web 界面插件:像 btop 一样实时显示硬件负载,无需离开聊天。会话标题栏有迷你小组件,Chat / Trajectory 旁边有完整的 Hardware 标签页:CPU 总负载和每核负载、内存、温度,以及每块 GPU 的温度、负载、功耗和显存。支持 Linux、macOS、Windows,零运行时依赖,无需配置。
安装:`npx @deepseek-ai/dsh plugin --profile web add dsh-vitals`(web 配置实时加载,无需重启)