d3.layout.circleGraph
====================================================
A d3 layout generator for visualizing a graph using a circle of nodes and chords connecting them.
Kind of like [this block](http://bl.ocks.org/sjengle/5432087) by [sjengle](http://bl.ocks.org/sjengle).
 ```bash
bower install d3-layout-circle-graph
```
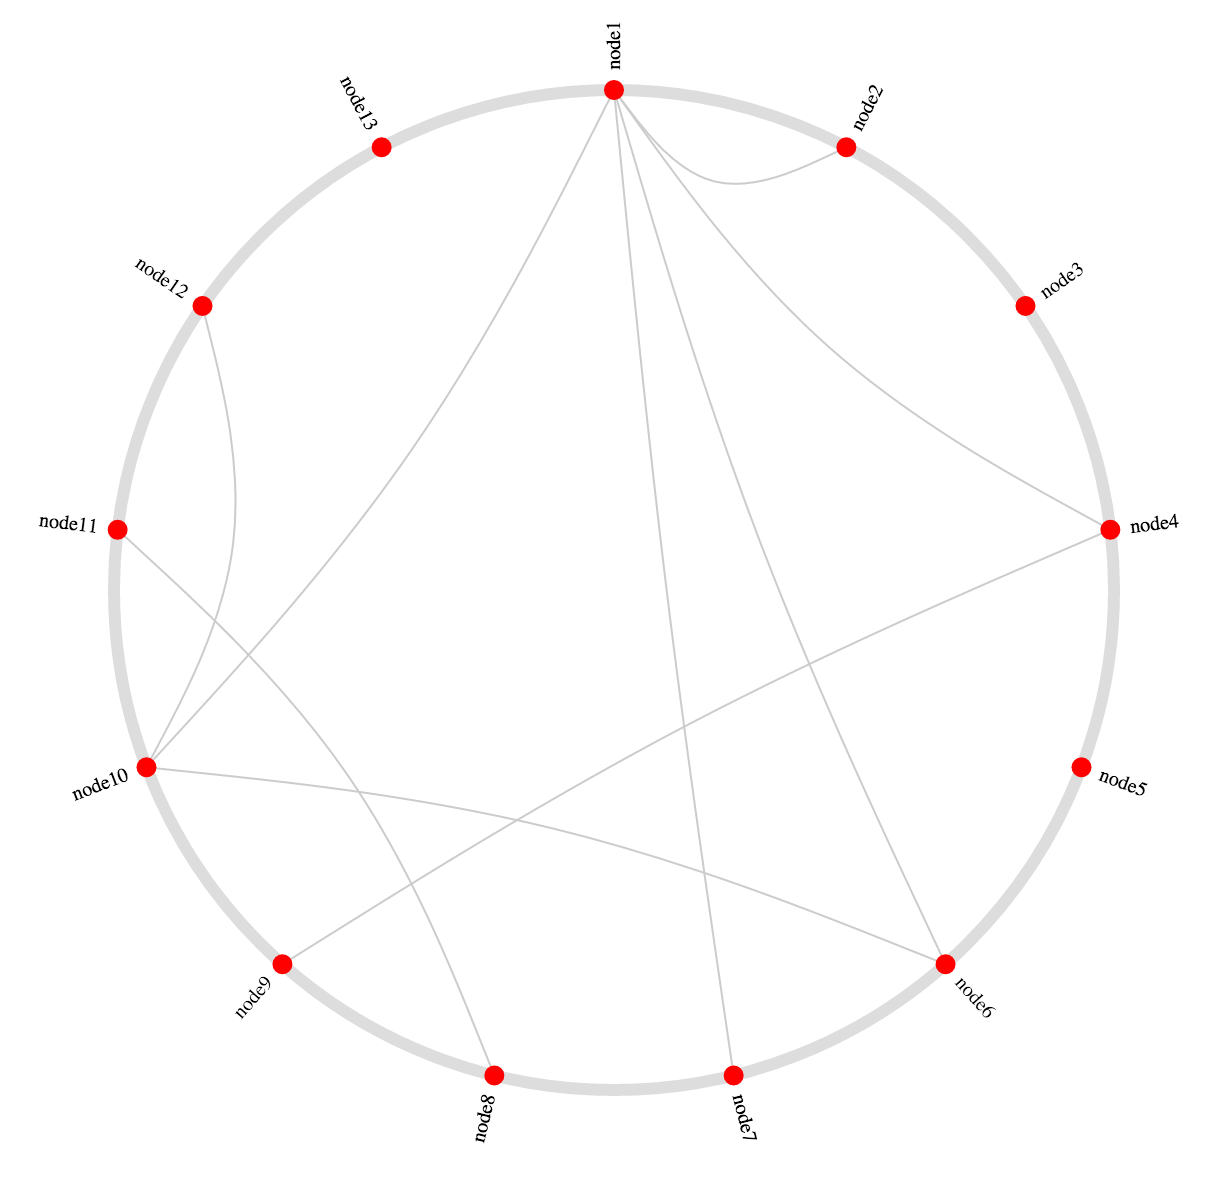
Demo
----------------------------------------------------
The demo that the above screenshot is taken from is located in `demo.html`.
Usage
----------------------------------------------------
First, include `circleGraph.js` in your project, either manually or with bower.
```javascript
var myRadius = 100;
var myNodes = [
{ name: 'node1' },
{ name: 'node2' },
{ name: 'node3' }
];
var myEdges = [
{ source: 'node1', target: 'node2' },
{ source: 'node1', target: 'node3' }
];
var layout = d3.layout.circleGraph()
.radius(myRadius)
.tension(0.3)
.nodes(myNodes)
.edges(myEdges);
```
The node objects will be endowed with `x`, `y`, `radians`, `radianRange`, and `degrees` properties. These can be used to visualize the graph as a circle. Note that 0° is assumed to be 12 o'clock, and increases going clockwise.
### `node.x`, `node.y`
The `x` and `y` coordinates for the center of the node.
### `node.radians`, `node.degrees`
The radians and degrees around the circle that the node resides.
### `node.radianRange`
An array of two radian values that give the "range" of a particular node (good for visualizing bands, etc).
The edge objects will be endowed with a `coords` property, which is an array of three coordinates: the source node point, the center of the circle (as a control point), and the target node point.
API
----------------------------------------------------
### `d3.layout.circleGraph()`
Creates the layout object.
### `circleGraph.radius([Number])`
Sets the radius of the circle.
### `circleGraph.line`
Line function that can be used for drawing chords.
### `circleGraph.tension([Number])`
Sets the tension of the `bundle` line function that is available at `circleGraph.line`. Should be a number between 0 and 1.
### `circleGraph.nodes([nodes])`
Runs the layout on the provided nodes, adding the `x`, `y`, `radians` and `degrees` properties. By default, assumes that there is an identifying property called `name` on each node. To change this behavior, use the `circleGraph.key` function.
### `circleGraph.edges([edges])`
Runs the layout on the provided edges, adding a `coords` array to each edge. By default, this assumes that there are two properties on each edge object: a `source` property and a `target` property. This can be changed with the `circleGraph.edgeSource` and `circleGraph.edgeTarget` methods, respectively.
### `circleGraph.key([fn])`
Sets the accessor function used to identify a node. By default, this function is:
```javascript
function key(node) {
return node.name;
}
```
### `circleGraph.edgeSource([fn])`
Sets the accessor function used to find the source node's identity from an edge object. By default, this function is:
```javascript
function edgeSourceAccessor(edge) {
return edge.source;
}
```
### `circleGraph.edgeTarget([fn])`
Same as `edgeSource`, but for the target. Default is:
```javascript
function edgeTargetAccessor(edge) {
return edge.target;
}
```
### `circleGraph.nodeMap()`
Returns an object that maps identities to nodes. Sometimes useful in client code.
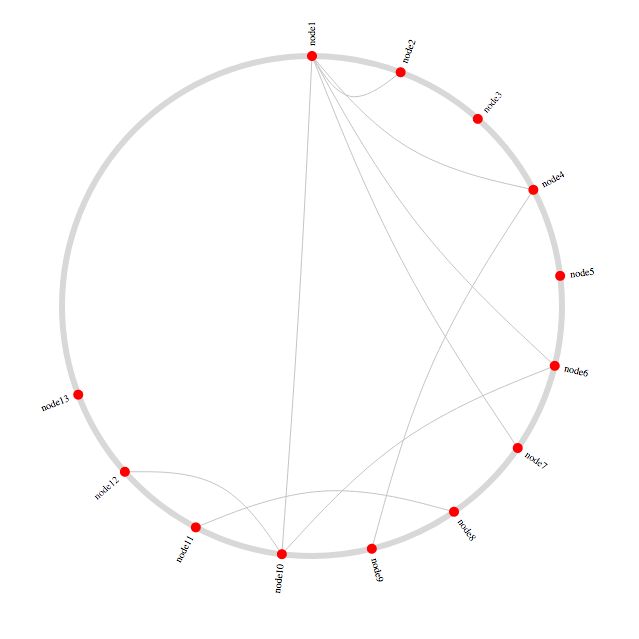
### `circleGraph.range([number])`
Sets or gets the "range" in radians of a complete circle within which the nodes should be evenly distributed. Default is `Math.PI * 2` (which represents the complete circle).
For example, calling `circleGraph.range(Math.PI * 3/2)` on the demo will result in this:
```bash
bower install d3-layout-circle-graph
```
Demo
----------------------------------------------------
The demo that the above screenshot is taken from is located in `demo.html`.
Usage
----------------------------------------------------
First, include `circleGraph.js` in your project, either manually or with bower.
```javascript
var myRadius = 100;
var myNodes = [
{ name: 'node1' },
{ name: 'node2' },
{ name: 'node3' }
];
var myEdges = [
{ source: 'node1', target: 'node2' },
{ source: 'node1', target: 'node3' }
];
var layout = d3.layout.circleGraph()
.radius(myRadius)
.tension(0.3)
.nodes(myNodes)
.edges(myEdges);
```
The node objects will be endowed with `x`, `y`, `radians`, `radianRange`, and `degrees` properties. These can be used to visualize the graph as a circle. Note that 0° is assumed to be 12 o'clock, and increases going clockwise.
### `node.x`, `node.y`
The `x` and `y` coordinates for the center of the node.
### `node.radians`, `node.degrees`
The radians and degrees around the circle that the node resides.
### `node.radianRange`
An array of two radian values that give the "range" of a particular node (good for visualizing bands, etc).
The edge objects will be endowed with a `coords` property, which is an array of three coordinates: the source node point, the center of the circle (as a control point), and the target node point.
API
----------------------------------------------------
### `d3.layout.circleGraph()`
Creates the layout object.
### `circleGraph.radius([Number])`
Sets the radius of the circle.
### `circleGraph.line`
Line function that can be used for drawing chords.
### `circleGraph.tension([Number])`
Sets the tension of the `bundle` line function that is available at `circleGraph.line`. Should be a number between 0 and 1.
### `circleGraph.nodes([nodes])`
Runs the layout on the provided nodes, adding the `x`, `y`, `radians` and `degrees` properties. By default, assumes that there is an identifying property called `name` on each node. To change this behavior, use the `circleGraph.key` function.
### `circleGraph.edges([edges])`
Runs the layout on the provided edges, adding a `coords` array to each edge. By default, this assumes that there are two properties on each edge object: a `source` property and a `target` property. This can be changed with the `circleGraph.edgeSource` and `circleGraph.edgeTarget` methods, respectively.
### `circleGraph.key([fn])`
Sets the accessor function used to identify a node. By default, this function is:
```javascript
function key(node) {
return node.name;
}
```
### `circleGraph.edgeSource([fn])`
Sets the accessor function used to find the source node's identity from an edge object. By default, this function is:
```javascript
function edgeSourceAccessor(edge) {
return edge.source;
}
```
### `circleGraph.edgeTarget([fn])`
Same as `edgeSource`, but for the target. Default is:
```javascript
function edgeTargetAccessor(edge) {
return edge.target;
}
```
### `circleGraph.nodeMap()`
Returns an object that maps identities to nodes. Sometimes useful in client code.
### `circleGraph.range([number])`
Sets or gets the "range" in radians of a complete circle within which the nodes should be evenly distributed. Default is `Math.PI * 2` (which represents the complete circle).
For example, calling `circleGraph.range(Math.PI * 3/2)` on the demo will result in this:
 > **WARNING:** This must be called _before_ `.nodes()` gets called.