# Circos [](https://circleci.com/gh/nicgirault/circosJS) [](https://coveralls.io/github/nicgirault/circosJS?branch=master)
Demo: [nicgirault.github.io/circosJS/demo](https://nicgirault.github.io/circosJS/demo)
## table of contents
- [Introduction](#introduction)
- [Installation](#installation)
- [Layout](#layout)
- [Tracks](#tracks)
- [Chords](#chords)
- [Heatmap](#heatmap)
- [Highlight](#highlight)
- [Histogram](#histogram)
- [Line](#line)
- [Scatter](#scatter)
- [Stack](#stack)
- [Text](#text)
- [Configuration Attributes](#configurationAttributes)
- [innerRadius](#innerRadiusOuterRadius)
- [outerRadius](#innerRadiusOuterRadius)
- [min](#minmax)
- [max](#minmax)
- [color](#color)
- [axes](#axes)
- [showAxesTooltip](#showAxesTooltip)
## Introduction
Circos is a javascript library to easily build interactive graphs in a circular layout. It's based on [d3.js](https://d3js.org/). It aims to be a javascript version of the [Circos](http://circos.ca) software.
You should consider using Circos to show:
- relationships between entities
- periodical data
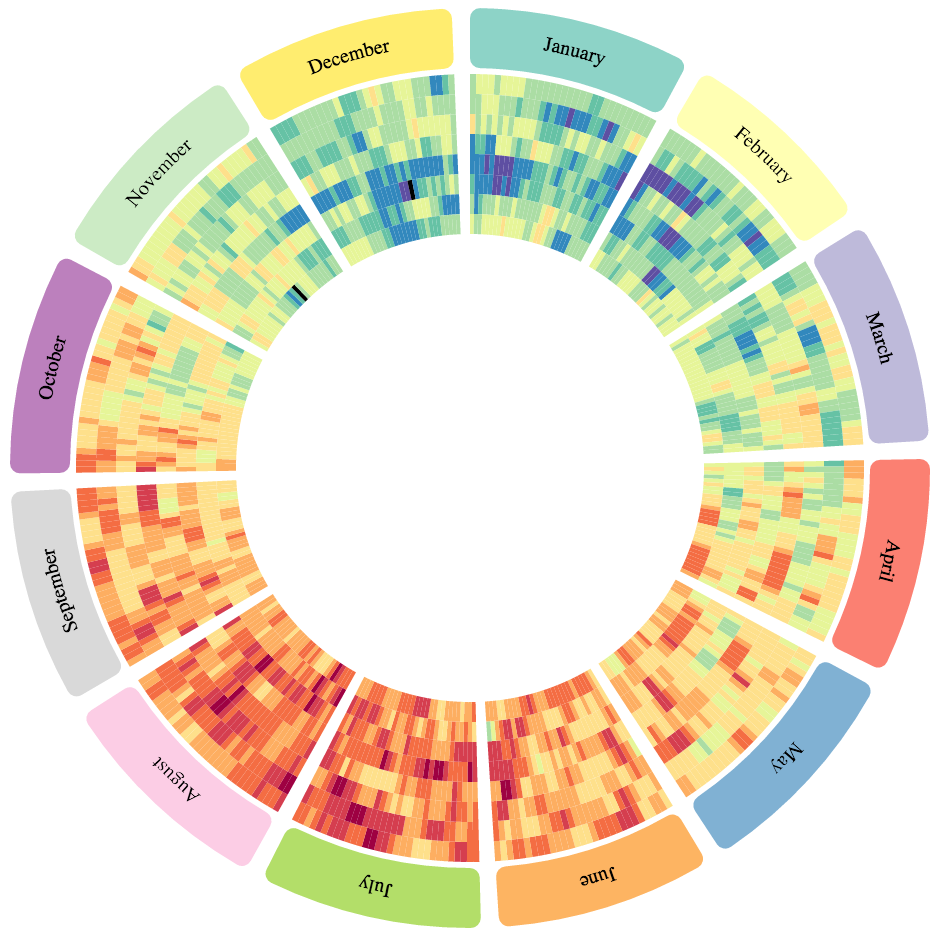
Average temperatures in Paris from 2007 (inner) to 2014 (outer). The circular layout highlights seasonal effect.
## Installation
If you don't know what is npm you can skip this step and get started with [this canvas](doc/canvas.html). Otherwise:
```
npm install --save circos
```
## Layout
To instantiate a new circos:
```javascript
var myCircos = new Circos({
container: '#chart',
width: 500,
height: 500,
});
```
A circos graph is based on a circular axis **layout**. Data tracks appear inside and/or outside the circular layout.
In order to place data on the circos graph, you must first specify the layout.
```javascript
myCircos.layout(data, configuration);
```
The first argument of the `layout` function is a configuration object that control the format of the layout.
Here are the default parameters for a layout:
```javascript
var configuration = {
innerRadius: 250,
outerRadius: 300,
cornerRadius: 10,
gap: 0.04, // in radian
labels: {
display: true,
position: 'center',
size: '14px',
color: '#000000',
radialOffset: 20,
},
ticks: {
display: true,
color: 'grey',
spacing: 10000000,
labels: true,
labelSpacing: 10,
labelSuffix: 'Mb',
labelDenominator: 1000000,
labelDisplay0: true,
labelSize: '10px',
labelColor: '#000000',
labelFont: 'default',
majorSpacing: 5,
size: {
minor: 2,
major: 5,
}
},
events: {}
}
```
The second argument of the `layout` function is an array of data that describe the layout regions. Each layout region must have an id and a length. You can also specify a color and a label.
```javascript
var data = [
{ len: 31, color: "#8dd3c7", label: "January", id: "january" },
{ len: 28, color: "#ffffb3", label: "February", id: "february" },
{ len: 31, color: "#bebada", label: "March", id: "march" },
{ len: 30, color: "#fb8072", label: "April", id: "april" },
{ len: 31, color: "#80b1d3", label: "May", id: "may" },
{ len: 30, color: "#fdb462", label: "June", id: "june" },
{ len: 31, color: "#b3de69", label: "July", id: "july" },
{ len: 31, color: "#fccde5", label: "August", id: "august" },
{ len: 30, color: "#d9d9d9", label: "September", id: "september" },
{ len: 31, color: "#bc80bd", label: "October", id: "october" },
{ len: 30, color: "#ccebc5", label: "November", id: "november" },
{ len: 31, color: "#ffed6f", label: "December", id: "december" }
]
```
The `id` parameter will be used to place data points on the layout.
To visualize the result:
```javascript
myCircos.render();
```
## Tracks
A track is a series of data points.
To add a track to your graph you should write something like this:
```javascript
myCircos.heatmap(
'my-heatmap',
data,
{
// your heatmap configuration (optional)
},
);
```
This pattern is similar to all track types:
```javascript
myCircos.trackType('track-id', data, configuration);
```
**Note**: The track name is used as a HTML class name so here are the format limitations.
* Must be unique.
* Should be slug style for simplicity, consistency and compatibility. Example: `my-heatmap`
* Lowercase, a-z, can contain digits, 0-9, can contain dash or dot but not start/end with them.
* Consecutive dashes or dots not allowed.
* 50 characters or less.
### Chords
Chords tracks connect layout regions.
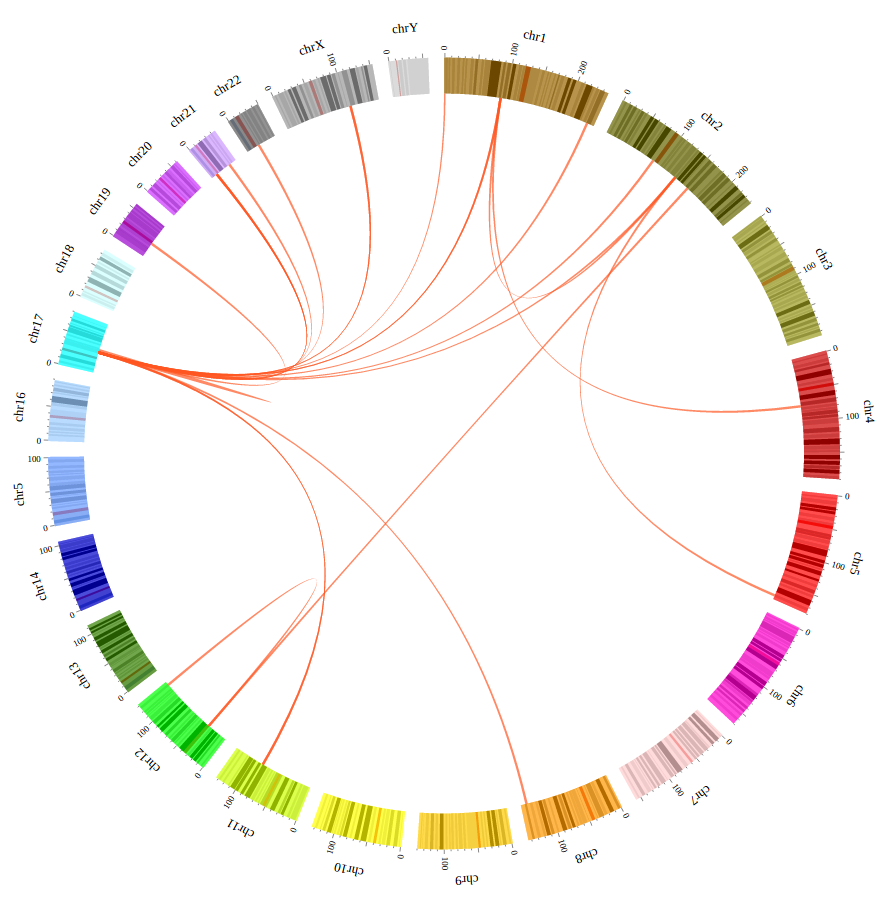
Some gene fusions in human karyotype (source)
Data should looks like this:
```javascript
var data = [
[
source: {
id: 'january',
start: 1,
end: 12
},
target: {
id: 'april',
start: 18,
end: 20
}
],
[
source: {
id: 'february',
start: 20,
end: 28
},
target: {
id: 'december',
start: 1,
end: 13
}
],
...
];
```
Optionally each datum can define a `value` attribute to draw colored ribbons with palettes or a color function.
The available configuration fields are:
- [color](#color)
- [events](#events)
- [opacity](#opacity)
- [zIndex](#zIndex)
- [tooltipContent](#tooltipContent)
- [min](#minmax)
- [max](#minmax)
- [radius](#radius)
- [logScale](#logScale)
- [logScaleBase](#logScaleBase)
### Heatmap
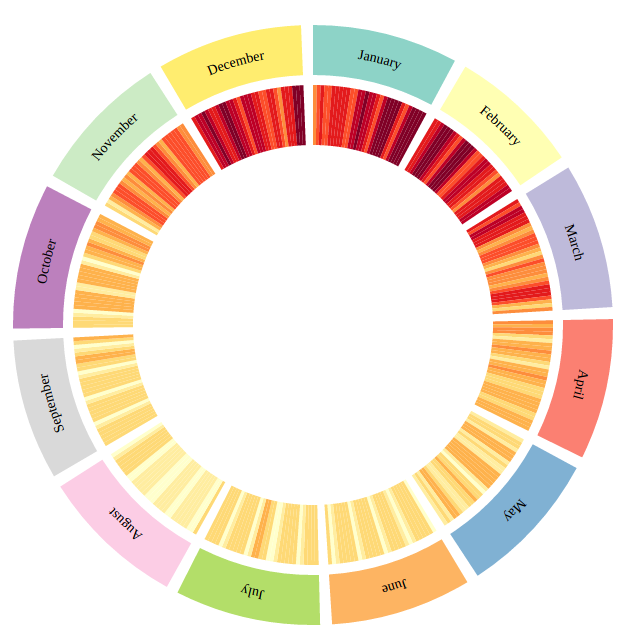
Electrical comsumption in France in 2014
To add a heatmap to your circos instance:
```javascript
myCircos.heatmap('electrical-consumption', data, configuration);
```
Configuration:
```javascript
{
innerRadius: null,
outerRadius: null,
min: null,
max: null,
color: 'YlGnBu',
logScale: false,
tooltipContent: null,
events: {}
}
```
Data format:
```javascript
var data = [
{
block_id: 'january',
start: 0,
end: 1,
value: 1368001
},
{
block_id: 'january',
start: 1,
end: 2,
value: 1458583
},
...
]
```
### Highlight
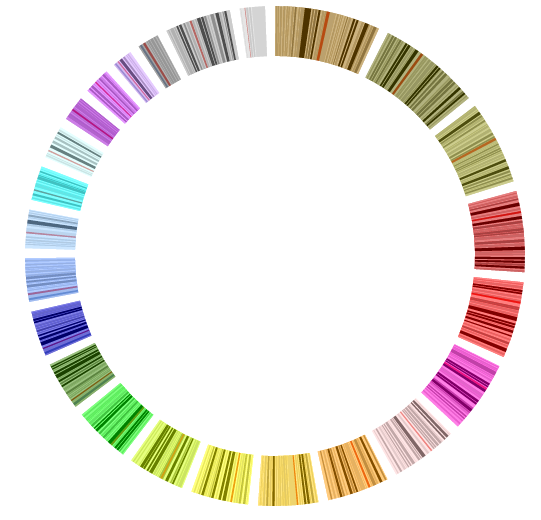
Human karyotype with cytobands highlighted (source)
To add a highlight to your circos instance:
```javascript
myCircos.highlight('cytobands', data, configuration);
```
The minimal datum should have `block_id`, `start` and `end` attributes.
Configuration:
```javascript
{
innerRadius: null,
outerRadius: null,
min: null,
max: null,
color: 'd3d3d3',
strokeColor: null,
strokeWidth: 0,
opacity: 1,
logScale: false,
tooltipContent: null,
events: {}
}
```
### Histogram
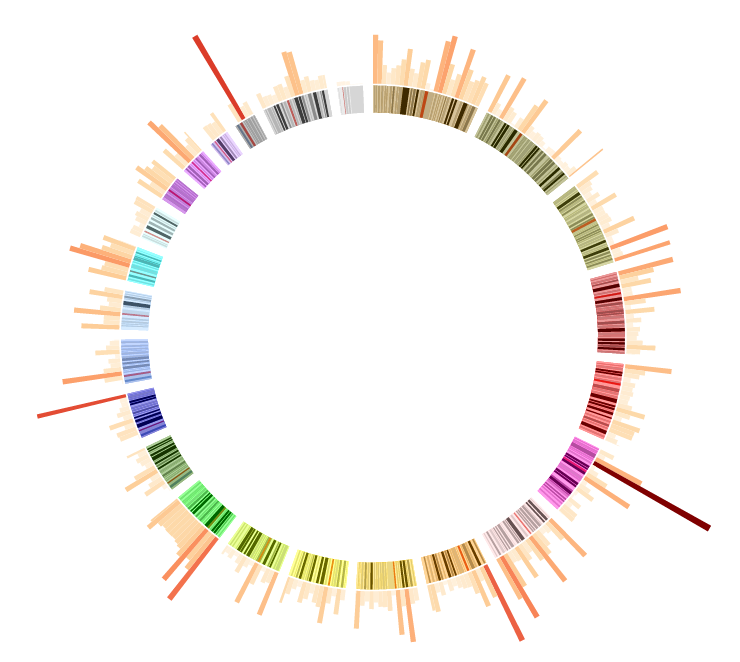
Genetic abnormalities in human stem cells (source)
Data should looks like this:
```javascript
var data = [
{
block_id: 'january',
start: 1,
end: 10,
value: 5
}
];
```
The available configuration fields are:
- [innerRadius](#innerRadiusOuterRadius)
- [outerRadius](#innerRadiusOuterRadius)
- [color](#color)
- [opacity](#opacity)
- [zIndex](#zIndex)
- [tooltipContent](#tooltipContent)
- [min](#minmax)
- [max](#minmax)
- [logScale](#logScale)
- [logScaleBase](#logScaleBase)
- [axes](#axes)
- [events](#events)
### Line
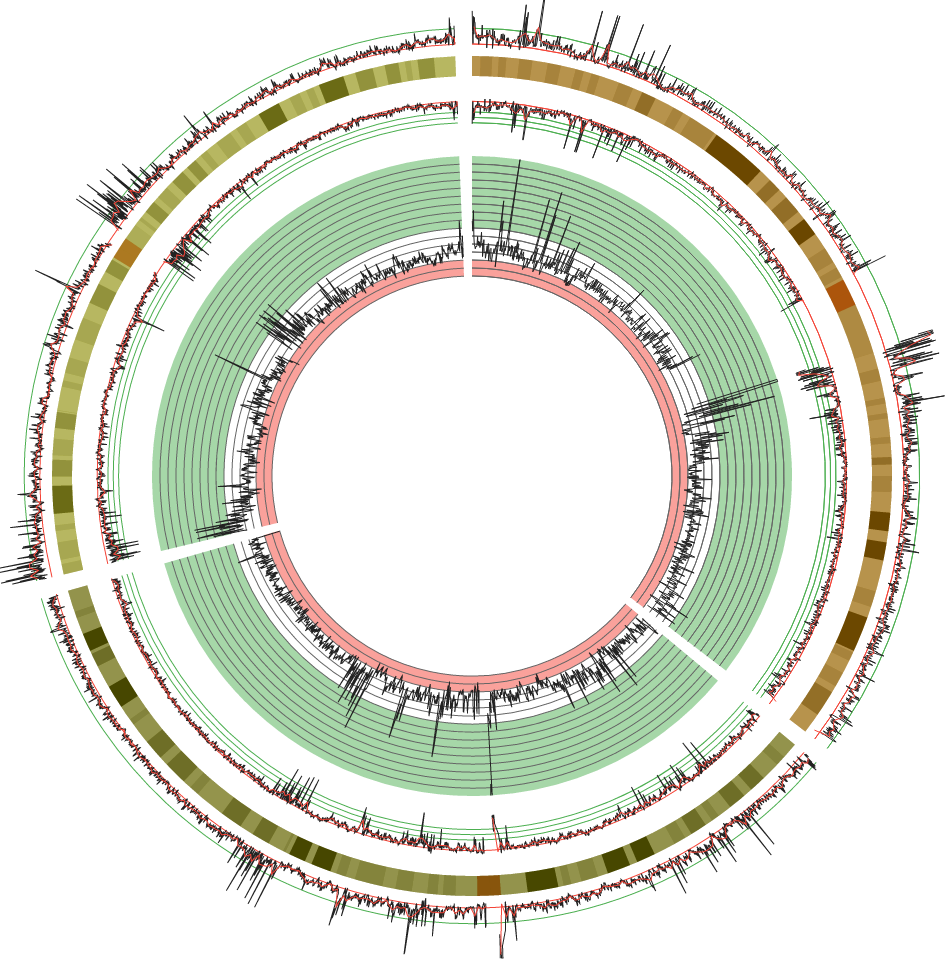
Some single nucleotide polymorphism on chromosomes 1, 2 and 3 (source)
```javascript
myCircos.line('line1', data, configuration);
```
The minimal datum should have `block_id`, `position` and `value` attributes (see above tracks for more details).
The available configuration fields are:
- [innerRadius](#innerRadiusOuterRadius)
- [outerRadius](#innerRadiusOuterRadius)
- [color](#color)
- [strokeColor](#strokeColor)
- [strokeWidth](#strokeWidth)
- [direction](#direction)
- [fill](#fill)
- [fillColor](#fillColor)
- [maxGap](#maxGap)
- [opacity](#opacity)
- [zIndex](#zIndex)
- [min](#minmax)
- [max](#minmax)
- [logScale](#logScale)
- [logScaleBase](#logScaleBase)
- [axes](#axes)
- [backgrounds](#backgrounds)
- [events](#events)
**Note**: The tooltip option is not available for line track. To display a tooltip, you should superimpose an invisble `scatter` track (`fill: false` and `strokeWidth: 0`) and set a tooltip for this track.
### Scatter
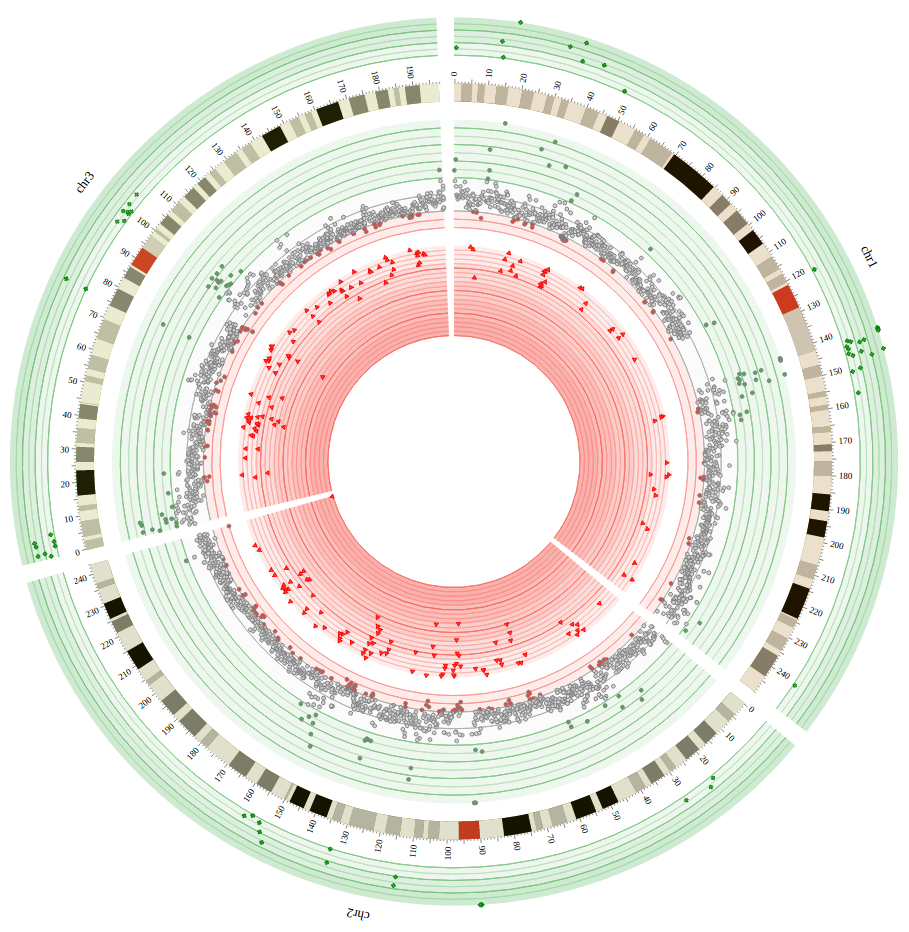
source
```javascript
myCircos.scatter('scatter1', data, configuration);
```
The minimal datum should have `block_id`, `position` and `value` attributes (see above tracks for more details).
The available configuration fields are:
- [innerRadius](#innerRadiusOuterRadius)
- [outerRadius](#innerRadiusOuterRadius)
- [color](#color)
- [strokeColor](#strokeColor)
- [strokeWidth](#strokeWidth)
- [direction](#direction)
- [fill](#fill)
- [size](#size)
- [shape](#shape)
- [opacity](#opacity)
- [zIndex](#zIndex)
- [min](#minmax)
- [max](#minmax)
- [logScale](#logScale)
- [logScaleBase](#logScaleBase)
- [axes](#axes)
- [backgrounds](#backgrounds)
- [events](#events)
### Stack
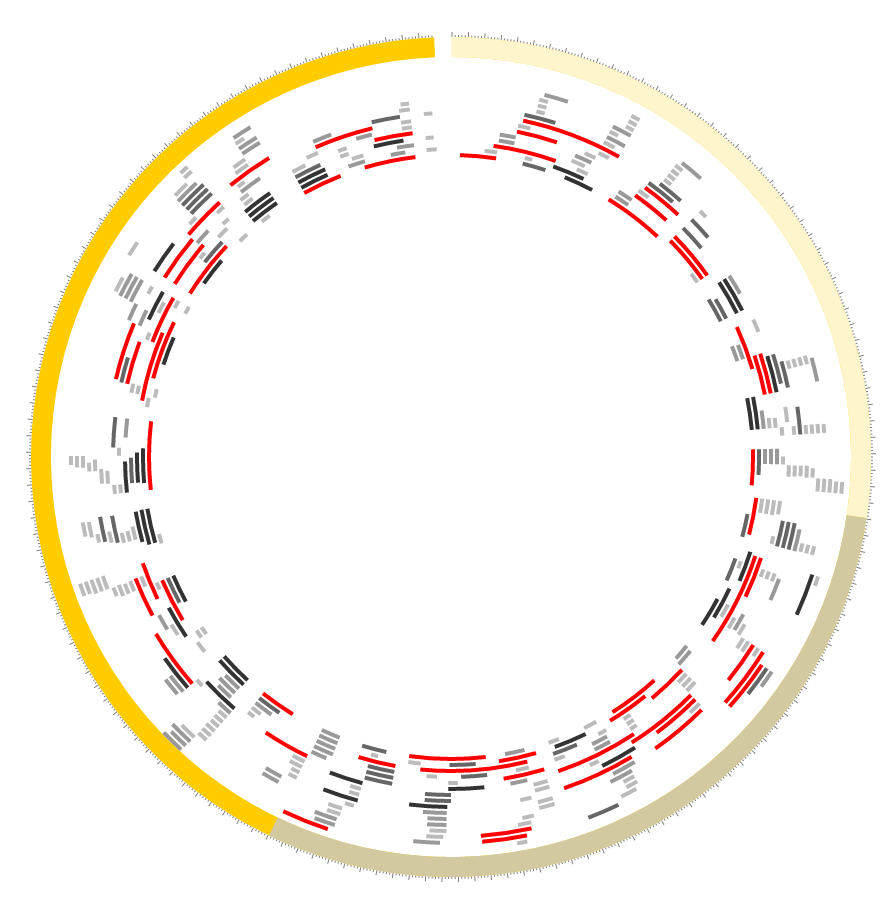
source
```javascript
myCircos.stack('stack', data, configuration);
```
The minimal datum should have `block_id`, `start` and `end` attributes (see above tracks for more details).
Configuration:
```javascript
{
innerRadius: null,
outerRadius: null,
min: null,
max: null,
color: '#fd6a62',
strokeColor: '#d3d3d3',
strokeWidth: 1,
direction: 'out',
thickness: 10,
radialMargin: 2,
margin: 2,
opacity: 1,
logScale: false,
tooltipContent: null,
events: {}
}
```
### Text
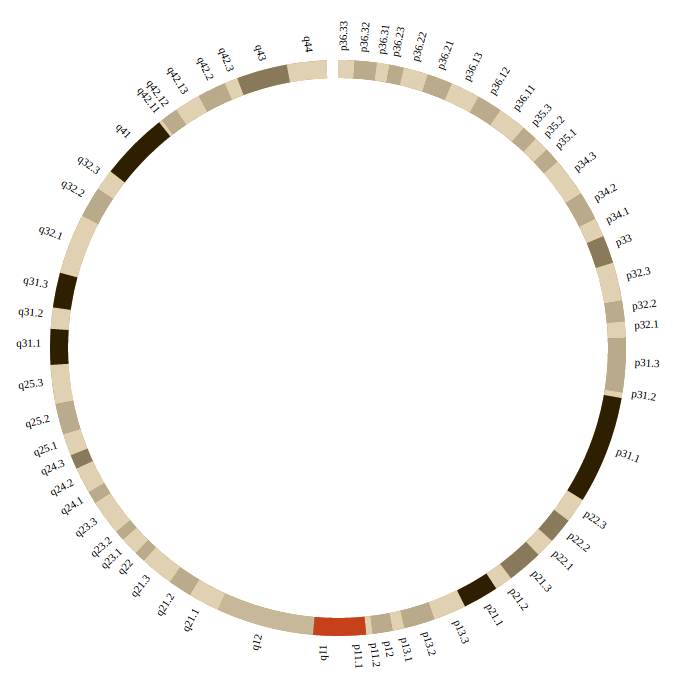
source
```javascript
myCircos.text('text', data, configuration);
```
The minimal datum should have `block_id`, `position` and `value` attributes (see above tracks for more details).
Configuration:
```javascript
{
innerRadius: null,
outerRadius: null,
style: {
'font-size': 12,
fill: 'black',
opacity: 1,
},
events: {}
}
```
## Configuration Attributes
### backgrounds
You can add a list of backgrounds:
```javascript
{
backgrounds: [
{
start: 0.006,
color: '#4caf50',
opacity: 0.1
},
{
start: 0.002,
end: 0.006,
color: '#d3d3d3',
opacity: 0.1
},
{
end: 0.002,
color: '#f44336',
opacity: 0.1
}
]
}
```
The `start` and `end` fields are interpreted as values on the same scale than the track values.
- If `start` is not specified, default is the `min` value of the track.
- If `end` is not specified, default is the `max` value of the track.
You can also specify a `color` and an `opacity`.
### events
All tracks and the layout configurations can receive an events attribute. This attribute must be an object where keys are event names and values are event callbacks. For example:
```javascript
{
events: {
'click.alert': function (datum, index, nodes, event) {
window.alert(datum)
}
}
}
```
The documentation about d3 events is [here](https://github.com/d3/d3-selection/blob/master/README.md#selection_on). You can add all events described in this documentation. I recommend using event namespaces (`click.alert` instead of `click`) to avoid possible conflicts with internal circosjs events.
### innerRadius/outerRadius
For the layout, the innerRadius and outerRadius values are always interpreted as a number of pixel.
For tracks:
If innerRadius and outerRadius are between `0` and `1`, the value is interpreted as a fraction of the innerRadius of the layout.
eg:
```
{
innerRadius: 0.5,
outerRadius: 0.8
}
```
If innerRadius and outerRadius are between `1` and `10`, the value is interpreted as a fraction of the outerRadius of the layout.
eg:
```
{
innerRadius: 1,
outerRadius: 1.2
}
```
Otherwise it is interpreted as a number of pixels.
### min/max
The default min and max values are computed according to the dataset. You can override these values by specifying a `min` or `max` attribute in the configuration.
### color
The color attribute can be either:
#### CSS color code
e.g `#d3d3d3`, `blue`, `rgb(0, 0, 0)`
#### Palette name from [d3-scale-chromatic](https://github.com/d3/d3-scale-chromatic)
The color will be computed dynamically according to the track data `value` field.
If you prefix the palette name with a `-` (e.g `-BrBG`), the palette will be reversed.
The list of palette names are:
**BrBG**:
 **PRGn**:
 **PiYG**:
 **PuOr**:
 **RdBu**:
 **RdGy**:
 **RdYlBu**:
 **RdYlGn**:
 **Spectral**:
 **Blues**:
 **Greens**:
 **Greys**:
 **Oranges**:
 **Purples**:
 **Reds**:
 **BuGn**:
 **BuPu**:
 **GnBu**:
 **OrRd**:
 **PuBuGn**:
 **PuBu**:
 **PuRd**:
 **RdPu**:
 **YlGnBu**:
 **YlGn**:
 **YlOrBr**:
 **YlOrRd**:
 #### Custom function
You can specify a function that compute the color code given the track data and the datum index. For example:
```javascript
{
color: function(datum, index) {
return datum.value < 5 ? 'red' : 'green'
}
}
```
### axes
The default value is an empty array:
```javascript
{
axes: []
}
```
You can add items to this array to render an axis or a group of axes. You can give axes a `color` (default: '#d3d3d3'), `thickness` (default: 1) and `opacity` (default: track opacity):
```javascript
{
axes: [
{
color: 'black',
thickness: 2, // in pixel
opacity: 0.3 // between 0 and 1
}
]
}
```
Then you should specify where to place the axes.
You can either define a single axis by defining a `position` attribute with a value between the min and max value of the track:
```javascript
{
axes: [
{
color: 'red',
position: 4
},
{
color: 'green',
position: 15
}
]
}
```
#### Custom function
You can specify a function that compute the color code given the track data and the datum index. For example:
```javascript
{
color: function(datum, index) {
return datum.value < 5 ? 'red' : 'green'
}
}
```
### axes
The default value is an empty array:
```javascript
{
axes: []
}
```
You can add items to this array to render an axis or a group of axes. You can give axes a `color` (default: '#d3d3d3'), `thickness` (default: 1) and `opacity` (default: track opacity):
```javascript
{
axes: [
{
color: 'black',
thickness: 2, // in pixel
opacity: 0.3 // between 0 and 1
}
]
}
```
Then you should specify where to place the axes.
You can either define a single axis by defining a `position` attribute with a value between the min and max value of the track:
```javascript
{
axes: [
{
color: 'red',
position: 4
},
{
color: 'green',
position: 15
}
]
}
```
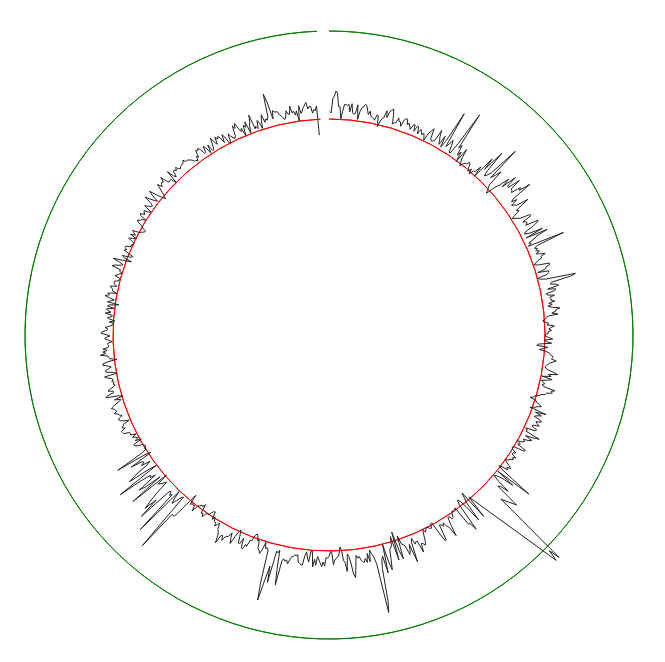
source
Or define a range of axes with a `spacing` attribute and optionnally a `start` and `end` attributes:
```javascript
{
axes: [
{
spacing: 2
}
]
}
```
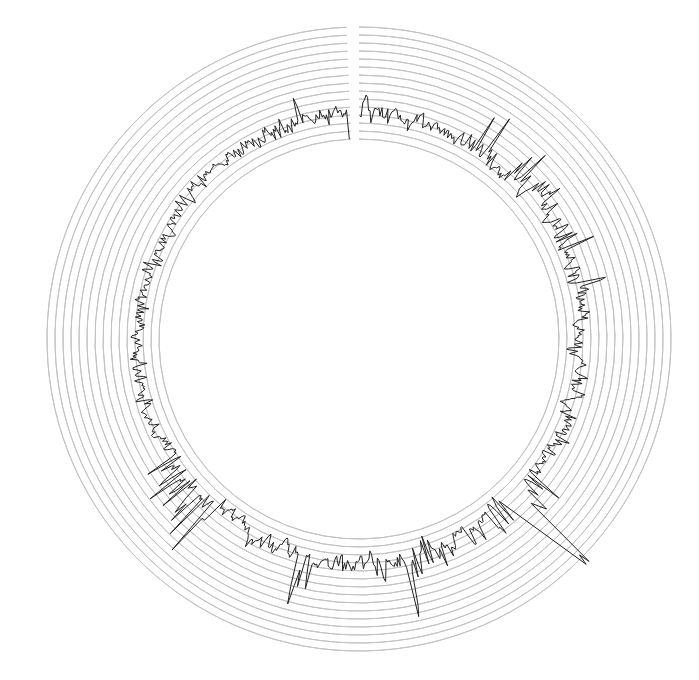
source
Here is an advanced example:
```javascript
{
axes: [
{
color: 'red',
spacing: 2,
end: 4
},
{
color: 'green',
spacing: 2,
start: 16
},
{
spacing: 2,
start: 4,
end: 16,
thickness: 2
},
{
spacing: 1,
start: 4,
end: 16,
thickness: 1
}
]
}
```
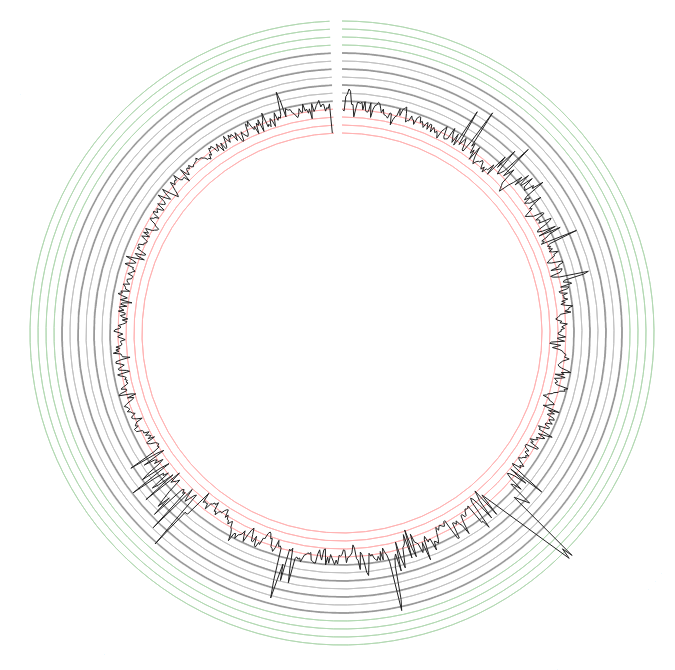
source
The values that you set for `position`, `spacing`, `start` and `end` are in the unit of the track values.
### tooltipContent
A function that receive the datum and the index as a value and return a string displayed in the tooltip (HTML is accepted):
```javascript
{
tooltipContent: function (datum, index) {
return `${datum.block_id}:${datum.start}-${datum.end} ➤ ${datum.value}
(CTRL+C to copy to clipboard)`
}
}
```
Then when you mouseover the datum, a tooltip will be displayed.
Note that you can use the keyboard shortcut CTRL+C to copy the content to clipboard.
### showAxesTooltip
Show or not a tooltip with the value of the axis. Default is `true`.
### direction
It should be either `in` or `out`. Default is `out`. For stack you can also use `center`.
### fill
`true` or `false`.
### fillColor
A color such as `#d3d3d3`, `red`, `rgb(112, 255, 1)`.
### logScale
`true` or `false`. Default is `false`.
### logScaleBase
The log base if logScale is `true`. Default is `Math.E`.
### radius
In the chords configuration you can specify a radius parameter. Default is `null`.
Examples:
```javascript
// when there is no value, default is null:
// the radius will be the one of the innerRadius of the layout
{}
// when the value is a number greater than 1, it is interpreted as
// a number of pixel from the center
{
radius: 200
}
// when the value is a number lower than 1, it is interpreted as
// a fraction of the layout inner radius
{
radius: 0.8
}
// you can also specify a function that return a number that
// will be interpreted as explained above. The function takes
// a datum as parameter
{
radius: function (d) {
if (d.source.id === 'chr1') {
return 0.8
}
if (d.source.id === 'chr2') {
return 0.7
}
}
}
```
### shape
It should be one of:
- `circle`
- `cross`
- `diamond`
- `square`
- `triangle`
- `star`
- `wye`
### zIndex
This should be an integer. The higher it is the more above the track will appear.
## Contact
Nicolas Girault
nic.girault@gmail.com
Your feedbacks are welcome. If you're struggling using the librairy, the best way to ask questions is to use the Github issues so that they are shared with everybody.