# bubble-chart-js
**A high-performance, fully configurable Bubble Chart library for high-density analytics dashboards.**
Zero dependencies. Framework-agnostic. Ships as ESM, CJS, and UMD.
[](https://www.npmjs.com/package/bubble-chart-js)
[](https://www.npmjs.com/package/bubble-chart-js)
[](https://opensource.org/licenses/MIT)
---
## Demo
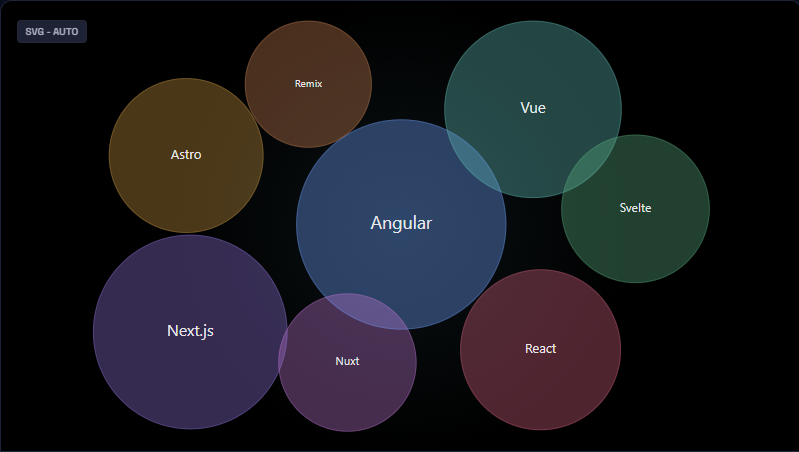
**[View the Live Interactive Demo →](https://praga-dev.github.io/bubble-chart-js/)**
---
## Features
- **Dual renderer** — auto-selects Canvas (large datasets) or SVG (small datasets); override with `render.mode`
- **Physics & static layouts** — force-directed physics simulation with fully tunable parameters, or instant static placement
- **Glass & flat themes** — built-in visual themes with GPU-accelerated bloom and glow effects
- **Per-bubble customization** — individual color, opacity, label, icon, and font overrides per data item
- **Live updates** — call `chart.update(newData)` for smooth, reconciled transitions without re-initializing
- **Pluggable layer hooks** — inject custom draw calls into any render layer (`background`, `bubbles`, `text`, `overlay`, …)
- **Event system** — subscribe to `bubble:click`, `bubble:hover`, and more with a clean pub/sub API
- **Angular-ready** — ships full TypeScript types; integrates seamlessly into Angular, React, Vue, or vanilla JS
- **Tiny footprint** — zero runtime dependencies; tree-shakeable ESM build
---
## Installation
```bash
npm install bubble-chart-js
```
### CDN (no build step)
```html
```
---
## Quick Start
### Vanilla JavaScript / TypeScript
```html
```
```ts
import { initializeChart } from "bubble-chart-js";
const chart = initializeChart({
canvasContainerId: "chart",
data: [
{ id: "chrome", label: "Chrome", value: 65, bubbleColor: "#4285F4" },
{ id: "safari", label: "Safari", value: 19, bubbleColor: "#34A853" },
{ id: "firefox", label: "Firefox", value: 10, bubbleColor: "#FF6D00" },
{ id: "edge", label: "Edge", value: 6, bubbleColor: "#0078D4" },
],
layout: { type: "physics" },
render: { mode: "auto", theme: "glass" },
});
// React to bubble clicks
chart.on("bubble:click", ({ item }) => console.log("Clicked:", item.label));
// Push new data — smooth animated transition
chart.update(newData);
// Teardown (stops animation loop, removes DOM elements)
chart.destroy();
```
### Angular
```ts
// chart.component.ts
import { Component, OnDestroy, AfterViewInit } from "@angular/core";
import { initializeChart, BubbleChart } from "bubble-chart-js";
@Component({
selector: "app-chart",
template: ``,
})
export class ChartComponent implements AfterViewInit, OnDestroy {
private chart!: BubbleChart;
ngAfterViewInit(): void {
this.chart = initializeChart({
canvasContainerId: "bubble-chart",
data: [
{ id: "revenue", label: "Revenue", value: 840, bubbleColor: "#6366f1" },
{ id: "churn", label: "Churn", value: 230, bubbleColor: "#f43f5e" },
{ id: "nps", label: "NPS", value: 510, bubbleColor: "#10b981" },
],
layout: { type: "physics" },
render: { theme: "glass" },
});
}
ngOnDestroy(): void {
this.chart.destroy();
}
}
```
### Browser Script Tag (UMD)
```html
```
---
## API Reference
### `initializeChart(config)`
Creates and renders the chart. Returns a `BubbleChart` instance.
```ts
import { initializeChart } from "bubble-chart-js";
const chart = initializeChart(config);
```
### `BubbleChart` Instance Methods
| Method | Signature | Description |
| ----------------- | ----------------------------------- | ---------------------------------------------------------- |
| `update` | `(newData: DataItem[]) => void` | Re-render with new data; animates transitions |
| `on` | `(event, handler) => UnsubscribeFn` | Subscribe to chart events (`bubble:click`, `bubble:hover`) |
| `destroy` | `() => void` | Stop animation, remove DOM nodes, clear all subscriptions |
| `addLayerHook` | `(hook) => string` | Inject a custom draw call into a named render layer |
| `removeLayerHook` | `(id: string) => void` | Remove a layer hook by ID |
| `simulation` | `Readonly` | Snapshot of the last physics simulation tick |
### `topN(data, n)` Utility
Selects the top N items by value — useful for capping high-cardinality datasets before render.
```ts
import { initializeChart, topN } from "bubble-chart-js";
initializeChart({ canvasContainerId: "chart", data: topN(rawData, 25) });
```
---
## Configuration Reference
### `DataItem`
| Property | Type | Required | Description |
| ------------- | -------- | -------- | --------------------------------------------------------------------- |
| `id` | `string` | No | Stable key for reconciliation on `update()`. Auto-derived if omitted. |
| `label` | `string` | **Yes** | Text displayed inside the bubble |
| `value` | `number` | **Yes** | Determines bubble radius relative to the dataset |
| `bubbleColor` | `string` | No | CSS color string for this specific bubble |
| `opacity` | `number` | No | Fill opacity `0–1`. Overrides global `bubbleAppearance.opacity` |
| `icon` | `string` | No | Unicode codepoint or ligature string (e.g. `"trending_up"`) |
| `iconFont` | `string` | No | Font family for the icon, e.g. `"Material Symbols Outlined"` |
### `Configuration` (top-level)
| Property | Type | Default | Description |
| ---------------------------------- | ------------------- | ------------- | ------------------------------------------------------------------ |
| `canvasContainerId` | `string` | — | **Required.** ID of the host DOM element |
| `data` | `DataItem[]` | — | **Required.** Array of bubble data |
| `colorPalette` | `string[]` | built-in | Fallback color cycle for bubbles without an explicit `bubbleColor` |
| `minRadius` | `number` | `20` | Minimum bubble radius in pixels |
| `canvasBackgroundColor` | `string` | `transparent` | Canvas background fill color |
| `isResizeCanvasOnWindowSizeChange` | `boolean` | `true` | Auto-resize chart on window resize |
| `theme` | `"flat" \| "glass"` | `"flat"` | Shorthand alias for `render.theme` |
### `layout`
| Property | Type | Default | Description |
| ------------------------ | ------------------------- | ----------- | ---------------------------------------------------------- |
| `type` | `"static" \| "physics"` | `"static"` | Layout engine selection |
| `physics.seed` | `number` | — | Seed for deterministic initial bubble placement |
| `physics.centerStrength` | `number` | `0.012` | Strength of the centering force |
| `physics.collisionPad` | `number` | `3` | Extra padding (px) added to each bubble's collision radius |
| `physics.velocityDecay` | `number` | `0.82` | Velocity decay per tick (`0–1`) |
| `physics.alphaDecay` | `number` | `0.0228` | Alpha decay rate per tick |
| `physics.maxVelocity` | `number` | `8` | Maximum velocity magnitude per tick |
| `physics.updateBehavior` | `"restart" \| "momentum"` | `"restart"` | How `update()` affects a running simulation |
### `render`
| Property | Type | Default | Description |
| ---------------------------- | ----------------------------- | -------- | ----------------------------------------------------------- |
| `mode` | `"auto" \| "svg" \| "canvas"` | `"auto"` | Renderer selection (`auto` picks Canvas for >25 items) |
| `theme` | `"flat" \| "glass"` | `"flat"` | Visual theme |
| `glassPerformanceHint` | `"safe" \| "full"` | `"safe"` | `full` = GPU feGaussianBlur bloom; `safe` = CSS drop-shadow |
| `glassOptions.glowIntensity` | `number` | `0.35` | Glow intensity `0–1` (glass theme only) |
| `glassOptions.blurRadius` | `number` | `12` | Outer halo blur radius in px (`full` mode only) |
### `interaction`
| Property | Type | Default | Description |
| ---------------- | --------- | ------- | ------------------------------------------ |
| `hoverScale` | `number` | `1.08` | Scale factor applied to the hovered bubble |
| `hoverEase` | `number` | `0.10` | Lerp factor for hover animation (`0–1`) |
| `tooltipEnabled` | `boolean` | `true` | Show tooltip on hover |
### `animation`
| Property | Type | Default | Description |
| ------------------ | ----------------------- | ------- | ------------------------------------------------- |
| `entryDuration` | `number` | `25` | Entry animation duration in frames |
| `transitionEasing` | `(t: number) => number` | — | Custom easing function for position/radius tweens |
### Tooltip (`tooltipOptions`)
Full CSS-style control over the hover tooltip. Accepts `backgroundColor`, `fontColor`, `fontFamily`, `fontSize`, `padding`, `borderColor`, `boxShadow`, `zIndex`, and more. Supply a `formatter` function for fully custom HTML content:
```ts
tooltipOptions: {
backgroundColor: '#1e1e2e',
fontColor: '#cdd6f4',
formatter: (item) => `${item.label}: ${item.value.toLocaleString()}`,
},
```
---
## Events
| Event | Payload | Description |
| -------------- | ------------------------------------------------- | ------------------------------ |
| `bubble:click` | `{ item: DataItem, event: PointerEvent }` | Fired when a bubble is clicked |
| `bubble:hover` | `{ item: DataItem \| null, event: PointerEvent }` | Fired on hover enter / leave |
```ts
const unsub = chart.on("bubble:click", ({ item }) => {
console.log(`${item.label}: ${item.value}`);
});
// Stop listening
unsub();
```
---
## Layer Hooks
Inject custom Canvas 2D draw calls into any render layer for complete visual control:
```ts
chart.addLayerHook({
layer: "overlay",
draw: ({ ctx, bubbles }) => {
bubbles.forEach((b) => {
ctx.strokeStyle = "rgba(255,255,255,0.4)";
ctx.lineWidth = 2;
ctx.beginPath();
ctx.arc(b.x, b.y, b.r + 4, 0, Math.PI * 2);
ctx.stroke();
});
},
});
```
Available layers: `background`, `shadows`, `bubbles`, `text`, `overlay`, `debug`.
---
## Contributing
Contributions, bug reports, and feature requests are welcome. Please open an issue or submit a pull request on [GitHub](https://github.com/praga-dev/bubble-chart-js).
---
## License
MIT © [Pragadeeshwaran Pasupathi](https://github.com/praga-dev)