# Apus - React Chart Library
A powerful and customizable chart library for React applications, built with D3.js and TypeScript.
[](https://www.npmjs.com/package/apus)
[](https://yarnpkg.com/package?name=apus)
**📚 [View Documentation](https://harshattray.github.io/apus/) | 🚀 [Live Demo](https://apus-alpha.vercel.app/)**
## Features
- 🎯 Built with React 18 and TypeScript
- 📊 Powered by D3.js for powerful data visualization
- 🎨 Customizable and responsive charts
- 📦 Lightweight and easy to integrate
- 🔍 Type-safe with TypeScript support
- 🎨 Modern UI components with Tailwind CSS
## Screenshots
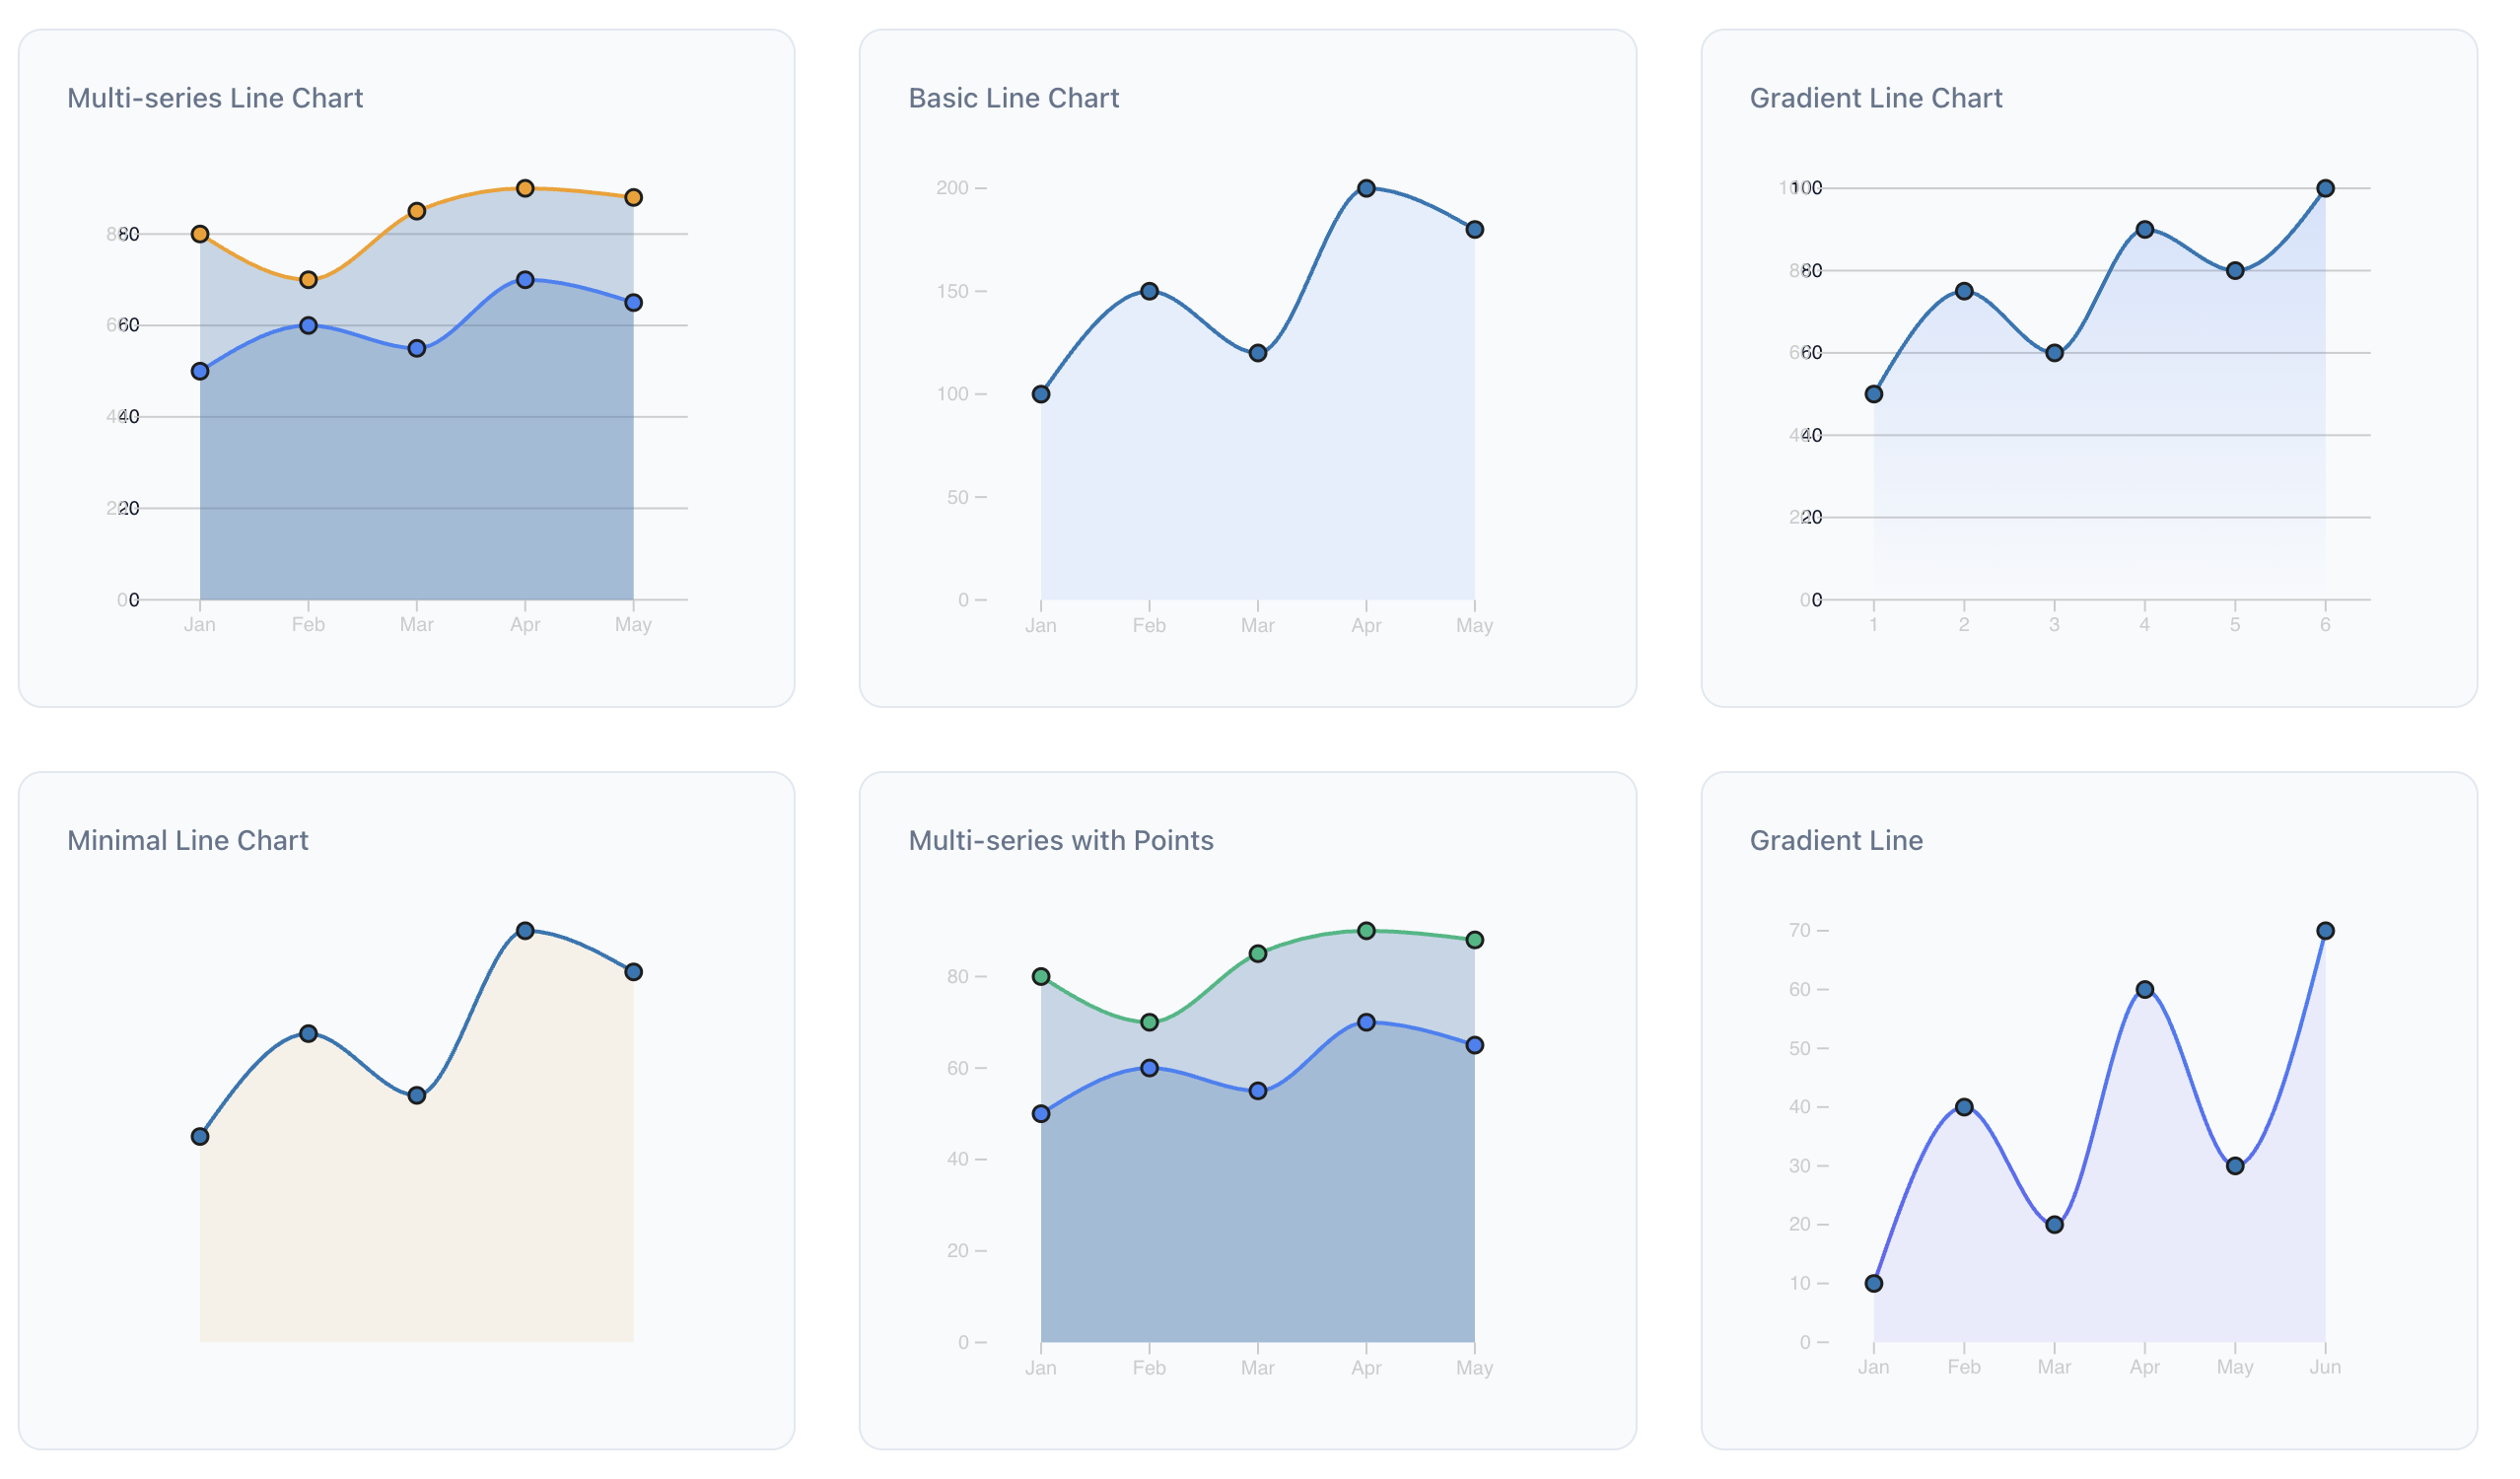
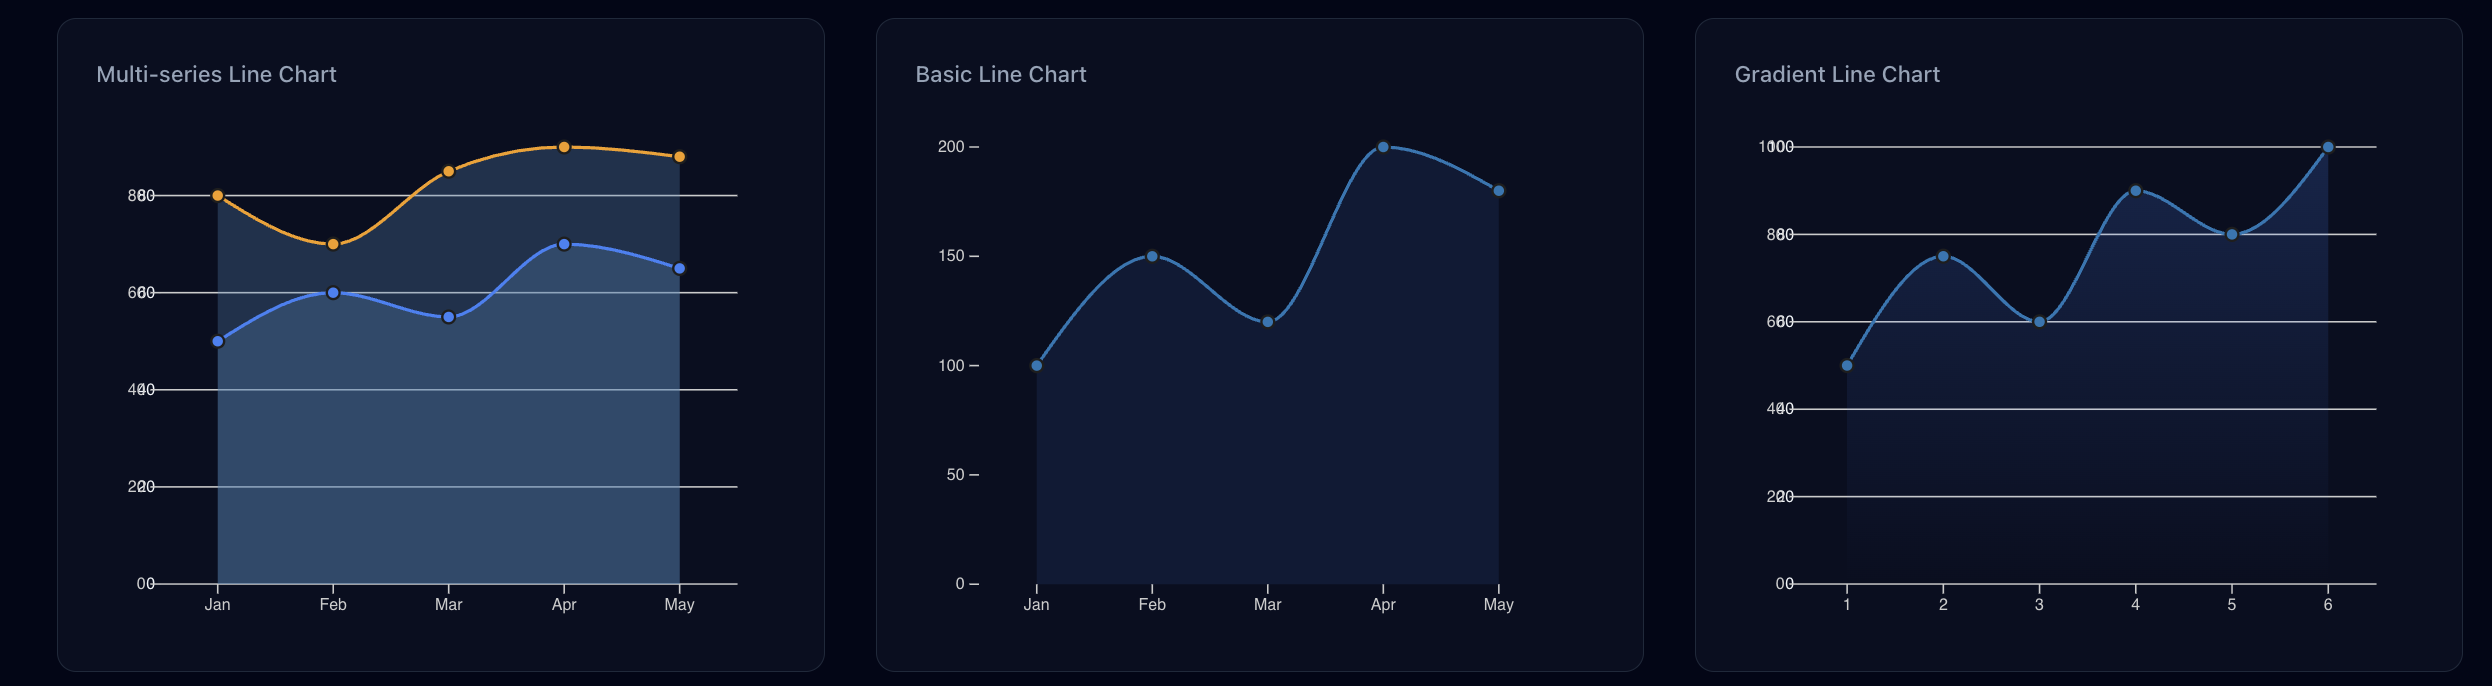
*Interactive Line Chart with Multiple Datasets*
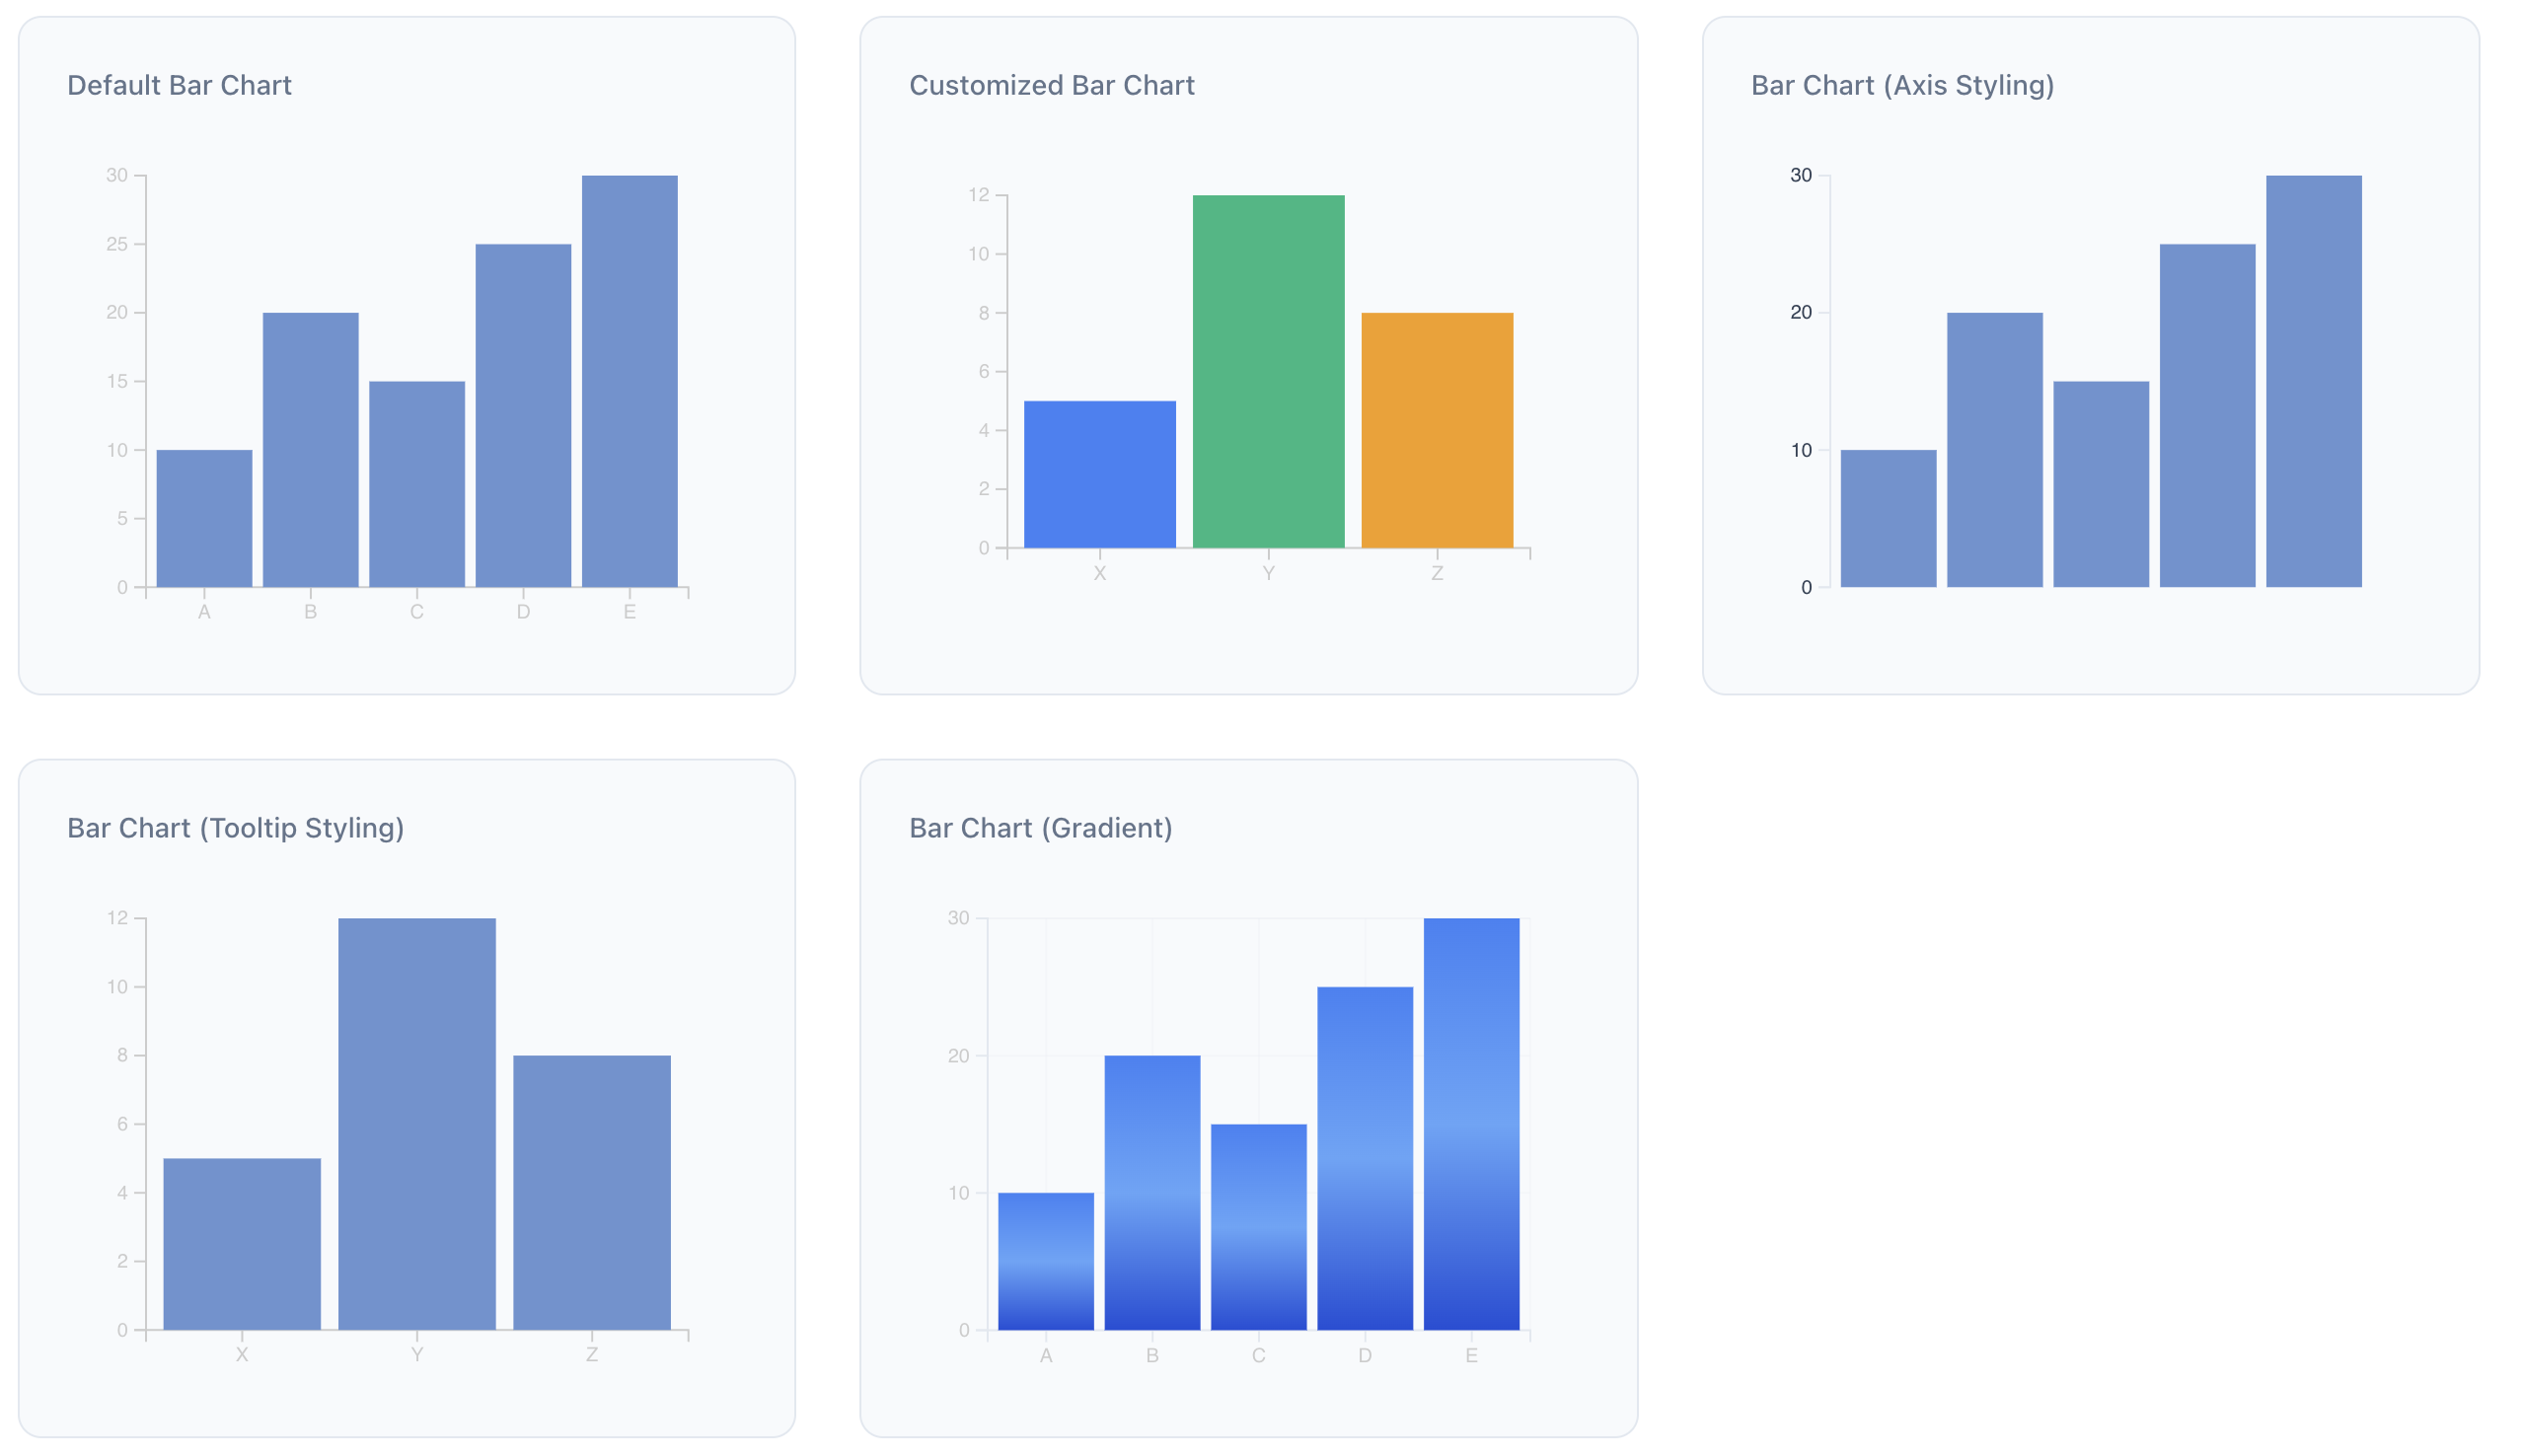
*Customizable Bar Chart with Tooltips*
*Advanced Scatter Plot with Regression Line*
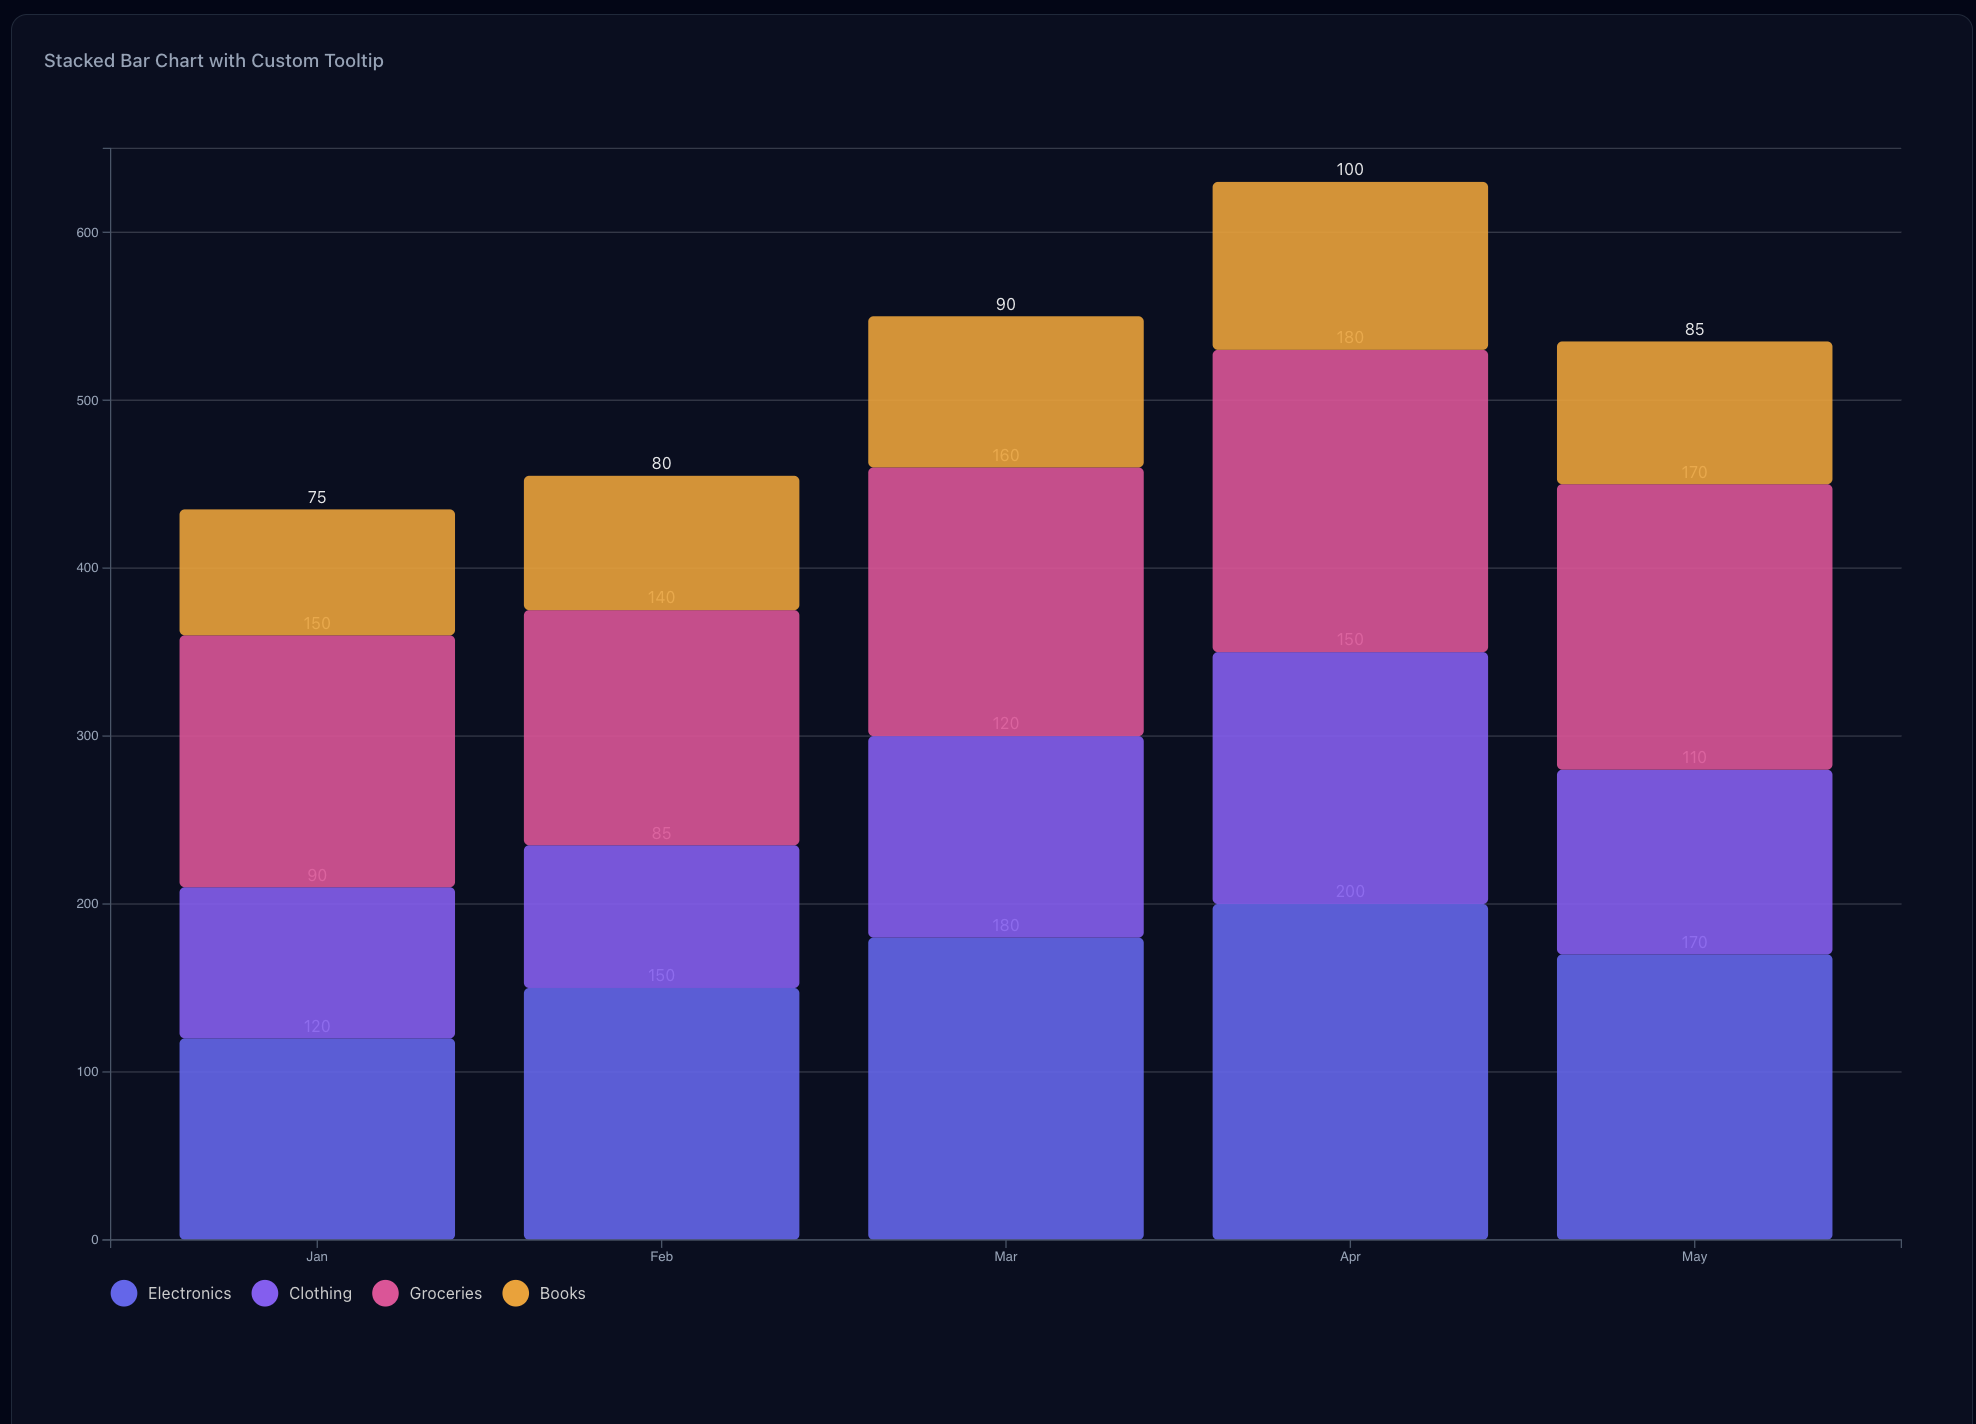
*Stacked Bar Chart*
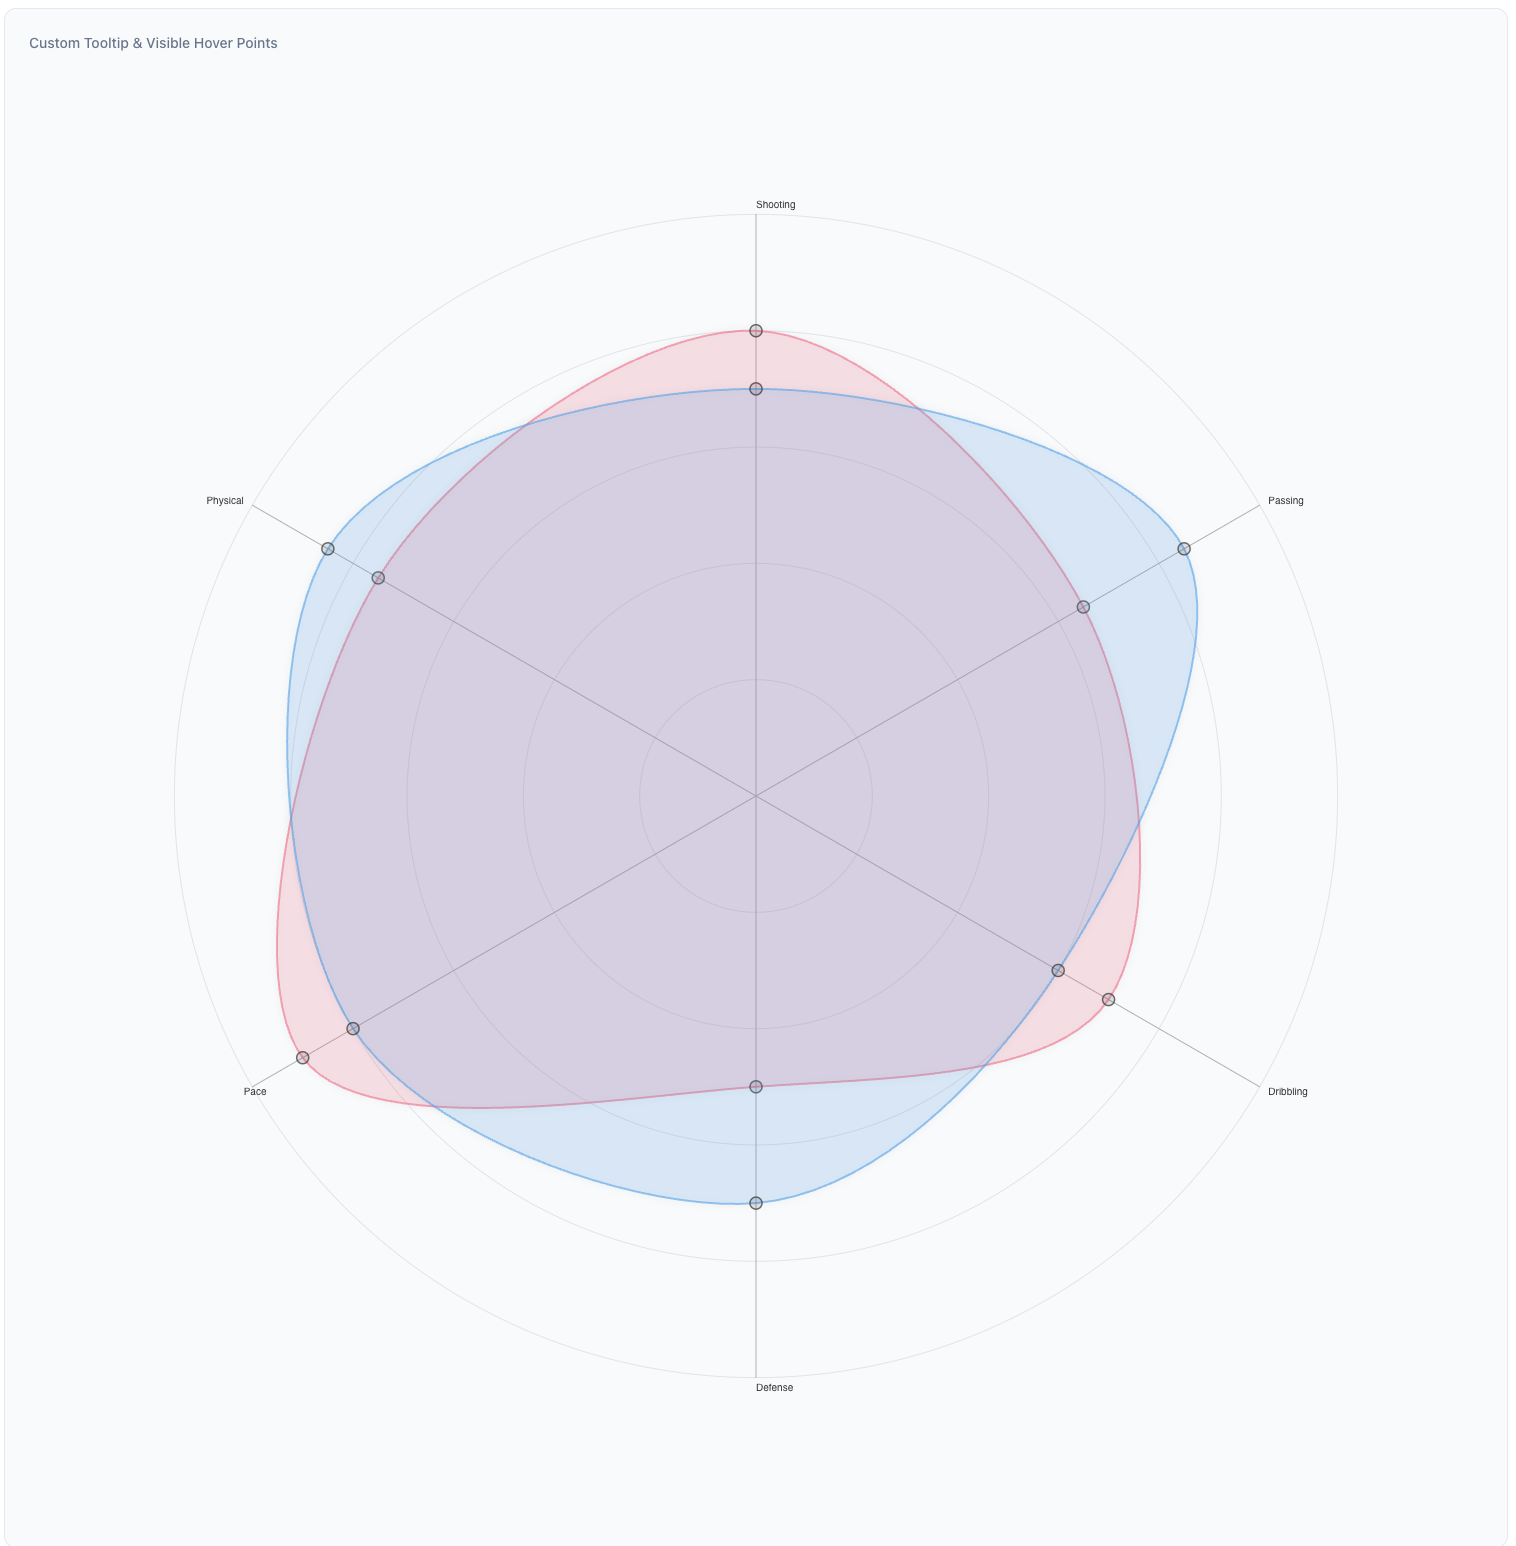
*Radar Chart*
## Installation
```bash
# Using npm
npm install apus
# Using yarn
yarn add apus
# Using pnpm
pnpm add apus
```
## Peer Dependencies
This library requires the following peer dependencies:
```json
{
"d3": "^7.0.0",
"react": "^18.0.0",
"react-dom": "^18.0.0"
}
```
## Available Chart Types
### 1. Line Chart
A versatile chart for displaying trends over time or continuous data. Supports multiple series, area fills, and customization options.
[View LineChart Props and Details](./src/lib/LineChart/README.md)
```tsx
import { LineChart } from 'apus';
const lineChartData = [
{
name: 'Series 1',
values: [
{ label: 'Jan', value: 30 },
{ label: 'Feb', value: 40 },
{ label: 'Mar', value: 35 },
],
},
{
name: 'Series 2',
values: [
{ label: 'Jan', value: 50 },
{ label: 'Feb', value: 60 },
{ label: 'Mar', value: 55 },
],
},
];
```
### 2. Bar Chart
Ideal for comparing discrete categories. Supports single or multiple colors and responsiveness.
[View BarChart Props and Details](./src/lib/BarChart/README.md)
```tsx
import { BarChart } from 'apus';
const barChartData = [
{ label: 'Category A', value: 10 },
{ label: 'Category B', value: 20 },
{ label: 'Category C', value: 15 },
];
```
### 3. Stacked Bar Chart
Displays data as a series of stacked bars, suitable for showing parts of a whole or comparing cumulative totals across different categories.
[View StackedBarChart Props and Details](./src/lib/StackedBarChart/README.md)
```tsx
import { StackedBarChart } from 'apus';
const salesData = [
{ month: 'Jan', apples: 10, oranges: 20, bananas: 15 },
{ month: 'Feb', apples: 12, oranges: 18, bananas: 22 },
{ month: 'Mar', apples: 8, oranges: 25, bananas: 10 },
];
const fruitKeys = ['apples', 'oranges', 'bananas'];
```
## Component Props
For detailed props of each component, please refer to their individual README files linked above.
## Advanced Usage Examples
### 1. Custom Styling with Gradients (Line Chart)
```tsx
```
### 2. Custom Styling with Multiple Colors (Bar Chart)
```tsx
### 3. Charts with Legends
#### Line Chart with Legend
```tsx
// Multi-series line chart with legend on the right
const multiSeriesData = [
{
name: 'Series A',
values: [
{ label: 'Jan', value: 30 },
{ label: 'Feb', value: 45 },
{ label: 'Mar', value: 40 },
{ label: 'Apr', value: 55 },
{ label: 'May', value: 50 },
],
},
{
name: 'Series B',
values: [
{ label: 'Jan', value: 60 },
{ label: 'Feb', value: 50 },
{ label: 'Mar', value: 65 },
{ label: 'Apr', value: 70 },
{ label: 'May', value: 68 },
],
},
];
```
#### Bar Chart with Legend
```tsx
// Bar chart with custom legend labels at the bottom
const barData = [
{ label: 'A', value: 10 },
{ label: 'B', value: 20 },
{ label: 'C', value: 15 },
{ label: 'D', value: 25 },
{ label: 'E', value: 30 },
];
```
## Development
1. Clone the repository:
```bash
git clone https://github.com/harshattray/apus.git
cd apus
```
2. Install dependencies:
```bash
npm install
```
3. Start the development server:
```bash
npm run dev
```
4. Build the library:
```bash
npm run build
```
## Contributing
Contributions are welcome! Please feel free to submit a Pull Request. For major changes, please open an issue first to discuss what you would like to change.
Make sure to update tests as appropriate.
## License
[MIT](LICENSE)
## Support
If you encounter any issues or have questions, please [open an issue](https://github.com/harshattray/apus/issues) on GitHub.
## Author
- GitHub: [@harshattray](https://github.com/harshattray)
- Medium: [@Harshattray](https://medium.com/@Harshattray)