# Angular Sunburst Radar Chart
A Sunburst chart component in Angular developed using no dependencies, offCourse used SVG
####Updates
Migrated options into seperate object
Able to rotate the chart by dragging
smoother animations
Better tool tip
[Chart Demo](https://muthuishere.github.io/sunburst-radar-chart-workspace/)
To Use
Import AngularSunburstRadarChartModule to your module .
```
imports: [
... Other modules
AngularSunburstRadarChartModule
],
```
in your component.ts
```
const options = {"size":800,"maxScore":100,"legendAxisLinePosition":1,"animateChart":false,"splitBasedOnChildren":true}
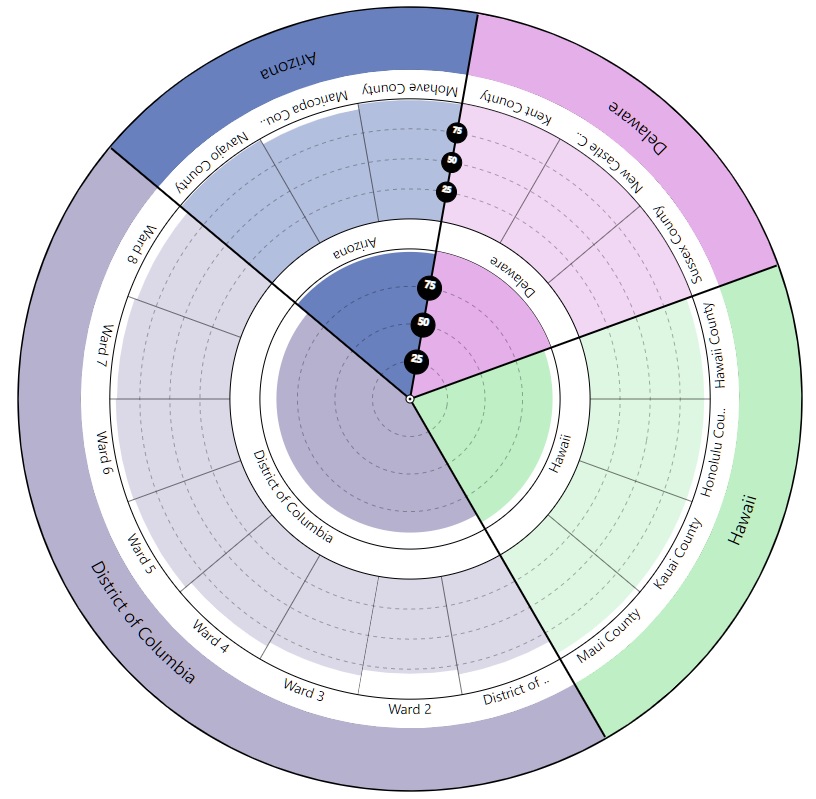
const items = [ { "name": "Delaware ", "color": "#e5b0e9", "value": 100, "children": [ { "name": "Kent County", "value": 100 }, { "name": "New Castle County", "value": 100 }, { "name": "Sussex County", "value": 100 } ] },
{ "name": "Hawaii ", "value": 95, "color": "#beefc5", "children": [ { "name": "Hawaii County", "value": 95 }, { "name": "Honolulu County", "value": 95 }, { "name": "Kauai County", "value": 95 }, { "name": "Maui County", "value": 95 } ] },
{ "name": "District of Columbia ", "color": "#b7b1d0", "value": 89, "children": [ { "name": "District of Columbia", "value": 83 }, { "name": "Ward 2", "value": 79 }, { "name": "Ward 3", "value": 84 }, { "name": "Ward 4", "value": 88 }, { "name": "Ward 5", "value": 94 }, { "name": "Ward 6", "value": 95 }, { "name": "Ward 7", "value": 94 }, { "name": "Ward 8", "value": 92 } ] },
{ "name": "Arizona ", "value": 98, "color": "#6880be", "children": [ { "name": "Navajo County", "value": 99 }, { "name": "Maricopa County", "value": 95 }, { "name": "Mohave County", "value": 99 } ] } ]
```
in your component.html
```
```
The above will display chart something like below
|Parameter|Data Type|Description|
|--- |--- |--- |
|items|Item[]|List of items to be displayed on chart in Array format of type Item |
|options|Options|Options to be used in chart|
####Options Data Type
|Parameter|Data Type|Default|Description|
|--- |--- |--- |--- |
|size|number|800 |Size of Chart |
|maxScore|number|100 |Maximum score of the values |
|legendAxisLinePosition |number |1 |The position where the legend axis labels to be displayed |
|animateChart|boolean|true |Animate the chart while showing|
|splitBasedOnChildren|boolean|true |To split the angles equally based on the total children nodes available |
####Item Data Type
|Parameter|Data Type|Description|
|--- |--- |--- |
|name|string|name of the item |
|value|number|value of Item|
|color|string|HexCode color string #FFF000|
|children|Array of Item |Array of the same item data type|
If you find it useful, try considering