# angular-chart [](https://travis-ci.org/GraFiddle/angular-chart) [](https://coveralls.io/r/GraFiddle/angular-chart?branch=master) [](https://gemnasium.com/GraFiddle/angular-chart)
> adjustable dynamically updating stateful charts for [AngularJS](https://github.com/angular/angular.js)
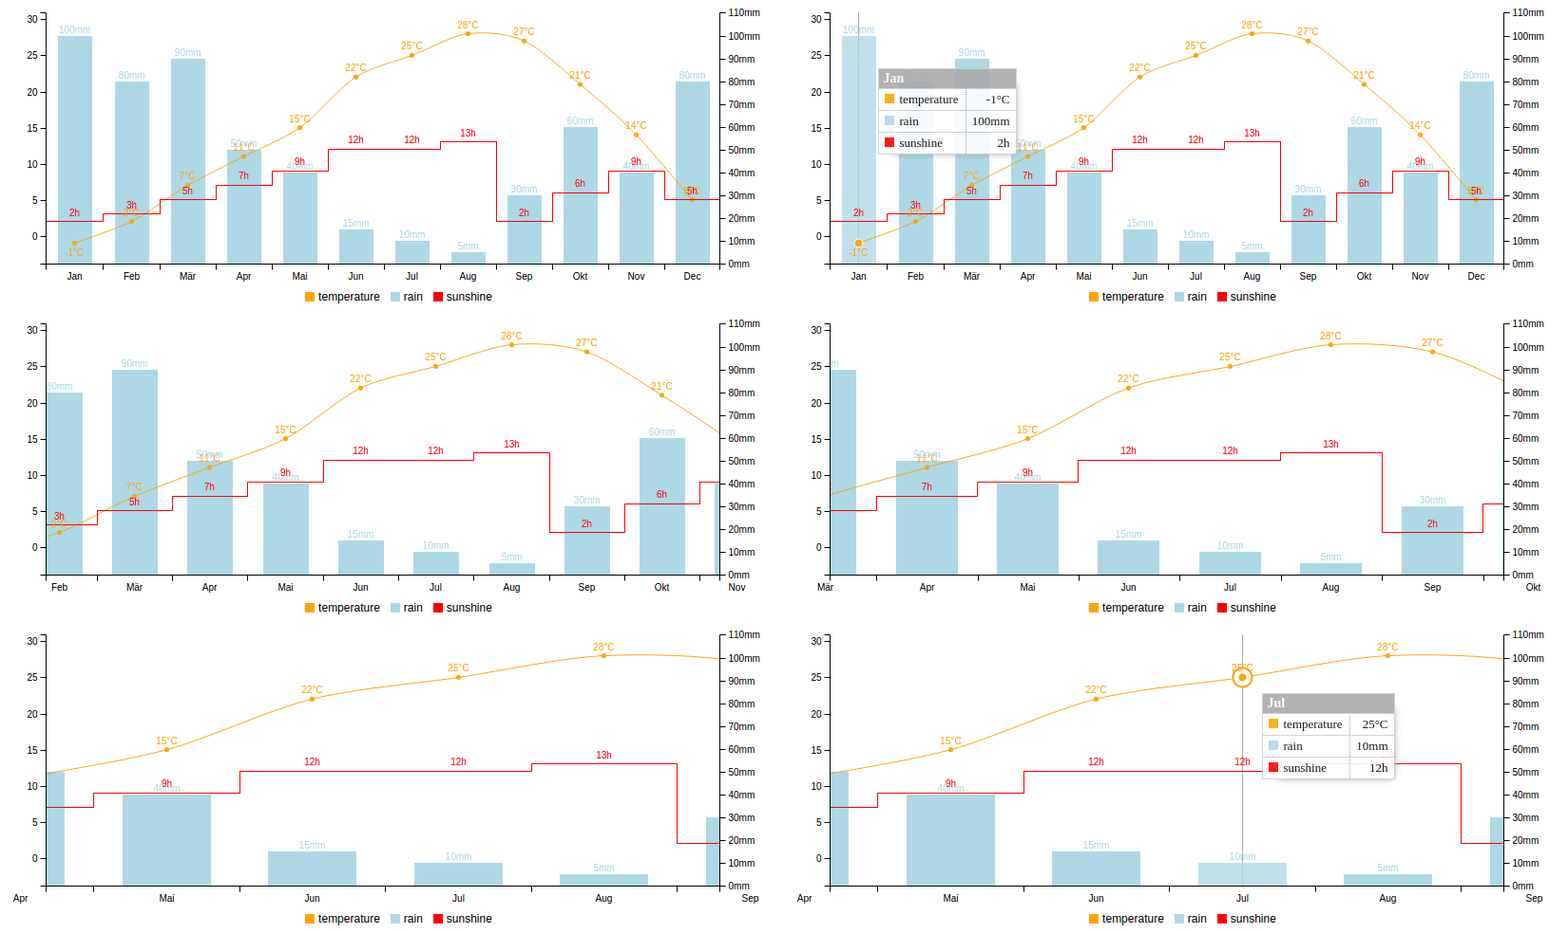
angular-chart is a [AngularJS](https://github.com/angular/angular.js) directive, which is build on top of [C3.js](https://github.com/masayuki0812/c3) a [d3](https://github.com/mbostock/d3)-based chart library.
## Install
You can download all necessary angular-chart files manually or install them with [Bower](http://bower.io/):
```sh
bower install angular-chart --save
```
Add everything to your index.html:
```html
```
Specify the directive in your module dependencies:
```javascript
angular.module('myApp', ['angularChart'])
```
## Usage
Add the corresponding data in your controller:
```javascript
angular
.module('myApp')
.controller('Controller', function($scope) {
$scope.options = {
data: [
{
sales: 130,
income: 250
}
],
dimensions: {
sales: {
type: 'bar'
},
income: {
axis: 'y2'
}
}
};
// optional (direct access to c3js API http://c3js.org/reference.html#api)
$scope.instance = null;
});
```
Then you are ready to use the directive in your view:
```html
```
[learn how to upgrade from v0.2.x](#upgrade-02x-to-030)
## OPTIONS
The options object can contain four different keys:
* `data` JSON based data you want to visualize
* `dimensions` Specifies which and how the data dimensions will be plotted
* `chart` Access to the full API of [C3.js](http://c3js.org/examples.html) to style your visualization
* `state` Current state of interactions with the chart
### data
A JSON data array which can contain numbers and string.
```javascript
$scope.options = {
data: [
{
sales: 130,
weekday: 'Monday',
date: '2015-04-04 12:13:55'
}
]
};
```
### dimensions
Specifies which and how the data dimensions will be plotted.
##### dimension.type : String
Possible values: `line, spline, bar, scatter, area, area-spline, step, area-step, step`
--
##### dimension.axis : String
Possible values: `x, y, y2`
Defines the axis the row is linked.
--
##### dimension.name : String
Optional name for the row.
--
##### dimension.show : String
Defines if the row should be rendered in the chart.
--
##### dimension.color : String
Defines the color for this row.
--
##### dimension.label : boolean
Defines if data labels inside the chart are shown or not (default: `false`).
To define axis labels specify [chart.axis.y.label](http://c3js.org/samples/axes_label.html).
--
##### dimension.dataType : String
Possible values: `numeric, indexed, category, datetime`
--
##### dimension.dataFormat : String | Function
The dataFormat is used convert timestamps in in Date objects, it uses the [D3 Time Formatting](https://github.com/mbostock/d3/wiki/Time-Formatting).
Sample:`%Y-%m-%dT%H:%M:%S`
--
##### dimension.displayFormat : String | Function
If the xAxis displays a timestamp the format of if can be defined by passing a String which follows the [Time Formatting of D3](https://github.com/mbostock/d3/wiki/Time-Formatting). Alternatively a custom function can be passed.
Sample: `function (x) { return x.getFullYear(); }`
--
##### dimension.prefix : String
To specify the appearance of your data in tooltips, labels and in the axis ticks you can add a prefix.
Sample: `$`
--
##### dimension.postfix : String
To specify the appearance of your data in tooltips, labels and in the axis ticks you can add a postfix.
Sample: `€`
### chart
Access to the full API of [C3.js](http://c3js.org/examples.html) to customize your visualization.
##### chart.data.watchLimit
The `watchLimit` key is added in addition to the c3-API. Add a custom limit to define when to stop watching for changes inside of data and only watch for changes in the number of items the data array contains. Default: 100
### state
Current state of interactions with the chart.
##### state.range : Array ```[a, b]```
The current zoomed in range can get and set here. Works also for the subchart.
--
##### state.selected : Array
Contains an array with all selected points of the chart:
Multichart (line, spline, bar, scatter):
```
{
value: VALUE,
id: COLUMN_NAME,
index: X_AXIS_INDEX
}
```
Pie-, Donut chart: _(Currently adding a selection in the Array will not add the selection in the chart)_
```
{
id: COLUMN_NAME,
values: [ALL_COLUMN_VALUES]
}
```
## INSTANCE
The `instance` attribute of the directive will be filled with a promise on initialization.
The promise will be fulfilled the first time the chart is generated.
Every time a new chart instance is created the `instance` of the directive will be updated as well.
You can call all [c3js API calls](http://c3js.org/reference.html#api) such as `flow()`, `resize()`, ... on the chart instance.
## Events
The `angular-chart-rendered` event is emitted every time a chart is generated or regenerated. It gives access to the `options` the chart is generated with and to the newly created chart instance.
```javascript
$scope.$on('angular-chart-rendered', function(event, options, instance) {
console.log(options, instance);
});
```
## custom Style
The whole chart is based on SVG, which allows you to stlye most parts using CSS.
The documentation of c3.js provides a few [examples](http://c3js.org/examples.html#style) on how to style your chart.
## Upgrade 0.2.x to 0.3.0
* `` should be used instead of ``
* the `dataset` now lives inside the options you pass to angular-chart:
```javascript
// old
$scope.dataset = [...];
$scope.options = {};
// new
$scope.options = {
data: [...],
dimensions: {},
chart: {},
state: {}
};
```
* integrate the `schema` object into the `dimensions`:
```javascript
// old
$scope.schema = {
day: {
type: 'datetime',
format: '%Y-%m-%d_%H:%M:%S',
name: 'Date'
}
};
// new
$scope.options = {
dimensions: {
day: {
dataType: 'datetime',
dataFormat: '%Y-%m-%d_%H:%M:%S',
name: 'Date'
}
}
};
```
* the `options.rows` and `options.xAxis` are now integrated in the `dimensions`:
```javascript
// old
$scope.options = {
rows: [{
key: 'income',
type: 'bar'
}, {
key: 'sales'
}],
xAxis: {
key: 'day',
displayFormat: '%Y-%m-%d %H:%M:%S'
}
};
// new
$scope.options = {
dimensions: {
income: {
axis: 'y',
type: 'bar'
},
sales: { // all visible dimensions have to be defined here
}, // leave the object empty to add a line to the y-Axis
day: {
axis: 'x',
displayFormat: '%Y-%m-%d %H:%M:%S'
}
}
};
```
* `data.watchLimit` can now be set at `options.chart.data.watchLimit`
* `data.orientation` is currently not supported, please stick to json data
* the in-place editor features `typeSelector`, `xAxis.selector`, `subchart.selector` and `legend.selector` are no longer part of the main project. An additional plugin will make them available again soon.
## Development [](https://waffle.io/maxklenk/angular-chart) [](https://gitter.im/maxklenk/angular-chart)
We use Karma and jshint to ensure the quality of the code. The easiest way to run these checks is to use gulp:
```sh
npm install -g bower gulp
npm install
bower install
gulp
```
## More about the project
This [presentation](http://maxklenk.github.io/angular-chart-presentation) gives some insights to understand the motivation behind angular-chart:
http://maxklenk.github.io/angular-chart-presentation
## Contributing
Please submit all pull requests the against **master branch**. Make sure it passes the CI
[](https://travis-ci.org/GraFiddle/angular-chart) and add tests to cover your code [](https://coveralls.io/r/maxklenk/angular-chart?branch=master). Thanks!
## Authors
**Max Klenk**
+ http://github.com/maxklenk
## Credit
angular-chart was first developed as the technical part of my bachelor thesis "Real-time collaborative Visual Analytics with AngularJS and D3.js".
The thesis was written at the [Professorship of Media Computer Science](http://www.fim.uni-passau.de/en/media-computer-science/) ([Prof. Dr. Michael Granitzer](https://github.com/mgrani)) of the [University of Passau](http://www.uni-passau.de/en/) and in cooperation with [ONE LOGIC](https://github.com/one-logic).
## Copyright and license
The MIT License
Copyright (c) 2014 Max Klenk
Permission is hereby granted, free of charge, to any person obtaining a copy
of this software and associated documentation files (the "Software"), to deal
in the Software without restriction, including without limitation the rights
to use, copy, modify, merge, publish, distribute, sublicense, and/or sell
copies of the Software, and to permit persons to whom the Software is
furnished to do so, subject to the following conditions:
The above copyright notice and this permission notice shall be included in
all copies or substantial portions of the Software.
THE SOFTWARE IS PROVIDED "AS IS", WITHOUT WARRANTY OF ANY KIND, EXPRESS OR
IMPLIED, INCLUDING BUT NOT LIMITED TO THE WARRANTIES OF MERCHANTABILITY,
FITNESS FOR A PARTICULAR PURPOSE AND NONINFRINGEMENT. IN NO EVENT SHALL THE
AUTHORS OR COPYRIGHT HOLDERS BE LIABLE FOR ANY CLAIM, DAMAGES OR OTHER
LIABILITY, WHETHER IN AN ACTION OF CONTRACT, TORT OR OTHERWISE, ARISING FROM,
OUT OF OR IN CONNECTION WITH THE SOFTWARE OR THE USE OR OTHER DEALINGS IN
THE SOFTWARE.