# [ai-figure](https://figure.ling.pub/gallery)
> Clean SVG diagram renderer — define config, get beautiful diagrams. Works in browser **and** Node.js.
[](https://www.npmjs.com/package/ai-figure)
[](https://github.com/hustcc/ai-figure/actions/workflows/build.yml)
[](LICENSE)
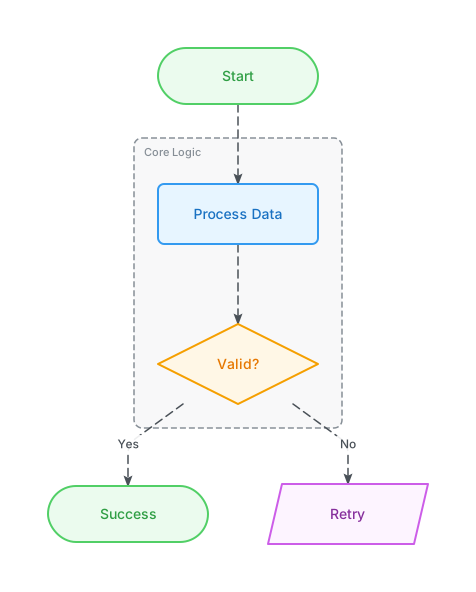
Flowchart
|
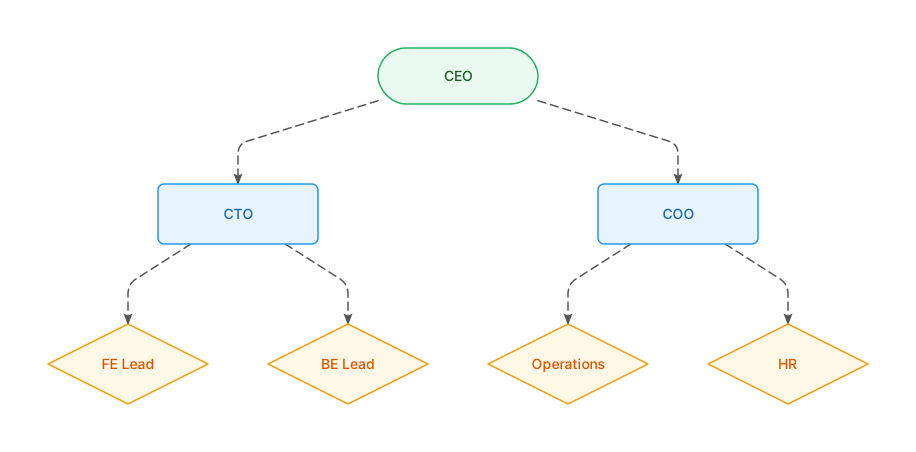
Tree
|
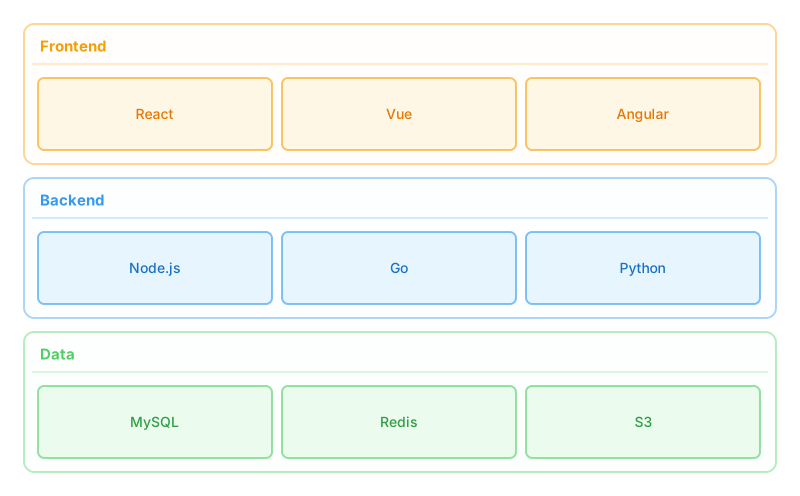
Architecture
|
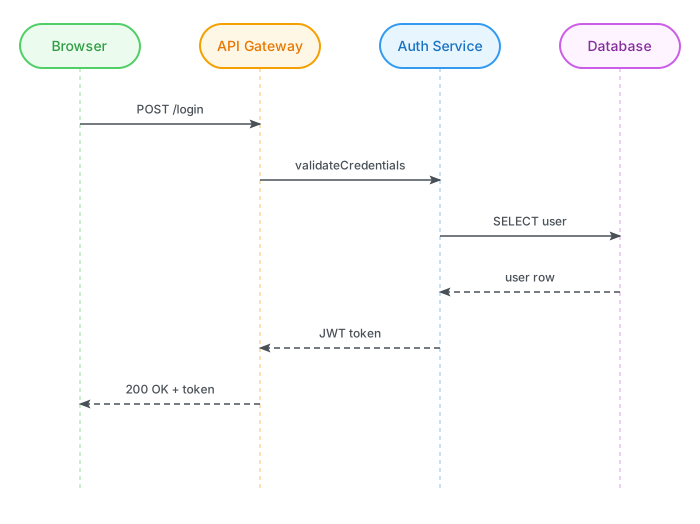
Sequence
|
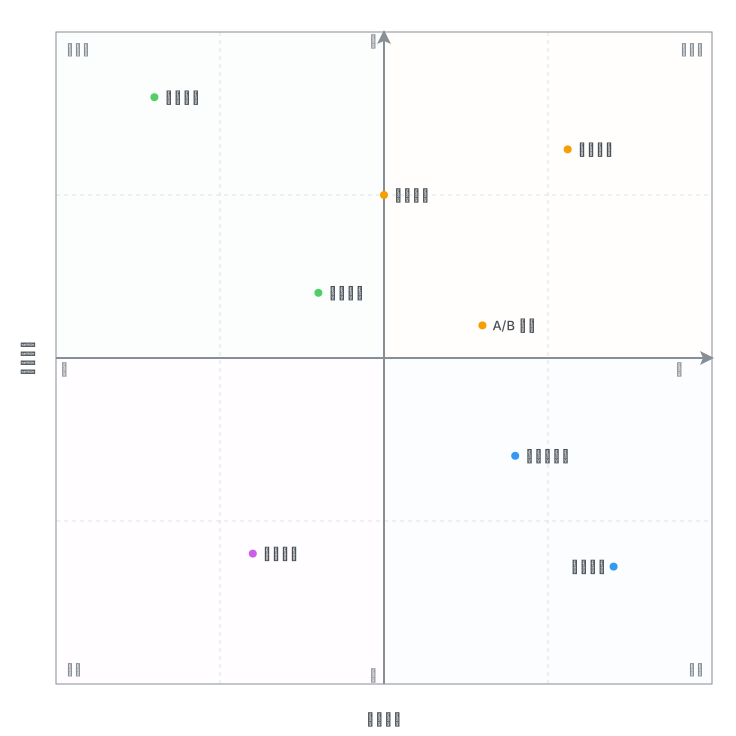
Quadrant
|
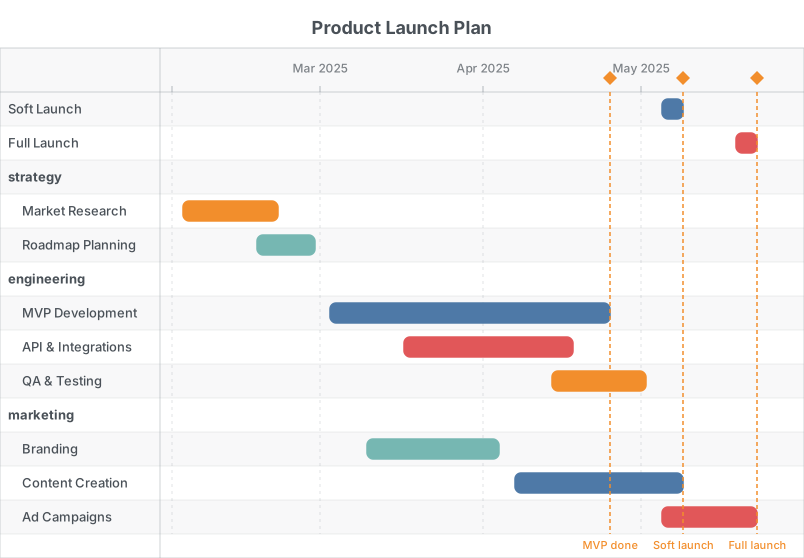
Gantt
|
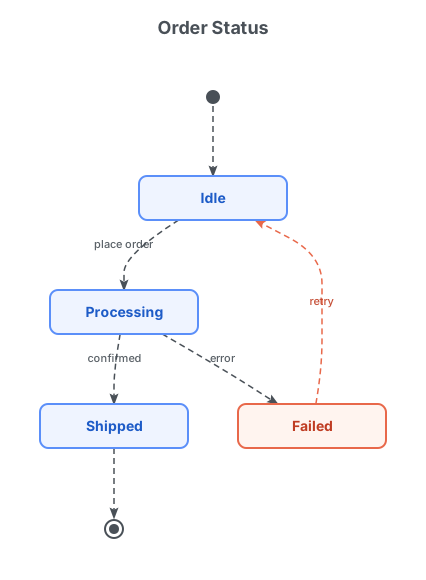
State Machine
|
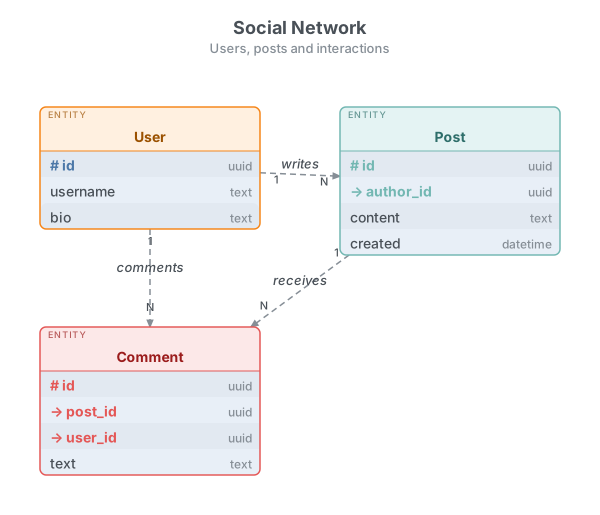
ER Diagram
|
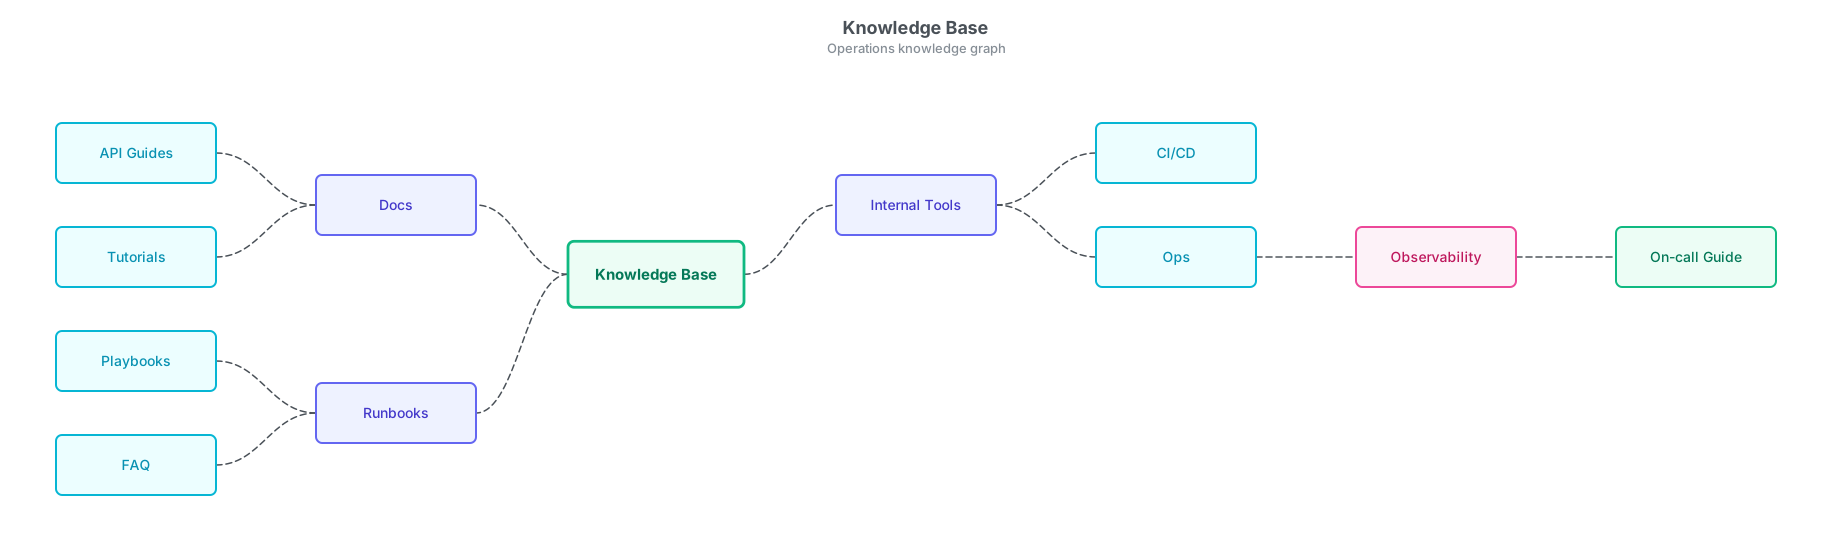
Mindmap
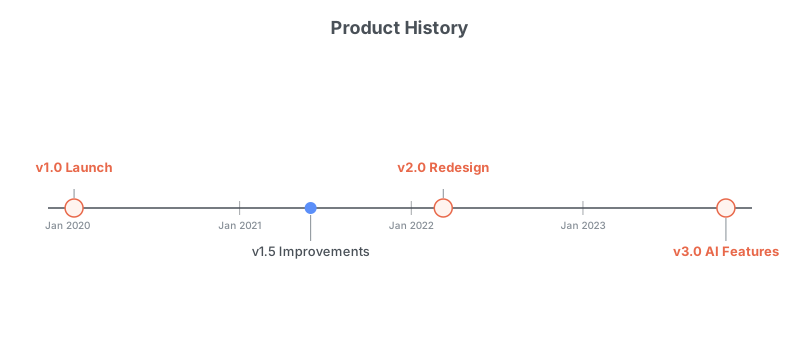
Timeline
|
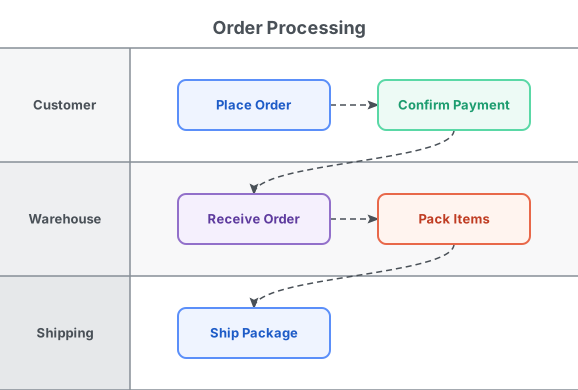
Swimlane
|
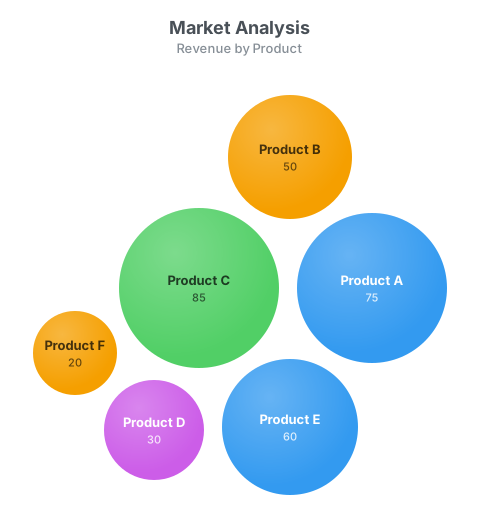
Bubble Chart
|
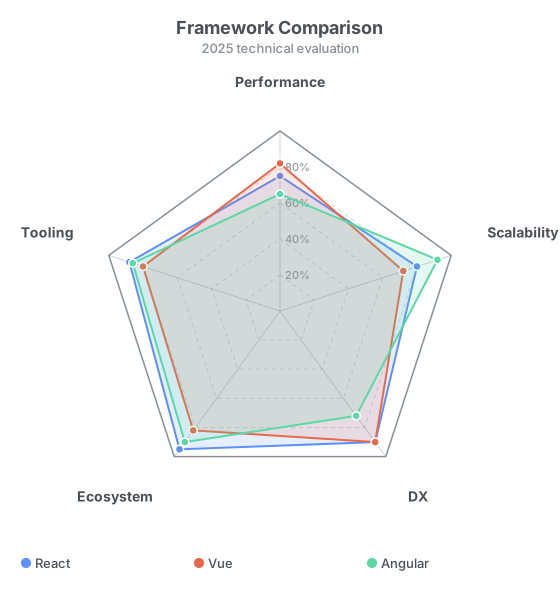
Radar Chart
|
## Features ✨
- 🎨 **Rich visual styles** — light/dark mode, nine built-in palettes (`default`, `antv`, `drawio`, `figma`, `vega`, `mono-blue`, `mono-green`, `mono-purple`, `mono-orange`) plus custom hex arrays; every diagram supports optional title & subtitle, node groups, and color-coded layers
- 📐 **Auto layout** — just describe the graph; x/y coordinates are computed automatically, and diagram dimensions scale to fit the content
- 🤖 **AI-friendly** — single `fig()` entry point accepts a markdown string **or** a JSON config; streaming-safe (partial input never throws); ships a [`SKILL.md`](https://github.com/hustcc/ai-figure/blob/main/SKILL.md) that AI agents (Copilot, Cursor, Claude, etc.) can load as context
- 📊 **13 diagram types** — flowchart, tree, mindmap, architecture, sequence, quadrant, Gantt, state machine, ER data model, timeline, swimlane, bubble chart, and radar chart; pure SVG output with zero DOM dependency, works in browser and Node.js
## Quick Start
### Install
```bash
npm install ai-figure
```
### CDN (browser, no bundler)
```html
```
After loading the script, the library is available as the global `AiFigure`:
```html
```
### Usage
```typescript
import { fig } from 'ai-figure';
// ── JSON config object (typed, programmatic) ────────────────────────────────
const svg = fig({
figure: 'flow',
nodes: [
{ id: 'start', label: 'Start', type: 'terminal' },
{ id: 'process1', label: 'Process Data', type: 'process' },
{ id: 'decision', label: 'Is Valid?', type: 'decision' },
{ id: 'end_yes', label: 'Success', type: 'terminal' },
{ id: 'end_no', label: 'Failure', type: 'terminal' },
],
edges: [
{ from: 'start', to: 'process1' },
{ from: 'process1', to: 'decision' },
{ from: 'decision', to: 'end_yes', label: 'Yes' },
{ from: 'decision', to: 'end_no', label: 'No' },
],
theme: 'light',
palette: 'default',
direction: 'TB',
});
// ── Markdown string (compact, AI-friendly) ──────────────────────────────────
const svg2 = fig(`
figure flow
direction: LR
palette: default
title: Auth Flow
start((Start)) --> login[Enter Credentials]
login --> validate{Valid?}
validate --> dashboard((Dashboard)): yes
validate --> error[Show Error]: no
error --> login
`);
// Browser: inject into the DOM
document.body.innerHTML = svg;
// Node.js: write to file
import { writeFileSync } from 'fs';
writeFileSync('diagram.svg', svg);
```
## API Reference
### `fig(input): string`
The single entry point. Returns a fully self-contained SVG string.
**`input`** is either:
- A **JSON config object** — typed `FigOptions` with the required `figure` field
- A **markdown string** — Mermaid-like syntax, streaming-safe (never throws; partial input returns a valid empty SVG)
```typescript
import { fig } from 'ai-figure';
// JSON config
fig({ figure: 'flow', ...flowOptions }); // flowchart
fig({ figure: 'tree', ...treeOptions }); // tree / hierarchy
fig({ figure: 'mindmap', ...mindmapOptions }); // root-centered mindmap
fig({ figure: 'arch', ...archOptions }); // architecture diagram
fig({ figure: 'sequence', ...sequenceOptions }); // sequence diagram
fig({ figure: 'quadrant', ...quadrantOptions }); // quadrant chart
fig({ figure: 'gantt', ...ganttOptions }); // Gantt chart
fig({ figure: 'state', ...stateOptions }); // state machine
fig({ figure: 'er', ...erOptions }); // ER data model
fig({ figure: 'timeline', ...timelineOptions }); // timeline
fig({ figure: 'swimlane', ...swimlaneOptions }); // swimlane flow
fig({ figure: 'bubble', ...bubbleOptions }); // bubble chart
fig({ figure: 'radar', ...radarOptions }); // radar / spider chart
// markdown string
fig(`figure flow\na[A] --> b[B]`);
```
### `figure: 'flow'` — Flowchart

| Field | Type | Default | Description |
|-------------|-----------------|----------------|------------------------------------------|
| `figure` | `'flow'` | **required** | Selects the flowchart renderer |
| `nodes` | `FlowNode[]` | **required** | List of nodes |
| `edges` | `FlowEdge[]` | **required** | List of directed edges |
| `groups` | `FlowGroup[]` | `[]` | Optional logical groups |
| `title` | `string` | `undefined` | Optional centered title above the diagram |
| `subtitle` | `string` | `undefined` | Optional centered subtitle below the title |
| `theme` | `ThemeType` | `'light'` | Light or dark rendering mode (`'light'` \| `'dark'`) |
| `palette` | `PaletteType` | `'default'` | Color palette — see [Palette API](#palette-api) below |
| `direction` | `Direction` | `'TB'` | Layout direction (`'TB'` or `'LR'`) |
#### `FlowNode`
| Field | Type | Default | Description |
|---------|------------|--------------|----------------------------|
| `id` | `string` | **required** | Unique node identifier |
| `label` | `string` | **required** | Text displayed in the node |
| `type` | `NodeType` | `'process'` | Visual shape |
**Node types (`NodeType`)**
| Value | Shape | Use case |
|------------|---------------------|---------------------------|
| `process` | Rectangle | Default step / action |
| `decision` | Diamond | Conditional / branch |
| `terminal` | Rounded rectangle | Start / End |
| `io` | Parallelogram | Input / Output |
#### `FlowEdge`
| Field | Type | Default | Description |
|---------|----------|--------------|---------------------|
| `from` | `string` | **required** | Source node ID |
| `to` | `string` | **required** | Target node ID |
| `label` | `string` | `undefined` | Optional edge label |
#### `FlowGroup`
| Field | Type | Default | Description |
|---------|------------|--------------|------------------------------------|
| `id` | `string` | **required** | Unique group identifier |
| `label` | `string` | **required** | Label shown above the group border |
| `nodes` | `string[]` | **required** | IDs of nodes inside this group |
### `figure: 'tree'` — Tree Diagram
Renders a hierarchy from a flat node list with `parent` references. Uses Dagre for layout.

| Field | Type | Default | Description |
|-------------|---------------|----------------|------------------------------------|
| `figure` | `'tree'` | **required** | Selects the tree renderer |
| `nodes` | `TreeNode[]` | **required** | Flat list with optional parent ref |
| `title` | `string` | `undefined` | Optional centered title above the diagram |
| `subtitle` | `string` | `undefined` | Optional centered subtitle below the title |
| `theme` | `ThemeType` | `'light'` | Light or dark rendering mode (`'light'` \| `'dark'`) |
| `palette` | `PaletteType` | `'default'` | Color palette — see [Palette API](#palette-api) below |
| `direction` | `Direction` | `'TB'` | Layout direction |
```typescript
fig({
figure: 'tree',
nodes: [
{ id: 'ceo', label: 'CEO' },
{ id: 'cto', label: 'CTO', parent: 'ceo' },
{ id: 'coo', label: 'COO', parent: 'ceo' },
],
theme: 'light',
palette: 'default',
});
```
### `figure: 'mindmap'` — Mindmap Diagram
Renders a root-centered mindmap. First-level branches are auto-balanced across left/right unless explicit `side` is provided.

| Field | Type | Default | Description |
|------------|--------------------|--------------|-------------|
| `figure` | `'mindmap'` | **required** | Selects the mindmap renderer |
| `nodes` | `MindmapNode[]` | **required** | Flat list with optional `parent` and `side` |
| `title` | `string` | `undefined` | Optional centered title above the diagram |
| `subtitle` | `string` | `undefined` | Optional centered subtitle below the title |
| `theme` | `ThemeType` | `'light'` | Light or dark rendering mode (`'light'` \| `'dark'`) |
| `palette` | `PaletteType` | `'default'` | Color palette — see [Palette API](#palette-api) below |
#### `MindmapNode`
| Field | Type | Default | Description |
|----------|-----------------------|--------------|-------------|
| `id` | `string` | **required** | Unique node identifier |
| `label` | `string` | **required** | Text displayed in the node |
| `parent` | `string` | `undefined` | Parent node id (omit for root) |
| `side` | `'left' \| 'right'` | auto | Optional preferred branch side (best for root-level children) |
```typescript
fig({
figure: 'mindmap',
title: 'Product Strategy',
nodes: [
{ id: 'root', label: 'Product Strategy' },
{ id: 'market', label: 'Market', parent: 'root', side: 'left' },
{ id: 'tech', label: 'Technology', parent: 'root', side: 'right' },
{ id: 'smb', label: 'SMB', parent: 'market' },
{ id: 'ai', label: 'AI Features', parent: 'tech' },
],
});
```
### `figure: 'arch'` — Architecture Diagram
Renders a tech-stack landscape as layered, color-coded cards — no edges needed.

| Field | Type | Default | Description |
|-------------|---------------|----------------|------------------------------------------|
| `figure` | `'arch'` | **required** | Selects the architecture renderer |
| `layers` | `ArchLayer[]` | **required** | Layers from top to bottom (TB) or left to right (LR) |
| `title` | `string` | `undefined` | Optional centered title above the diagram |
| `subtitle` | `string` | `undefined` | Optional centered subtitle below the title |
| `theme` | `ThemeType` | `'light'` | Light or dark rendering mode (`'light'` \| `'dark'`) |
| `palette` | `PaletteType` | `'default'` | Color palette — see [Palette API](#palette-api) below |
| `direction` | `Direction` | `'TB'` | `'TB'` = layers stacked, `'LR'` = layers side-by-side |
```typescript
fig({
figure: 'arch',
layers: [
{ id: 'fe', label: 'Frontend', nodes: [{ id: 'react', label: 'React' }, { id: 'vue', label: 'Vue' }] },
{ id: 'be', label: 'Backend', nodes: [{ id: 'node', label: 'Node.js' }] },
],
});
```
### `figure: 'sequence'` — Sequence Diagram
Renders a sequence diagram with vertical lifelines and horizontal message arrows.

| Field | Type | Default | Description |
|------------|----------------|----------------|---------------------------------------|
| `figure` | `'sequence'` | **required** | Selects the sequence renderer |
| `actors` | `string[]` | **required** | Ordered list of participant names |
| `messages` | `SeqMessage[]` | **required** | Ordered list of message arrows |
| `title` | `string` | `undefined` | Optional centered title above the diagram |
| `subtitle` | `string` | `undefined` | Optional centered subtitle below the title |
| `theme` | `ThemeType` | `'light'` | Light or dark rendering mode (`'light'` \| `'dark'`) |
| `palette` | `PaletteType` | `'default'` | Color palette — see [Palette API](#palette-api) below |
```typescript
fig({
figure: 'sequence',
actors: ['Browser', 'API', 'DB'],
messages: [
{ from: 'Browser', to: 'API', label: 'POST /login' },
{ from: 'API', to: 'DB', label: 'SELECT user' },
{ from: 'DB', to: 'API', label: 'user row', style: 'return' },
{ from: 'API', to: 'Browser', label: '200 OK', style: 'return' },
],
});
```
### `figure: 'quadrant'` — Quadrant Chart
Renders a 2D quadrant scatter plot. Points are placed by normalized `x`/`y` values (0–1) and auto-colored by which quadrant they fall in.

| Field | Type | Default | Description |
|-------------|--------------------|----------------|-----------------------------------------------------|
| `figure` | `'quadrant'` | **required** | Selects the quadrant renderer |
| `xAxis` | `AxisConfig` | **required** | X-axis label, min and max tick labels |
| `yAxis` | `AxisConfig` | **required** | Y-axis label, min and max tick labels |
| `quadrants` | `[TL, TR, BL, BR]` | **required** | Corner labels: top-left, top-right, bottom-left, bottom-right |
| `points` | `QuadrantPoint[]` | **required** | Data points to plot |
| `title` | `string` | `undefined` | Optional centered title above the diagram |
| `subtitle` | `string` | `undefined` | Optional centered subtitle below the title |
| `theme` | `ThemeType` | `'light'` | Light or dark rendering mode (`'light'` \| `'dark'`) |
| `palette` | `PaletteType` | `'default'` | Color palette — see [Palette API](#palette-api) below |
#### `AxisConfig`
| Field | Type | Description |
|---------|----------|--------------------------|
| `label` | `string` | Axis title |
| `min` | `string` | Label at the low end |
| `max` | `string` | Label at the high end |
#### `QuadrantPoint`
| Field | Type | Description |
|---------|----------|-----------------------------------------|
| `id` | `string` | Unique identifier |
| `label` | `string` | Text shown next to the point |
| `x` | `number` | Normalized X position (0 = left, 1 = right) |
| `y` | `number` | Normalized Y position (0 = bottom, 1 = top) |
```typescript
fig({
figure: 'quadrant',
xAxis: { label: 'Effort', min: 'Low', max: 'High' },
yAxis: { label: 'Value', min: 'Low', max: 'High' },
quadrants: ['Quick Wins', 'Major Projects', 'Fill-ins', 'Thankless Tasks'],
points: [
{ id: 'a', label: 'Feature A', x: 0.2, y: 0.85 },
{ id: 'b', label: 'Feature B', x: 0.75, y: 0.80 },
{ id: 'c', label: 'Feature C', x: 0.5, y: 0.6 },
{ id: 'd', label: 'Feature D', x: 0.3, y: 0.2 },
{ id: 'e', label: 'Feature E', x: 0.8, y: 0.25 },
],
theme: 'light',
palette: 'default',
});
```
### `figure: 'gantt'` — Gantt Chart
Renders a project timeline with task bars, optional group headers, and milestone markers. Canvas width is fixed at 804 px; height auto-adapts to the number of rows. The time axis ticks adjust automatically to the date range (weekly / monthly / quarterly).

| Field | Type | Default | Description |
|--------------|--------------------|--------------|----------------------------------------------|
| `figure` | `'gantt'` | **required** | Selects the Gantt renderer |
| `tasks` | `GanttTask[]` | **required** | List of task bars |
| `milestones` | `GanttMilestone[]` | `[]` | Optional milestone markers |
| `title` | `string` | `undefined` | Optional centered title above the diagram |
| `subtitle` | `string` | `undefined` | Optional centered subtitle below the title |
| `theme` | `ThemeType` | `'light'` | Light or dark rendering mode |
| `palette` | `PaletteType` | `'default'` | Color palette — see [Palette API](#palette-api) below |
#### `GanttTask`
| Field | Type | Default | Description |
|-----------|----------|--------------|--------------------------------------------------------------------|
| `id` | `string` | **required** | Unique task identifier |
| `label` | `string` | **required** | Task name shown in the label column and inside the bar |
| `start` | `string` | **required** | Start date `yyyy-mm-dd` |
| `end` | `string` | **required** | End date `yyyy-mm-dd` |
| `groupId` | `string` | `undefined` | Tasks sharing the same `groupId` are clustered under a group header |
| `color` | `string` | `undefined` | Optional custom bar color (6-digit hex, e.g. `'#e64980'`) |
#### `GanttMilestone`
| Field | Type | Default | Description |
|---------|----------|--------------|-----------------------------------|
| `date` | `string` | **required** | Milestone date `yyyy-mm-dd` |
| `label` | `string` | **required** | Short label near the diamond icon |
```typescript
fig({
figure: 'gantt',
title: 'Project Roadmap',
tasks: [
{ id: 'design', label: 'Design', start: '2025-01-06', end: '2025-01-24' },
{ id: 'fe', label: 'Frontend Dev', start: '2025-01-20', end: '2025-02-28', groupId: 'dev' },
{ id: 'be', label: 'Backend Dev', start: '2025-01-13', end: '2025-03-07', groupId: 'dev' },
{ id: 'qa', label: 'QA Testing', start: '2025-02-24', end: '2025-03-14', groupId: 'qa' },
{ id: 'deploy', label: 'Deploy', start: '2025-03-17', end: '2025-03-21' },
],
milestones: [
{ date: '2025-01-24', label: 'Design freeze' },
{ date: '2025-03-21', label: 'Launch' },
],
theme: 'light',
palette: 'default',
});
```
### `figure: 'state'` — State Machine
Renders a UML state machine with dagre layout. Supports start (●) and end (◎) pseudo-states, accent states, self-loops, and labeled transitions.

| Field | Type | Default | Description |
|---------------|-----------------------|--------------|----------------------------------------------|
| `figure` | `'state'` | **required** | Selects the state machine renderer |
| `nodes` | `StateNode[]` | **required** | List of states |
| `transitions` | `StateTransition[]` | **required** | List of directed transitions |
| `title` | `string` | `undefined` | Optional centered title above the diagram |
| `subtitle` | `string` | `undefined` | Optional centered subtitle below the title |
| `theme` | `ThemeType` | `'light'` | Light or dark rendering mode |
| `palette` | `PaletteType` | `'default'` | Color palette — see [Palette API](#palette-api) below |
#### `StateNode`
| Field | Type | Default | Description |
|----------|------------------|-------------|-------------------------------------------------------|
| `id` | `string` | **required**| Unique state identifier |
| `label` | `string` | **required**| Text displayed in the state box |
| `type` | `StateNodeType` | `'state'` | `'state'` \| `'start'` \| `'end'` |
| `accent` | `boolean` | `false` | Highlight this state with the accent color (max 1–2) |
#### `StateTransition`
| Field | Type | Default | Description |
|---------|----------|--------------|-------------------------------------------------------|
| `from` | `string` | **required** | Source state ID |
| `to` | `string` | **required** | Target state ID |
| `label` | `string` | `undefined` | Optional label — typically `event [guard] / action` |
```typescript
fig({
figure: 'state',
title: 'Order Status',
nodes: [
{ id: 'start', label: '', type: 'start' },
{ id: 'idle', label: 'Idle' },
{ id: 'processing', label: 'Processing' },
{ id: 'shipped', label: 'Shipped' },
{ id: 'failed', label: 'Failed', accent: true },
{ id: 'end', label: '', type: 'end' },
],
transitions: [
{ from: 'start', to: 'idle' },
{ from: 'idle', to: 'processing', label: 'place order' },
{ from: 'processing', to: 'shipped', label: 'confirmed' },
{ from: 'processing', to: 'failed', label: 'error' },
{ from: 'failed', to: 'idle', label: 'retry' },
{ from: 'shipped', to: 'end' },
],
});
```
### `figure: 'er'` — Entity-Relationship Diagram
Renders a database schema with entity boxes (header + field list) and relationship lines with optional cardinality annotations.

| Field | Type | Default | Description |
|------------|----------------|--------------|----------------------------------------------|
| `figure` | `'er'` | **required** | Selects the ER renderer |
| `entities` | `ErEntity[]` | **required** | List of entities (tables) |
| `relations`| `ErRelation[]` | **required** | List of relationship lines |
| `title` | `string` | `undefined` | Optional centered title above the diagram |
| `subtitle` | `string` | `undefined` | Optional centered subtitle below the title |
| `theme` | `ThemeType` | `'light'` | Light or dark rendering mode |
| `palette` | `PaletteType` | `'default'` | Color palette — see [Palette API](#palette-api) below |
#### `ErEntity`
| Field | Type | Default | Description |
|----------|-------------|--------------|--------------------------------------------------------------|
| `id` | `string` | **required** | Unique entity identifier |
| `label` | `string` | **required** | Entity display name shown in the header |
| `fields` | `ErField[]` | **required** | Ordered list of fields (columns) |
| `accent` | `boolean` | `false` | Highlight as the aggregate root (max 1) |
#### `ErField`
| Field | Type | Default | Description |
|--------|---------------|--------------|-------------------------------------------------|
| `name` | `string` | **required** | Field name |
| `type` | `string` | `undefined` | Data type string (e.g. `'uuid'`, `'text'`) |
| `key` | `'pk'\|'fk'` | `undefined` | `'pk'` = primary key (#), `'fk'` = foreign key (→) |
#### `ErRelation`
| Field | Type | Default | Description |
|------------|----------|--------------|----------------------------------------------------|
| `from` | `string` | **required** | Source entity ID |
| `to` | `string` | **required** | Target entity ID |
| `label` | `string` | `undefined` | Optional label centered on the line |
| `fromCard` | `string` | `undefined` | Cardinality at the `from` end (e.g. `'1'`, `'N'`) |
| `toCard` | `string` | `undefined` | Cardinality at the `to` end |
```typescript
fig({
figure: 'er',
title: 'Blog Schema',
entities: [
{ id: 'user', label: 'User',
fields: [{ name: 'id', type: 'uuid', key: 'pk' }, { name: 'email', type: 'text' }] },
{ id: 'post', label: 'Post',
fields: [{ name: 'id', type: 'uuid', key: 'pk' }, { name: 'author_id', type: 'uuid', key: 'fk' }] },
],
relations: [
{ from: 'user', to: 'post', label: 'writes', fromCard: '1', toCard: 'N' },
],
});
```
### `figure: 'timeline'` — Timeline
Renders a horizontal date axis with events spaced proportionally. Labels alternate above and below the axis to reduce collision. Major milestones are rendered with a larger accent dot.

| Field | Type | Default | Description |
|------------|-------------------|--------------|----------------------------------------------|
| `figure` | `'timeline'` | **required** | Selects the timeline renderer |
| `events` | `TimelineEvent[]` | **required** | List of events (auto-sorted by date) |
| `title` | `string` | `undefined` | Optional centered title above the diagram |
| `subtitle` | `string` | `undefined` | Optional centered subtitle below the title |
| `theme` | `ThemeType` | `'light'` | Light or dark rendering mode |
| `palette` | `PaletteType` | `'default'` | Color palette — see [Palette API](#palette-api) below |
#### `TimelineEvent`
| Field | Type | Default | Description |
|-------------|-----------|--------------|------------------------------------------------------|
| `id` | `string` | **required** | Unique event identifier |
| `label` | `string` | **required** | Short label displayed near the event dot |
| `date` | `string` | **required** | Event date in `yyyy-mm-dd` format |
| `milestone` | `boolean` | `false` | Render as a major milestone (larger accent-color dot)|
```typescript
fig({
figure: 'timeline',
title: 'Product History',
events: [
{ id: 'v1', label: 'v1.0 Launch', date: '2020-01-15', milestone: true },
{ id: 'v15', label: 'v1.5 Patch', date: '2021-06-01' },
{ id: 'v2', label: 'v2.0 Redesign', date: '2022-03-10', milestone: true },
{ id: 'v3', label: 'v3.0 AI', date: '2023-11-01', milestone: true },
],
});
```
### `figure: 'swimlane'` — Swimlane Flow
Renders a cross-functional flowchart with horizontal lane bands. Nodes are placed in their declared lane; cross-lane edges use S-curve routing.

| Field | Type | Default | Description |
|------------|-------------------|--------------|----------------------------------------------|
| `figure` | `'swimlane'` | **required** | Selects the swimlane renderer |
| `lanes` | `string[]` | **required** | Lane labels in display order |
| `nodes` | `SwimlaneNode[]` | **required** | Nodes placed inside their respective lanes |
| `edges` | `SwimlaneEdge[]` | **required** | Directed edges between nodes |
| `title` | `string` | `undefined` | Optional centered title above the diagram |
| `subtitle` | `string` | `undefined` | Optional centered subtitle below the title |
| `theme` | `ThemeType` | `'light'` | Light or dark rendering mode |
| `palette` | `PaletteType` | `'default'` | Color palette — see [Palette API](#palette-api) below |
#### `SwimlaneNode`
| Field | Type | Default | Description |
|---------|------------|--------------|------------------------------------------|
| `id` | `string` | **required** | Unique node identifier |
| `label` | `string` | **required** | Text displayed in the node |
| `lane` | `string` | **required** | Lane label this node belongs to |
| `type` | `NodeType` | `'process'` | Visual shape (same as flowchart nodes) |
#### `SwimlaneEdge`
| Field | Type | Default | Description |
|---------|----------|--------------|---------------------|
| `from` | `string` | **required** | Source node ID |
| `to` | `string` | **required** | Target node ID |
| `label` | `string` | `undefined` | Optional edge label |
```typescript
fig({
figure: 'swimlane',
title: 'Order Processing',
lanes: ['Customer', 'Warehouse', 'Shipping'],
nodes: [
{ id: 'order', label: 'Place Order', lane: 'Customer' },
{ id: 'pay', label: 'Confirm Payment', lane: 'Customer' },
{ id: 'receive', label: 'Receive Order', lane: 'Warehouse' },
{ id: 'pack', label: 'Pack Items', lane: 'Warehouse' },
{ id: 'ship', label: 'Ship Package', lane: 'Shipping' },
],
edges: [
{ from: 'order', to: 'pay' },
{ from: 'pay', to: 'receive' },
{ from: 'receive', to: 'pack' },
{ from: 'pack', to: 'ship' },
],
});
```
### `figure: 'bubble'` — Bubble Chart
Renders a packed-bubble chart where each item's area is proportional to its value. Positions are computed automatically by a greedy circle-packing algorithm — no coordinates needed. Bubbles pulse with a subtle SMIL animation for a lively visual effect.

| Field | Type | Default | Description |
|------------|-----------------|--------------|-----------------------------------------------|
| `figure` | `'bubble'` | **required** | Selects the bubble chart renderer |
| `items` | `BubbleItem[]` | **required** | Bubble data items |
| `title` | `string` | `undefined` | Optional centered title above the diagram |
| `subtitle` | `string` | `undefined` | Optional centered subtitle below the title |
| `theme` | `ThemeType` | `'light'` | Light or dark rendering mode |
| `palette` | `PaletteType` | `'default'` | Color palette — see [Palette API](#palette-api) below |
#### `BubbleItem`
| Field | Type | Default | Description |
|---------|----------|--------------|--------------------------------------------------------|
| `id` | `string` | `undefined` | Optional unique identifier |
| `label` | `string` | **required** | Text label displayed inside or below the bubble |
| `value` | `number` | **required** | Positive number — bubble area is proportional to value |
```typescript
fig({
figure: 'bubble',
title: 'Market Analysis',
items: [
{ label: 'Product A', value: 75 },
{ label: 'Product B', value: 50 },
{ label: 'Product C', value: 85 },
],
palette: 'default',
});
```
### `figure: 'radar'` — Radar / Spider Chart
Renders a radar (spider / web) chart with multiple overlaid polygon series. Each axis is a spoke radiating from the centre; values 0–100 map to 0–100% of the axis radius. Multiple series are overlaid with translucent fills so they remain readable when they overlap. A legend below the chart labels each series.

| Field | Type | Default | Description |
|------------|-----------------|--------------|-----------------------------------------------|
| `figure` | `'radar'` | **required** | Selects the radar chart renderer |
| `axes` | `string[]` | **required** | Ordered list of axis labels (3 or more recommended) |
| `series` | `RadarSeries[]` | **required** | One or more data series to overlay |
| `title` | `string` | `undefined` | Optional centered title above the diagram |
| `subtitle` | `string` | `undefined` | Optional centered subtitle below the title |
| `theme` | `ThemeType` | `'light'` | Light or dark rendering mode |
| `palette` | `PaletteType` | `'default'` | Color palette — see [Palette API](#palette-api) below |
#### `RadarSeries`
| Field | Type | Default | Description |
|----------|------------|--------------|---------------------------------------------------------------|
| `label` | `string` | **required** | Series name shown in the legend |
| `values` | `number[]` | **required** | One value per axis in the same order as `axes` (range 0–100) |
```typescript
fig({
figure: 'radar',
title: 'Framework Comparison',
axes: ['Performance', 'Scalability', 'DX', 'Ecosystem', 'Tooling'],
series: [
{ label: 'React', values: [75, 80, 90, 95, 88] },
{ label: 'Vue', values: [82, 72, 90, 82, 80] },
{ label: 'Angular', values: [65, 92, 72, 90, 86] },
],
palette: 'antv',
});
```
### Palette API
All thirteen diagram types accept two independent styling parameters:
| Field | Type | Default | Description |
|-----------|------------------------|---------------|--------------------------------------|
| `theme` | `'light' \| 'dark'` | `'light'` | Background and text rendering mode |
| `palette` | `string \| string[]` | `'default'` | Color palette for nodes |
**`palette` values:**
| Value | Description |
|-------|-------------|
| `'default'` | Built-in multi-hue palette — `process`=blue, `decision`=amber, `terminal`=green, `io`=purple |
| `'antv'` | AntV G2 categorical palette — cornflower-blue, coral-orange, mint-teal, violet |
| `'drawio'` | draw.io / diagrams.net shape palette — sky-blue, amber, sage, red |
| `'figma'` | Figma / design-tool palette — indigo, cyan, emerald, rose-pink |
| `'vega'` | Vega / Vega-Lite categorical palette — steel-blue, orange, teal, crimson |
| `'mono-blue'` | Monochrome blue — all four node types use blue-family shades |
| `'mono-green'` | Monochrome green — all four node types use green-family shades |
| `'mono-purple'` | Monochrome purple — all four node types use purple-family shades |
| `'mono-orange'` | Monochrome orange — all four node types use orange-family shades |
| `string[]` | 4-element hex array mapped to `[process, decision, terminal, io]` |
```typescript
// Built-in palette, dark mode
fig({ figure: 'flow', nodes, edges, theme: 'dark', palette: 'default' });
// AntV G2 palette
fig({ figure: 'flow', nodes, edges, palette: 'antv' });
// draw.io palette with dark background
fig({ figure: 'flow', nodes, edges, theme: 'dark', palette: 'drawio' });
// Monochrome blue
fig({ figure: 'flow', nodes, edges, palette: 'mono-blue' });
// Custom hex palette
fig({ figure: 'flow', nodes, edges, palette: ['#e64980', '#ae3ec9', '#7048e8', '#1098ad'] });
```
### Markdown syntax
`fig()` also accepts a plain **markdown string** as input. The first non-empty line must be `figure `. Config, data, and comment lines follow.
| Line type | Syntax | Example |
|-----------|--------|---------|
| Header | `figure ` | `figure flow` |
| Config | `key: value` | `direction: LR` · `palette: antv` · `title: My Chart` |
| Comment | `%% text` | `%% ignored` |
| Data | diagram-specific | see per-diagram syntax below |
Config keys available in all diagram types: `title`, `subtitle`, `theme` (`light`\|`dark`), `palette`, `direction` (`TB`\|`LR`).
#### Node notation (flow / tree / mindmap / arch)
| Notation | Shape |
|----------|-------|
| `id[label]` | process (rectangle) |
| `id{label}` | decision (diamond) |
| `id((label))` | terminal (pill) |
| `id[/label/]` | io (parallelogram) |
| `id` | process (bare id used as label) |
#### Per-diagram syntax
flow
```
figure flow
direction: LR
title: Optional Title
subtitle: Optional Subtitle
id[Label] %% standalone node definition
A[Source] --> B[Target] %% edge
A --> B[Target]: label %% labeled edge
group GroupName: id1, id2, id3 %% logical group
```
tree
```
figure tree
direction: LR
title: Optional Title
root[Root] %% root node (no parent)
root --> child[Child] %% parent → child relationship
```
arch
```
figure arch
direction: TB
title: Optional Title
layer Layer Label %% layer declaration (label serves as id)
nodeId[Node Label] %% node in current layer (indentation optional)
```
mindmap
```
figure mindmap
title: Optional Title
subtitle: Optional Subtitle
root[Root Topic]
root --> leftBranch[Left Branch]
root --> rightBranch[Right Branch]
leftBranch --> leaf[Leaf]
```
sequence
```
figure sequence
title: Optional Title
actors: Actor1, Actor2, Actor3 %% optional; inferred from messages if omitted
Actor1 -> Actor2: message %% solid arrow
Actor2 --> Actor1: response %% dashed return arrow
Actor1 -> Actor2 %% arrow without label
```
quadrant
```
figure quadrant
title: Optional Title
x-axis: min .. max %% axis range (label defaults to "")
x-axis Label: min .. max %% axis range with explicit axis label
y-axis: min .. max
quadrant-1: Top-Left Name %% 1=TL, 2=TR, 3=BL, 4=BR
quadrant-2: Top-Right Name
quadrant-3: Bottom-Left Name
quadrant-4: Bottom-Right Name
Point Label: 0.3, 0.7 %% data point (x, y in [0, 1])
```
gantt
```
figure gantt
title: Optional Title
section Section Name %% group header (applied to subsequent tasks)
Task Label: id, start, end %% task bar (dates: yyyy-mm-dd)
milestone: Label, date %% milestone diamond
```
state
```
figure state
title: Optional Title
idle[Idle] %% normal state (rounded rectangle)
accent: failed %% highlight as focal/error state
start --> idle %% start pseudo-state → first state
idle --> processing: order placed %% transition with optional label
processing --> end: shipped %% end pseudo-state
```
er
```
figure er
title: Optional Title
entity User %% entity declaration (name = id = label)
id pk: uuid %% field: name [pk|fk]: type
email: text
name %% bare field (no type)
entity Post
id pk: uuid
author_id fk: uuid
User --> Post: writes %% relationship line
accent: User %% mark as aggregate root
```
timeline
```
figure timeline
title: Optional Title
2020-01-15: v1.0 Launch milestone %% major milestone (larger accent dot)
2021-06-01: v1.5 Patch
2022-03-10: v2.0 Redesign milestone
```
swimlane
```
figure swimlane
title: Optional Title
section Customer %% declare lane (subsequent nodes belong here)
order[Place Order] %% node in current lane
pay[Confirm Payment]
section Warehouse
pack[Pack Items]
section Shipping
ship[Ship Package]
order --> pack %% edges between nodes
pack --> ship
```
bubble
```
figure bubble
title: Optional Title
%% e.g. "Product A: 75"
Label: value
```
radar
```
figure radar
title: Optional Title
%% axes: comma-separated axis labels
axes: Axis1, Axis2, Axis3, ...
%% one value (0-100) per axis
Series A: 80, 70, 90, ...
Series B: 60, 85, 75, ...
```
## Using with AI
This library ships a **[`SKILL.md`](https://github.com/hustcc/ai-figure/blob/main/SKILL.md)** — a machine-readable skill file that AI agents (Copilot, Cursor, Claude, etc.) can load as context.
```
# Load the skill into your AI context:
@SKILL.md
```
`fig()` accepts a plain markdown string, which makes it ideal for AI generation:
- **Streaming-safe** — partial output never throws; the diagram fills in progressively as more tokens arrive
- **Compact** — the markdown syntax is ~5× shorter than an equivalent JSON config
**Prompt example:**
> "Draw a flowchart showing the user login process."
**AI-generated code:**
```typescript
import { fig } from 'ai-figure';
const svg = fig(`
figure flow
direction: TB
palette: default
title: User Login
start((Start)) --> creds[Enter Credentials]
creds --> validate{Valid?}
validate --> dashboard((Dashboard)): yes
validate --> error[Show Error]: no
error --> creds
dashboard --> done((End))
`);
```
## Development
```bash
# Install dependencies
npm install
# Build (ESM + CJS)
npm run build
# Run tests
npm test
# Type check
npm run typecheck
# Start browser demo (after building)
npx serve .
# Then open: http://localhost:3000/index.html
```
## License
MIT © [hustcc](https://github.com/hustcc)