
# JavaScript Embedded Analytics

<div align="center">
    <picture>
        <source media="(prefers-color-scheme: dark)" srcset="https://ag-grid.com/studio/images/ag-studio-logo-dark.svg"/>
        <source media="(prefers-color-scheme: light)" srcset="https://ag-grid.com/studio/images/ag-studio-logo.svg"/>
        <img width="100%" alt="AG Studio Logo" src="https://ag-grid.com/studio/images/ag-studio-logo.svg"/>
    </picture>
    <div align="center">
        <h4><a href="https://ag-grid.com/studio/">Website</a> · <a href="https://ag-grid.com/studio/javascript/overview/">Documentation</a> · <a href="https://ag-grid.com/studio/example/">Live Demo</a></h4>
    </div>
    <br>
    <a href="https://www.npmjs.com/package/ag-studio">
        <img src="https://img.shields.io/npm/v/ag-studio?style=for-the-badge" alt="NPM Version">
    </a>
    <a href="https://www.npmjs.com/package/ag-studio">
        <img src="https://img.shields.io/npm/dm/ag-studio?style=for-the-badge" alt="NPM Downloads">
    </a>
    <br><br>
    <!-- START MAIN DESCRIPTION -->
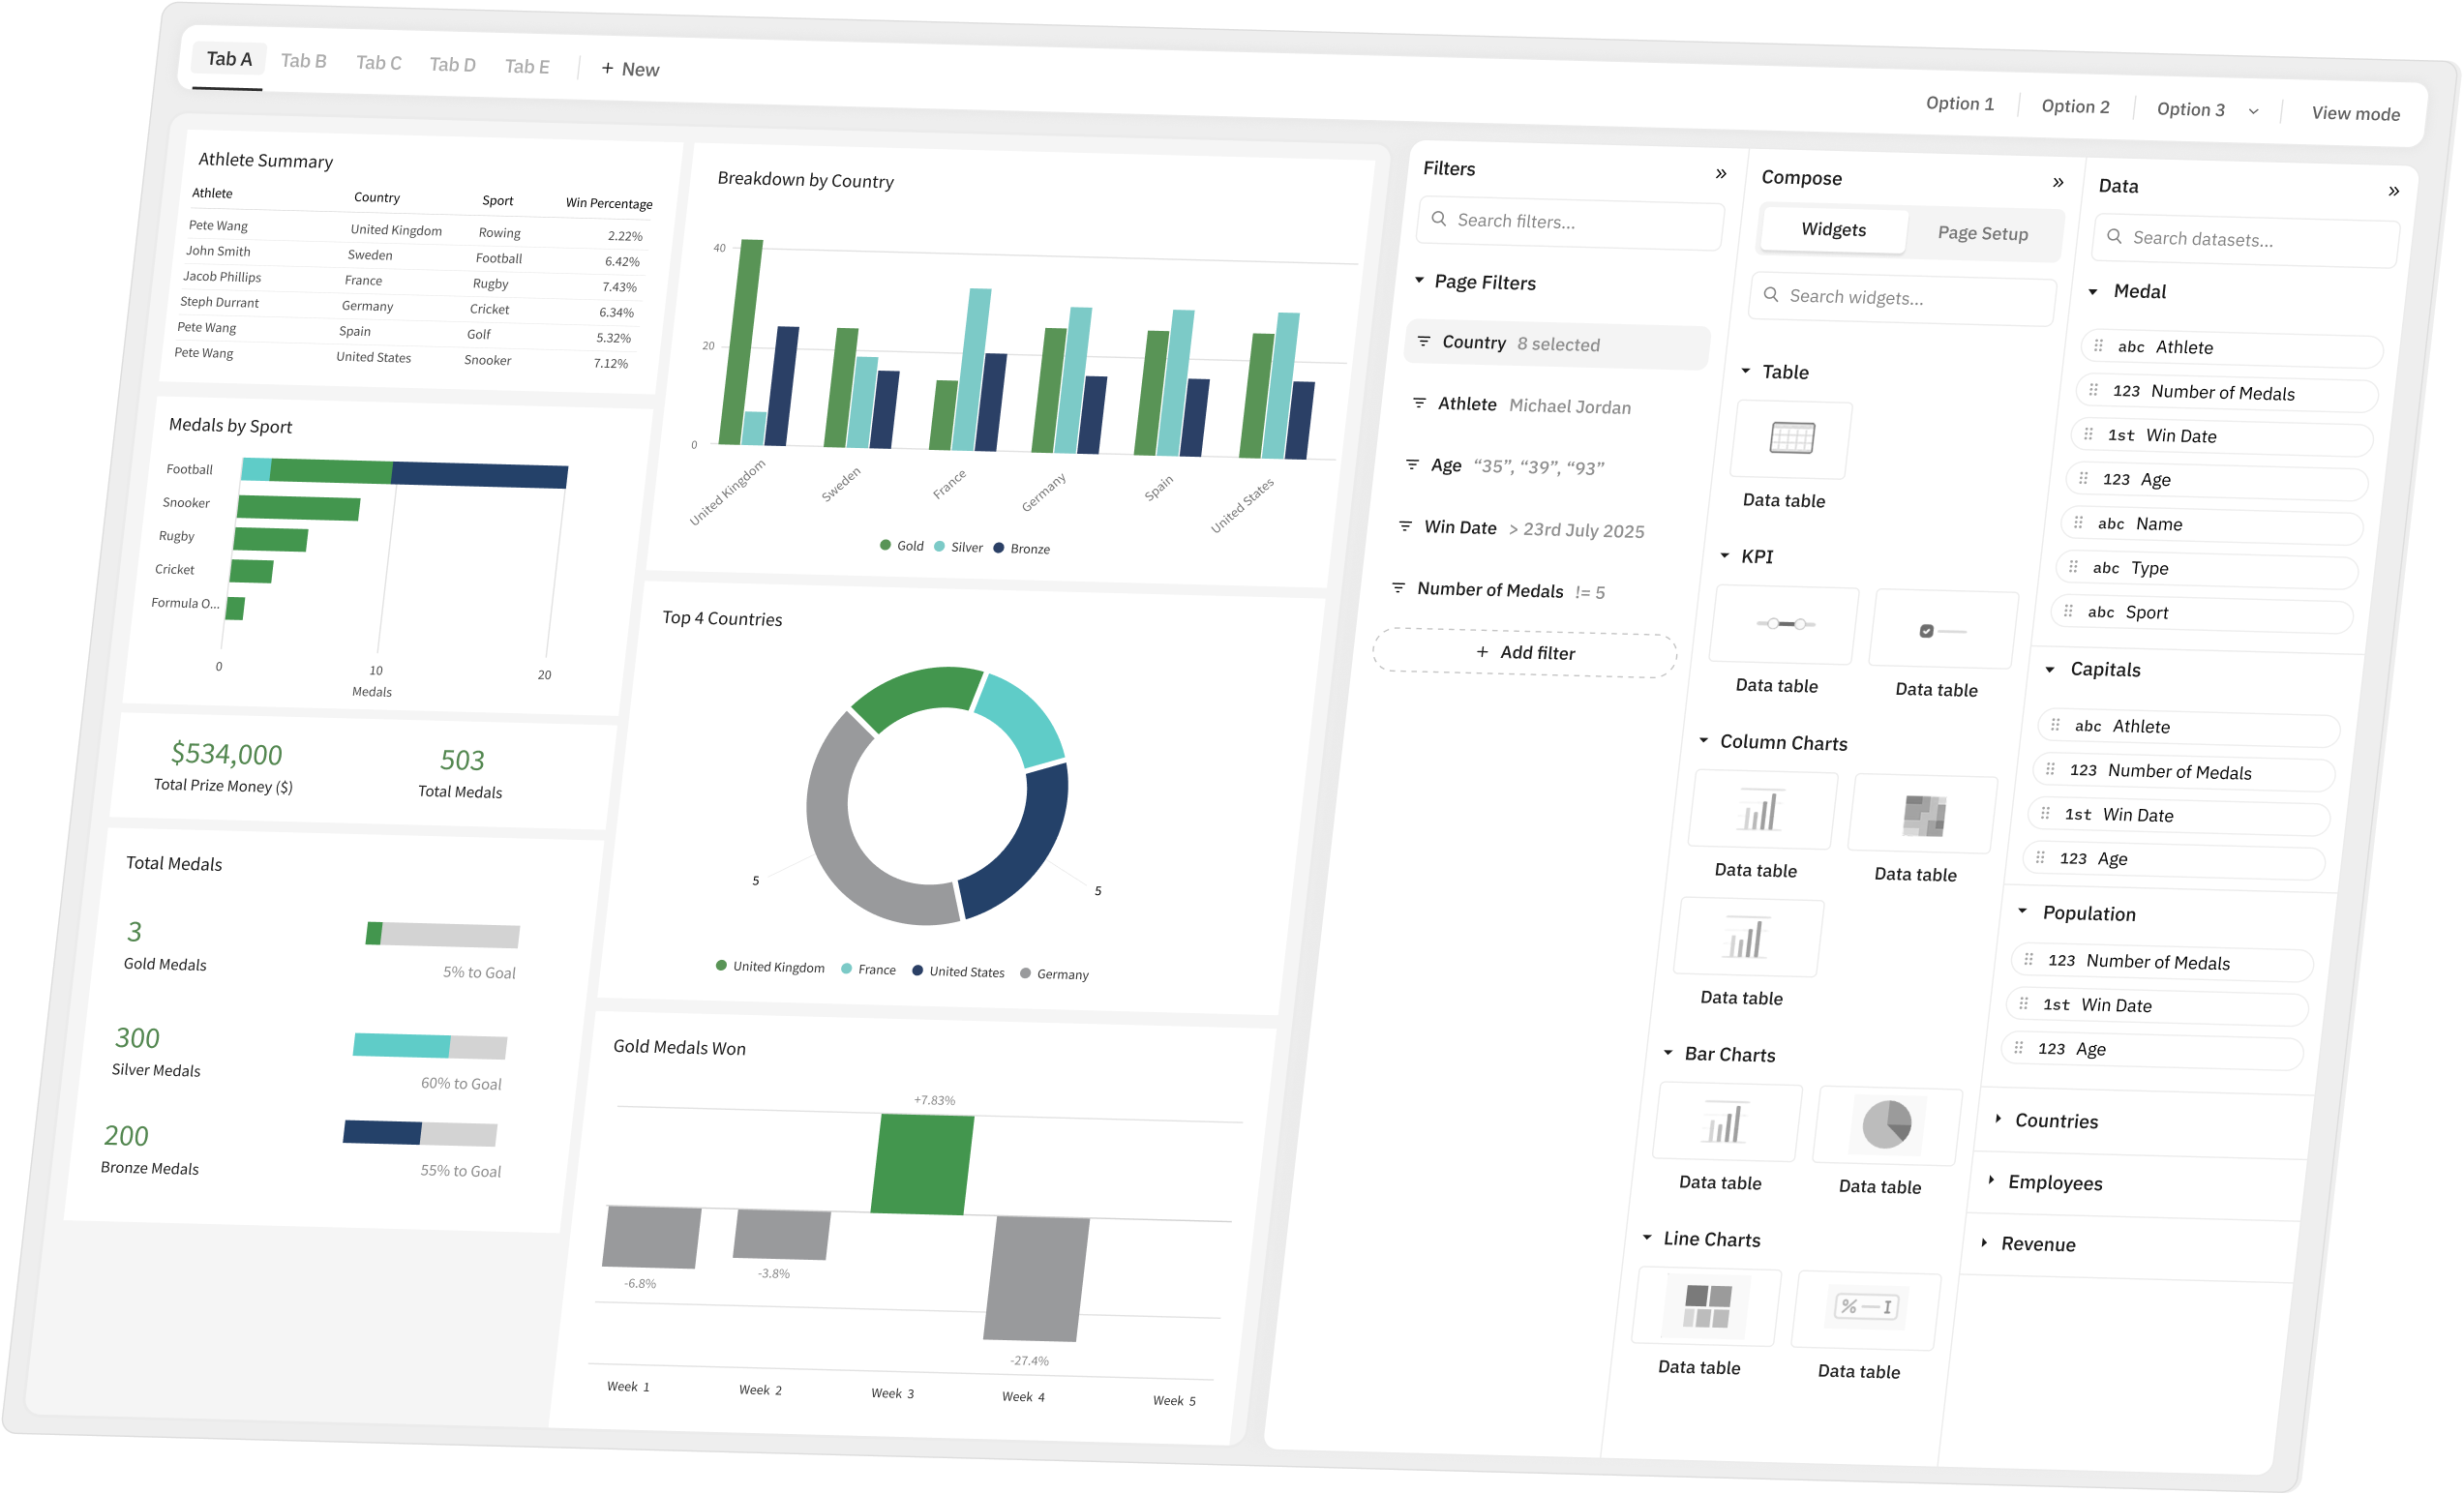
    <p>AG Studio is a JavaScript Embedded Analytics component for creating dashboards. It's built on top of <a href="https://ag-grid.com">AG Grid</a> and <a href="https://ag-grid.com/charts">AG Charts</a>, and comes with support for <strong><a href="https://ag-grid.com/studio/react/overview/"><img src="https://ag-grid.com/images/fw-logos/react.svg" height="16" width="16" alt="React Logo"> React</a></strong>, <strong><a href="https://ag-grid.com/studio/angular/overview/"><img src="https://ag-grid.com/images/fw-logos/angular.svg" height="16" width="16" alt="Angular Logo"> Angular</a></strong> and <strong><a href="https://ag-grid.com/studio/vue/overview/"><img src="https://ag-grid.com/images/fw-logos/vue.svg" height="16" width="16" alt="Vue Logo"> Vue</a></strong>.</p>
    <!-- END MAIN DESCRIPTION -->
    <br>
</div>

<picture>
    <source srcset="https://ag-grid.com/studio/images/studio-footer.png" media="(prefers-color-scheme: light)">
    <source srcset="https://ag-grid.com/studio/images/studio-footer-dark.png" media="(prefers-color-scheme: dark)">
    <img src="https://ag-grid.com/studio/images/studio-footer.png" alt="AG Studio Preview">
</picture>
<div align="right">
    <a href="https://ag-grid.com/studio/example/"><br><img alt="Live Demo" src="https://img.shields.io/badge/ag--grid.com%2Fstudio-Live%20Demo-blue?style=for-the-badge"></a>
</div>

## Overview

AG Studio is an embedded analytics component that lets analysts build interactive dashboards on top of your data. Add a single component to your application, configure your data source and get drag-and-drop report building with advanced cross-filtering, powered by a built-in data engine.

### How it Works

Your application owns the surrounding shell: routing, authentication, data fetching, persistence, whilst AG Studio handles everything inside the component boundary: the canvas, widgets, drag-and-drop, and filtering, all powered by a built-in data engine that runs entirely in the browser.

Once configured, analysts can use the drag-and-drop UI to create self-serve reports, and end users can then interact with those reports to interrogate their data with cross-filters and page-level filters.

You can ship pre-built reports in code so users see a finished dashboard on first load, or let analysts create reports from scratch using the drag-and-drop editor. The entire dashboard state is a single JSON object, so you can save and restore it later.

### Features

| Feature                                                                           | Description                                                                                                                                                                                                                                                                 |
| --------------------------------------------------------------------------------- | --------------------------------------------------------------------------------------------------------------------------------------------------------------------------------------------------------------------------------------------------------------------------- |
| [Drag & Drop Report Builder](https://ag-grid.com/studio/javascript/modes-layout/) | Bar charts, line charts, pie charts, grids, KPI tiles, text, and images on a drag-and-drop canvas. Design in **edit mode**, then switch to **view mode** to lock the layout while keeping the dashboard fully interactive.                                                  |
| [Data Engine](https://ag-grid.com/studio/javascript/data/)                        | Provide one or more data sources and the data engine automatically manages joins across tables via relationships, aggregation, filtering, and calculated fields through an expression language. No query layer required.                                                    |
| [Advanced Filtering](https://ag-grid.com/studio/javascript/filters/)              | Page-level filters, widget-level filters, and cross-filtering between widgets are all built in. Users can filter from the filters panel, from on-canvas filter widgets (list, button, and date), or by clicking data points in charts to cross-filter the rest of the page. |
| [Theming](https://ag-grid.com/studio/javascript/theming/)                         | Full customisation via the Theming API. Override colours, fonts, spacing, and borders across the Studio UI, grid widgets, and chart widgets independently. Light and dark modes are supported out of the box.                                                               |
| [State Management](https://ag-grid.com/studio/javascript/state/)                  | The entire dashboard state (pages, widgets, layout, and filters) is captured in a single serialisable JSON object. Save and restore state to persist reports, and let users switch between saved reports.                                                                   |

## Quick Start

<!-- START QUICK START DESCRIPTION -->

To configure AG Studio, simply provide your data and render the component. Read on for vanilla JavaScript instructions, or refer to our framework-specific guides for <strong><a href="https://ag-grid.com/studio/react/overview/"><img src="https://ag-grid.com/images/fw-logos/react.svg" height="16" width="16" alt="React Logo"> React</a></strong>, <strong><a href="https://ag-grid.com/studio/angular/overview/"><img src="https://ag-grid.com/images/fw-logos/angular.svg" height="16" width="16" alt="Angular Logo"> Angular</a></strong> and <strong><a href="https://ag-grid.com/studio/vue/overview/"><img src="https://ag-grid.com/images/fw-logos/vue.svg" height="16" width="16" alt="Vue Logo"> Vue</a></strong>.

<!-- END QUICK START DESCRIPTION -->

### Installation

```sh
npm install ag-studio
```

### Setup

**1. Provide a Container**

Add a container element to your HTML. AG Studio fills the size of its parent, so ensure it has a height and width:

```html
<html lang="en">
    <body>
        <div id="myStudio" style="height: 100%; width: 100%"></div>
        <script src="main.js"></script>
    </body>
</html>
```

**2. Define Your Data**

Studio works with arrays of plain objects, where each array becomes a data source:

```js
const data = {
    sources: [
        {
            id: 'products',
            data: [
                {
                    product_name: 'Printer',
                    category: 'Printing & Imaging',
                    brand: 'CleanSlate Office',
                    list_price: 109.09,
                    unit_cost: 92.26,
                },
                {
                    product_name: 'Notebook',
                    category: 'Paper & Notebooks',
                    brand: 'PaperLine',
                    list_price: 24.7,
                    unit_cost: 14.19,
                },
                {
                    product_name: 'Highlighters',
                    category: 'Writing Instruments',
                    brand: 'PaperLine',
                    list_price: 10.34,
                    unit_cost: 5.03,
                },
                // ... more rows
            ],
        },
    ],
};
```

**3. Create the Studio**

Import `createStudio` and initialise it, passing the `data` object and setting the `mode` to `'edit'`:

```js
import { createStudio } from 'ag-studio';

const studioApi = createStudio(document.getElementById('myStudio'), {
    data,
    mode: 'edit',
});
```

That's it — users can now build reports using the drag-and-drop editor.

> **Note:** For more information on building dashboards with AG Studio, refer to our [Quick Start](https://ag-grid.com/studio/javascript/quick-start/) guide or step through the full [Tutorial](https://ag-grid.com/studio/javascript/tutorial/).

## User Guides

Our [User Guides documentation](https://ag-grid.com/studio/javascript/user-interface/) contains comprehensive guides to help users understand how to use AG Studio.

## Support

AG Studio customers have access to dedicated support via [ZenDesk](https://ag-grid.zendesk.com/hc/en-us), which is monitored by our engineering teams.

## License

`ag-studio` has a **Commercial** license. See the [LICENSE file](https://www.ag-grid.com/studio/licenses/ag-studio/LICENSE.html) for more info.

[Request a free 45-day enterprise trial](https://ag-grid.com/studio/license-pricing/?tab=trial) to explore the full enterprise capabilities of AG Studio with no restrictions or watermarks.

<div><h2><img vertical-align="middle" width="32" height="32" src="https://ag-grid.com/images/ag-logos/svg-logos/AG-BrandMark_Light-Theme.svg" alt="AG Grid Logo">&nbsp;AG Grid</h2></div>

AG Studio is built on top of [AG Grid](https://www.ag-grid.com/) — the best JavaScript Data Grid in the world. If you need a standalone data grid with sorting, filtering, grouping, pivoting, and more, check out [AG Grid Repo](https://github.com/ag-grid/ag-grid).

<picture>
    <source srcset="https://github.com/ag-grid/ag-grid/blob/latest/readme-assets/kitchen-sink-demo-light.gif?raw=true" media="(prefers-color-scheme: light)">
    <source srcset="https://github.com/ag-grid/ag-grid/blob/latest/readme-assets/kitchen-sink-demo-dark.gif?raw=true" media="(prefers-color-scheme: dark)">
    <img src="https://github.com/ag-grid/ag-grid/blob/latest/readme-assets/kitchen-sink-demo-light.gif?raw=true" alt="High Performance Demo">
</picture>

<div><h2><img vertical-align="middle" width="32" height="32" src="https://ag-grid.com/images/ag-logos/svg-logos/AG-BrandMark_Light-Theme.svg" alt="AG Charts Logo">&nbsp;AG Charts</h2></div>

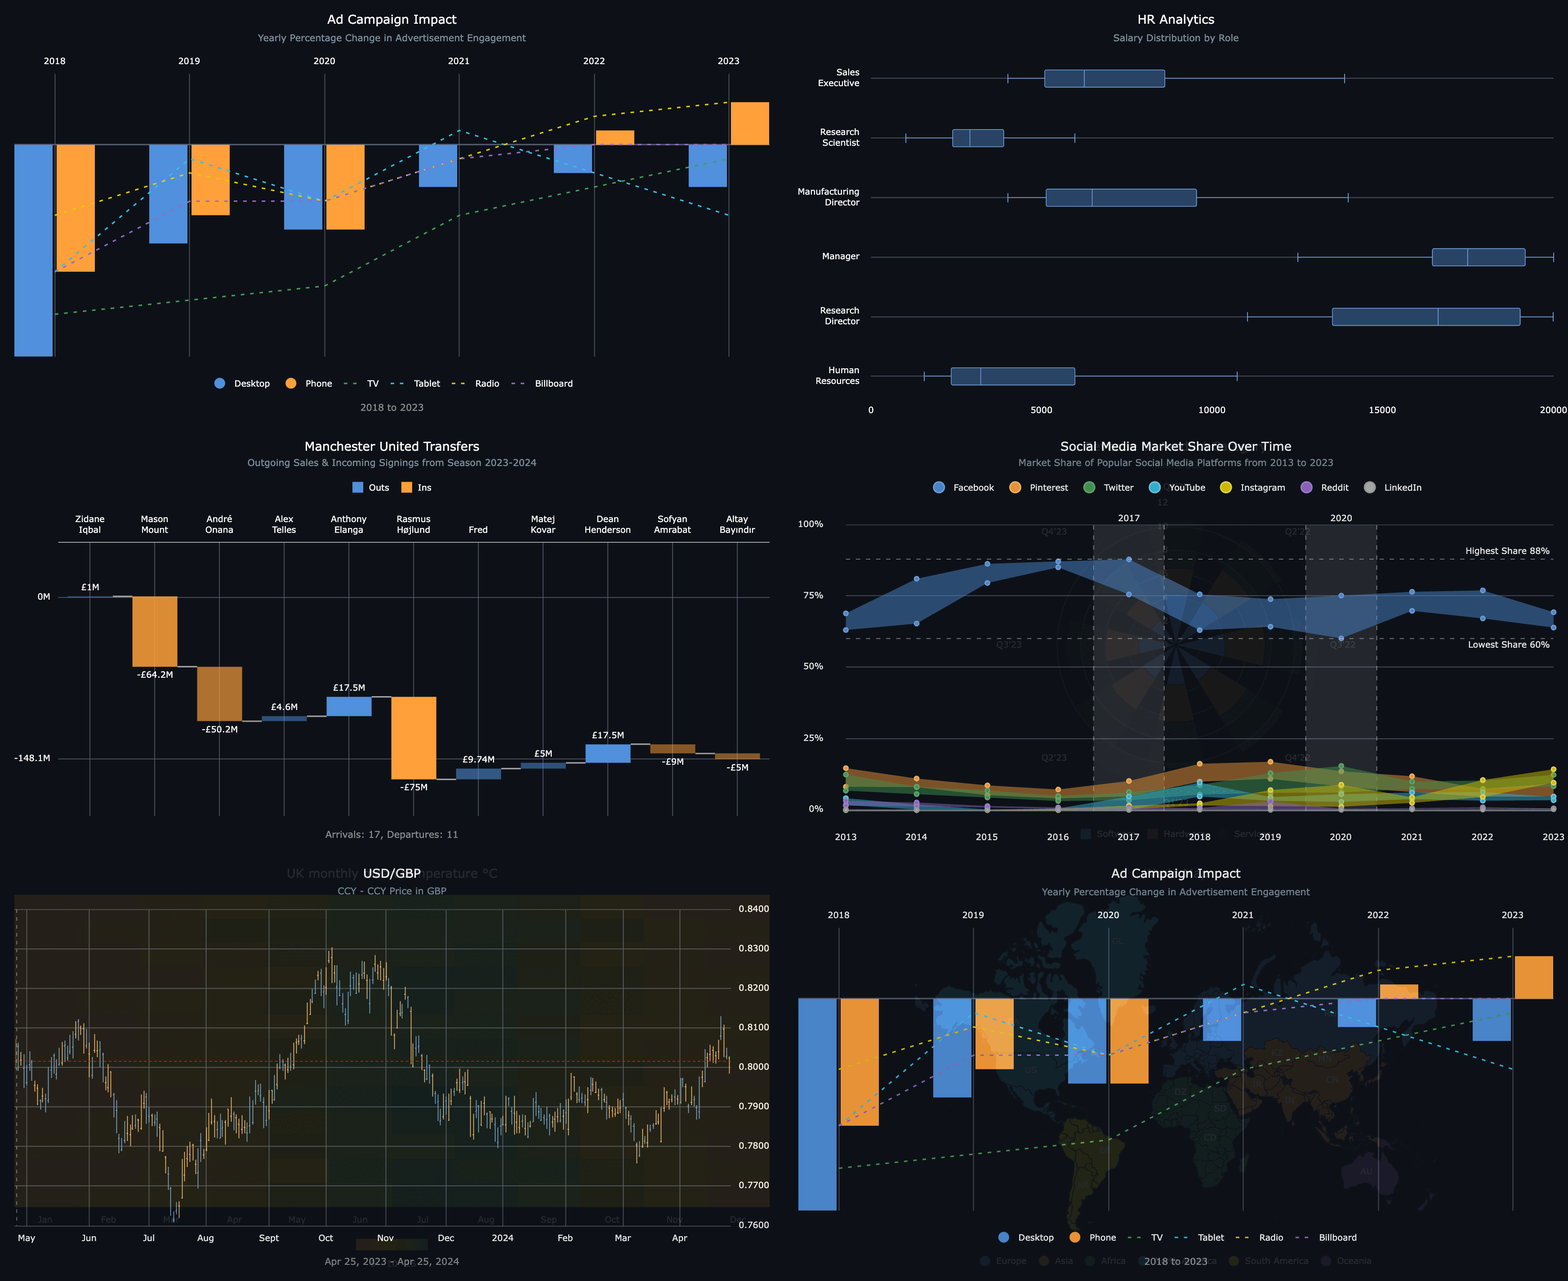
AG Studio is built on top of [AG Charts](https://www.ag-grid.com/charts/) — the best JavaScript Charting library in the world. If you need standalone charts with bar, line, pie, scatter, treemap, and more, check out [AG Charts Repo](https://github.com/ag-grid/ag-charts).

<picture>
    <source media="(prefers-color-scheme: dark)" srcset="https://github.com/ag-grid/ag-charts/blob/latest/packages/ag-charts-website/public/images/readme-assets/gallery-dark.gif?raw=true"/>
    <source media="(prefers-color-scheme: light)" srcset="https://github.com/ag-grid/ag-charts/blob/latest/packages/ag-charts-website/public/images/readme-assets/gallery.gif?raw=true"/>
    <img width="100%" alt="Preview of AG Charts JavaScript Charting Examples" src="https://github.com/ag-grid/ag-charts/blob/latest/packages/ag-charts-website/public/images/readme-assets/gallery.gif?raw=true"/>
</picture>

<div align="center">

<hr/>

<strong>Follow us to keep up to date with all the latest news from AG Grid:</strong>

<a href="https://x.com/ag_grid"><img src="https://img.shields.io/badge/-X%20(Twitter)-black?style=for-the-badge&logo=x" alt="Twitter" height="36"></a>
<a href="https://www.linkedin.com/company/ag-grid/"><img src="https://img.shields.io/badge/-LinkedIn-blue?style=for-the-badge&logo=linkedin" alt="LinkedIn" height="36"></a>
<a href="https://www.youtube.com/c/ag-grid"><img src="https://img.shields.io/badge/-YouTube-red?style=for-the-badge&logo=youtube" alt="YouTube" height="36"></a>
<a href="https://blog.ag-grid.com"><img src="https://img.shields.io/badge/-Blog-grey?style=for-the-badge&logo=rss" alt="Blog" height="36"></a>

</div>