
# Sankey Chart

## Overview

This repository contains a Sankey chart library, and resources for creating beautiful data visualizations.
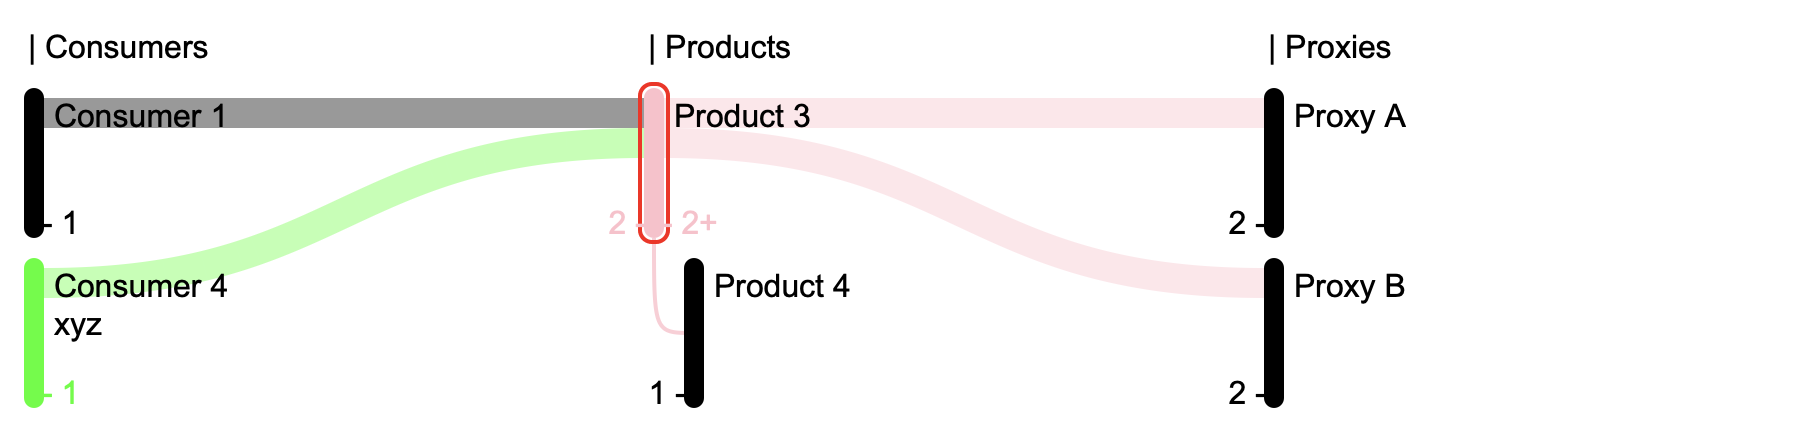
![example1](https://cdn.jsdelivr.net/npm/@vii7/awesome-sankey-chart/docs/images/example1.png "Screenshot")
[Live Demo on CodePen](https://codepen.io/w-vii/pen/pvzEPbd?editors=1010)

## Quick Start Example

Here's a simple example using plain vanilla javascripts without any third party dependencies:

```html
<head>
  <title>Sankey Chart Demo</title>

  <script src="../dist/vanilla/event-handler.js"></script>
  <script src="../dist/vanilla/sankey-chart-data.js"></script>
  <script src="../dist/vanilla/sankey-chart.js"></script>
</head>

<body>

  <svg id="sankey-chart-svg" width="900" height="600"></svg>

  <script>
    // Initialize the SankeyChartData with demo data
    const chartData = {
      name: "MockData",
      "nodes": [
        { kind: "product", name: "Product 1" },
        { kind: "product", name: "Product 2", "tags": ["abc"] },
        { kind: "product", name: "Product 3", color: "pink" },
        { kind: "product", name: "Product 4" },
        { kind: "product", name: "Product 5" },
        { kind: "consumer", name: "Consumer 1" },
        { kind: "consumer", name: "Consumer 2" },
        { kind: "consumer", name: "Consumer 3" },
        { kind: "consumer", name: "Consumer 4", "tags": ["xyz"] },
        { kind: "proxy", name: "Proxy A" },
        { kind: "proxy", name: "Proxy B" },
        { kind: "proxy", name: "Proxy C" },
        { kind: "proxy", name: "Proxy D" }
      ],
      "relations": [
        { source: { kind: "consumer", name: "Consumer 1" }, "target": { kind: "product", name: "Product 3" } },
        { source: { kind: "consumer", name: "Consumer 4" }, "target": { kind: "product", name: "Product 3" } },
        { source: { kind: "product", name: "Product 3" }, "target": { kind: "proxy", name: "Proxy B" } },
        { source: { kind: "product", name: "Product 3" }, "target": { kind: "proxy", name: "Proxy A" } },
        { source: { kind: "product", name: "Product 3" }, "target": { kind: "product", name: "Product 4" } },
        { source: { kind: "product", name: "Product 5" }, "target": { kind: "proxy", name: "Proxy A" } },
        { source: { kind: "product", name: "Product 5" }, "target": { kind: "proxy", name: "Proxy B" } },
        { source: { kind: "product", name: "Product 5" }, "target": { kind: "proxy", name: "Proxy C" } },
        { source: { kind: "product", name: "Product 5" }, "target": { kind: "proxy", name: "Proxy D" } },
        { source: { kind: "product", name: "Product 2" }, "target": { kind: "proxy", name: "Proxy D" } }
      ]
    };

    const chartDataOptions = {
      defaultColor: "black",
      kinds: [
        { name: 'consumer', title: 'Consumers' },
        { name: 'product', title: 'Products' },
        { name: 'proxy', title: 'Proxies' }
      ],
      showRelatedKinds: true,
      selectAndFilter: true,
      tagColorMap: {
        "abc": "#ff0000",
        "xyz": "#00ff00"
      }
    };

    const sankeyChartData = new SankeyChartData(chartData, chartDataOptions);
    sankeyChartData.selectNode({ kind: "product", name: "Product 3" });
    sankeyChartData.selectNode(undefined);

    const svg = document.getElementById('sankey-chart-svg');
    const sankeyChart = new SankeyChart(svg);
    sankeyChart.setData(sankeyChartData);
    sankeyChart.render();

  </script>
</body>
```

## CDN

https://cdn.jsdelivr.net/npm/@vii7/awesome-sankey-chart/

