# Gauge
### Vanilla JavaScript
- See the [HTML Template](https://github.com/qlik-demo-team/qdt-components/blob/master/docs/usage/Html.md) for the
basic page setup.
```js
var options = {
config: { /* host, port, appid, etc. */ },
connections: { /* vizApi, engineAPI */}
}
var qdtComponents = new QdtComponents(options.config, options.connections);
var element = document.getElementById('qdt1');
qdtComponents.render(
"QdtPicasso",
{
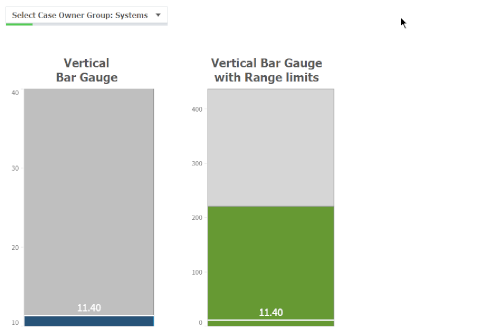
type: 'verticalGauge',
cols: ['=Avg([Case Duration Time])'],
options: {
min: 10,
max: 40
},
outerHeight: 400,
},
element
);
```
### React
```jsx
const chart_options = {
type: 'QdtPicasso',
props: {
type: 'verticalGauge',
cols: ['=Avg([Case Duration Time])'],
options: {
min: 10,
max: 40
},
outerHeight: 400,
},
};
const App = () => {
return (
)
}
render(, document.getElementById('root'));
```
### Angular
```js
// gauge.component.ts
import { Component, OnInit, ElementRef } from '@angular/core';
@Component({
selector: 'picasso-gauge',
templateUrl: './picasso-gauge.component.html',
})
export class PicassoGaugeComponent implements OnInit {
constructor(private el: ElementRef) { }
chart_options = {
type: 'QdtPicasso',
props: {
type: 'verticalGauge',
cols: ['=Avg([Case Duration Time])'],
options: {
min: 10,
max: 40
},
outerHeight: 400,
},
};
ngOnInit() {
}
}
```
```html
```
[← QdtPicasso](../)