# @mohndoe/pi-atlas
See your AI usage and cost directly in Pi.


A [pi](https://pi.dev) extension that turns your session logs into an interactive dashboard — costs, languages, models, projects, tools, and token usage at a glance.
---
## Features
- **Multiple time ranges** — Today, Last 7 days, Last 30 days, or All time
- **Cost tracking** — per-model, per-project, based on real usage costs
- **Language breakdown** — lines written and edited
- **Model analytics** — provider-aware model cost, call count, works with local LLMs too
- **Project attribution** — cost and session count per project directory
- **Usage overview** — tool call frequency and token breakdown (input, output, cache read/write)
- **Cache** — SHA-256-gated persists day aggregates; near-instant open on next visits
- **Zero dependencies** — uses only the pi TUI and the [`@mohndoe/pi-tui-extras`](https://github.com/MohnDoe/pi-tui-extras) component library
## Dashboard
### Tabs
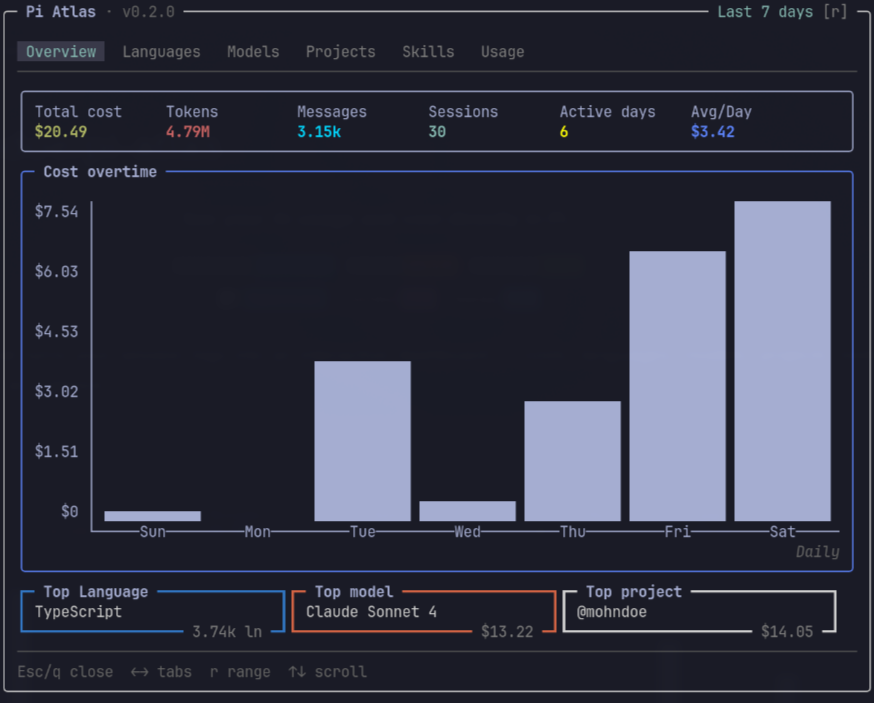
- **Overview** — Cards displaying total cost, sessions count, messages count, active days, average cost per day, total tokens. A bar chart displaying cost overtime. And top language, top model, and top project side by side.
- **Languages** — Languages ranked by line written.
- **Models** — Models ranked by cost. Shows providers, calls and cost per model.
- **Projects** — Projects ranked by cost. Shows session count and cost per project.
- **Skills** — Skills used ranked by cost. Estimation of what skill invocations cost.
- **Usage** — Token breakdown (Total, Input, Output, Cache Read, Cache Write) and table of tool usage.
All tabs displayed data correspond to the selected time range (press `r` to change it). Press left/right arrows to change tabs.
## Install
```bash
pi install npm:@mohndoe/pi-atlas
```
Then run `/reload` in pi (or restart pi). The `/atlas` command is now available.
## Usage
In the pi terminal, type `/atlas` to open the atlas dashboard. Session data is loaded from `~/.pi/agent/sessions/` -- on first load this may take a moment while JSONL files are parsed. Subsequent opens use a cached snapshot and load instantly.
## How it works
```
~/.pi/agent/sessions/*.jsonl
│
▼ parseFile() ◄── entry types handled
┌──────────────────┐
│ DayAgg[] │ per calendar day
└────────┬─────────┘
│
▼ summarize(days, range)
┌──────────────────┐
│ StatsSummary × 4 │ 1d, 7d, 30d, All pre-computed
└────────┬─────────┘
│
▼
Tab receives StatsSummary ──→ Component render
```
**Data sources** — pi stores every session as a `.jsonl` file in `~/.pi/agent/sessions/`. Pi Atlas parses entry types: session headers, user messages, assistant messages, tool results, model changes, thinking level changes, compactions, and branch summaries.
**Caching** — On first open, the sessions directory is scanned and all JSONL files are parsed into `DayAgg` objects. This aggregate is cached to disk alongside a SHA-256 signature of the directory (file paths, sizes, modification times). On subsequent opens, the cache is reused if the signature matches, making the dashboard appear instantly.
**Language detection** — Lines are counted by splitting written/edited content on `\n`. File extensions map to language names via a built-in mapping of 70+ extensions (TypeScript, Python, Rust, Go, etc.).
**Cost attribution** — Assistant message costs are attributed to all active projects in the session. See [ADR-0001](./docs/adr/0001-global-session-project-map.md) for details.
## Development
```bash
# Setup
git clone https://github.com/MohnDoe/pi-atlas.git
cd pi-atlas
bun install
# Type check
bun run typecheck
# Test
bun test
# Coverage
bun test --coverage
```
### Architecture decisions
See [docs/adr/](./docs/adr/) for recorded decisions:
- [ADR-0001: Global session-project map](./docs/adr/0001-global-session-project-map.md) — cost attribution model
- [ADR-0002: Pre-computed summaries](./docs/adr/0002-precomputed-summaries.md) — all four time ranges computed at open
A higher-level [ARCHITECTURE.md](./docs/ARCHITECTURE.md) covers module structure and component hierarchy.
## Data privacy
Pi Atlas reads session logs from `~/.pi/agent/sessions/`. All processing is done locally - no data ever leaves your machine. The cache file is written to `~/.pi/pi-atlas-cache.json` and contains aggregated statistics (costs and counts), not message content.
## License
[MIT](./LICENSE)