Lilt Charts
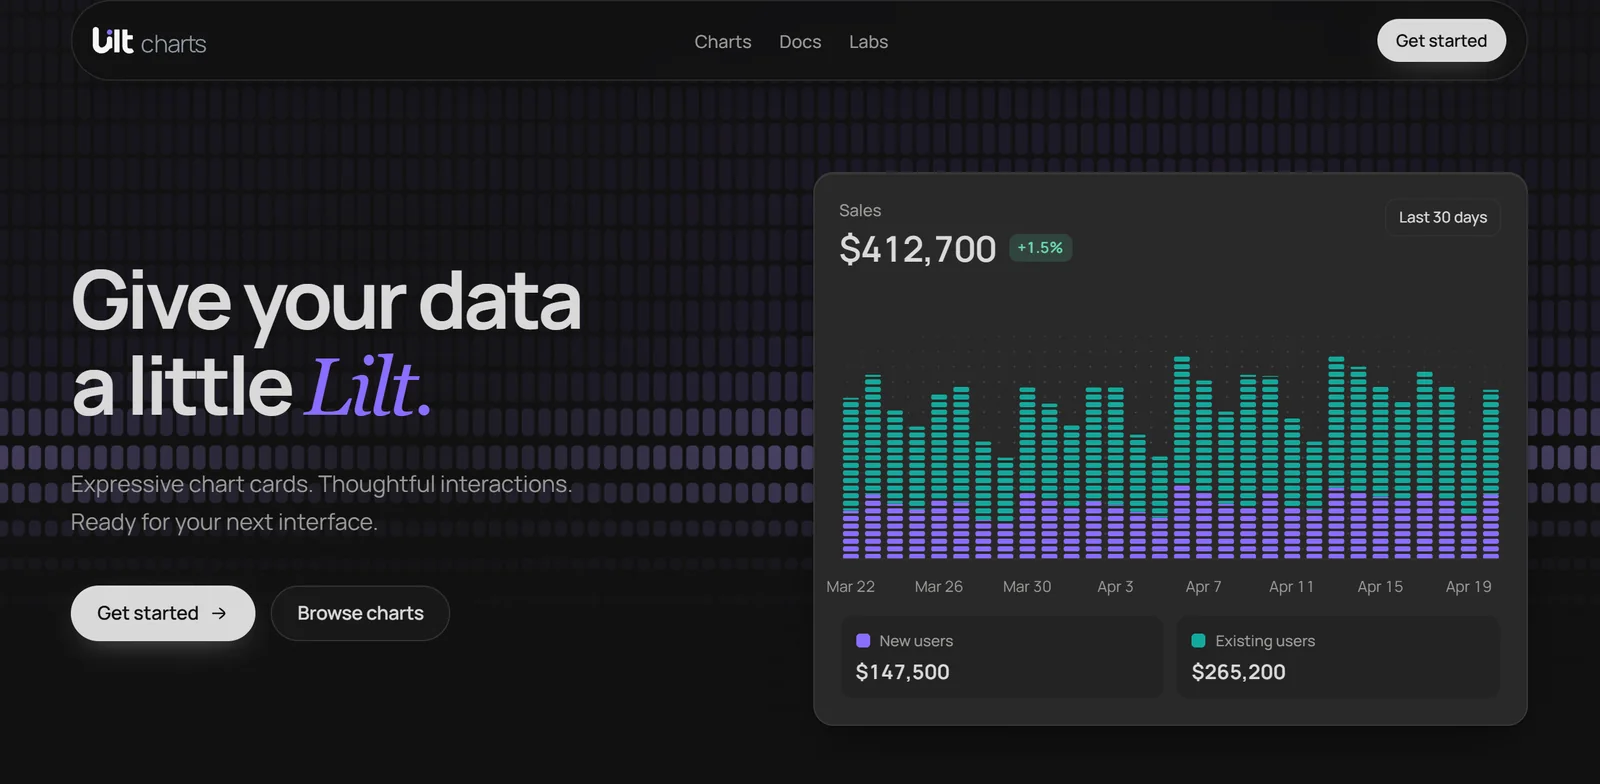
React chart cards with feeling.
Pass your rows, name the fields, and get a finished card.


Documentation ·
Charts ·
Finance ·
llms.txt
 ## Install
```bash
npm install @lilt-ui/charts
# or: pnpm add @lilt-ui/charts
# or: yarn add @lilt-ui/charts
# or: bun add @lilt-ui/charts
```
Lilt needs React and React DOM 19. Every card, variant, and prop is documented at [liltui.vercel.app](https://liltui.vercel.app). Import the stylesheet once, in your root layout or app entry:
```ts
import '@lilt-ui/charts/styles.css';
```
### With an agent
Working with Claude Code, Cursor, or another coding agent? Paste this, then ask for the chart you want:
```text
Use Lilt Charts (@lilt-ui/charts) for charts. Read https://liltui.vercel.app/llms.txt first and follow its rules.
```
[llms.txt](https://liltui.vercel.app/llms.txt) lists every card by job with its rules; [llms-full.txt](https://liltui.vercel.app/llms-full.txt) adds every example, data shape, and prop.
## Your first card
```tsx
'use client';
import { AreaChartCard } from '@lilt-ui/charts';
const visitors = [
{ month: 'Jan', organic: 2400, paid: 800 },
{ month: 'Feb', organic: 2800, paid: 700 },
{ month: 'Mar', organic: 3100, paid: 900 },
];
export function VisitorsCard() {
return (
);
}
```
The headline, value tiles, and hover come from your rows. Supply `delta` when you want a change chip, for example `delta={0.082}` for +8.2%. `x` and each series `key` are checked against your data, so a typo is a type error, not a blank chart.
## Every card, finished
 | For | Cards |
| -------------------- | ----------------------------------------------------------------------------------------------- |
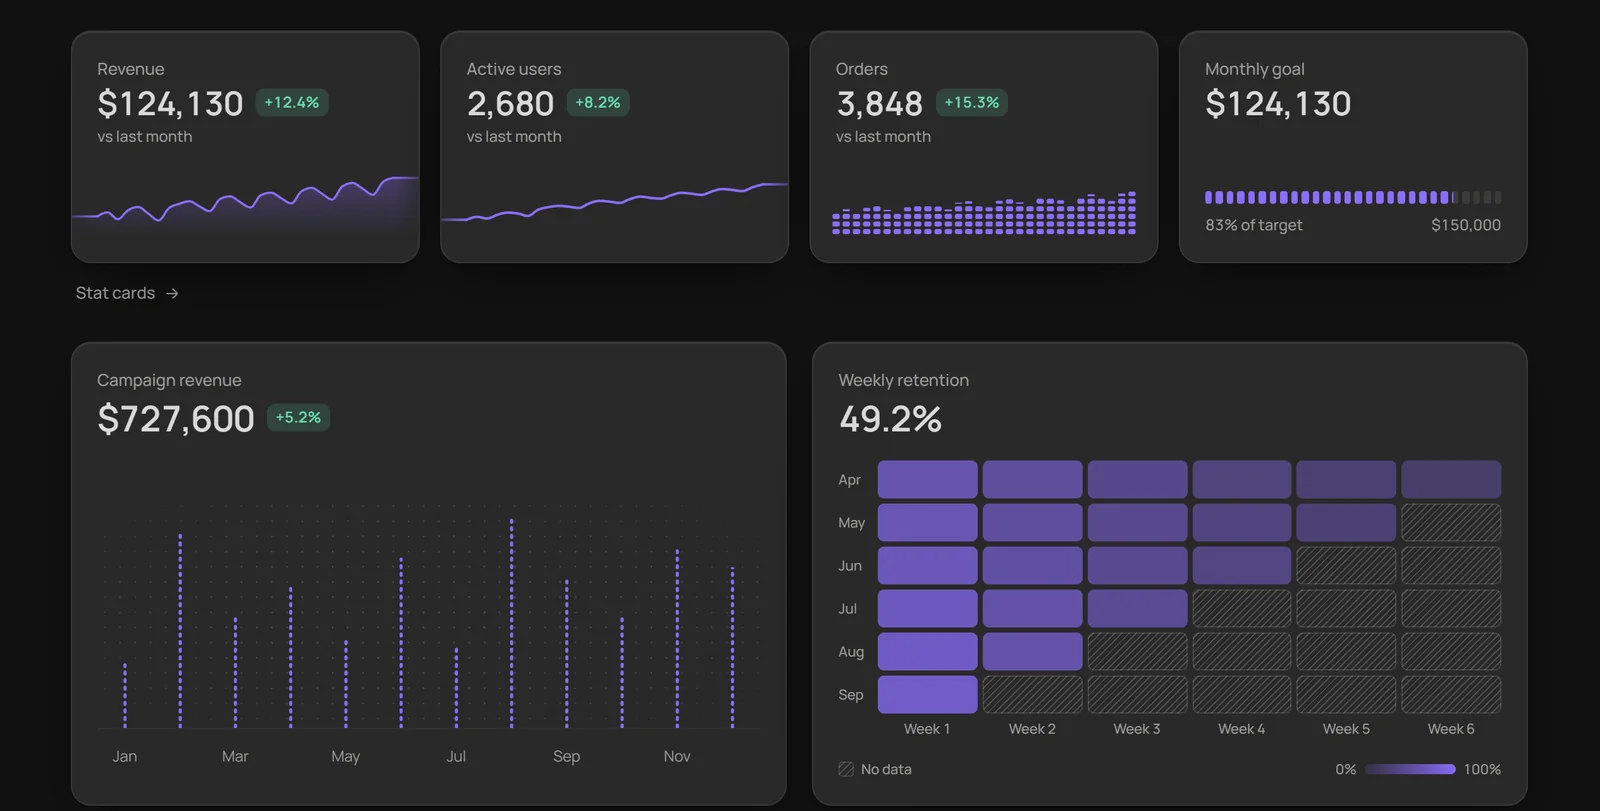
| **Trends** | Area, Line, Bar, and Combo cards, overlapping, stacked, or as shares |
| **At a glance** | Stat cards with a sparkline, bars, a meter, or a ring |
| **Parts and goals** | Radial, Treemap, Progress, and Activity ring |
| **Rankings** | Horizontal bar, with shares and an "Other" row |
| **Flows and change** | Funnel, Sankey, and Slope |
| **Patterns** | Heatmap (matrix and calendar), Scatter (points, strip, beeswarm), Radar, Cohort retention |
| **Spread** | Range (floating bars, error bars, timeline intervals) and Box plot |
| **Markets** | Candlestick, Indicators, Price, Depth, Order book, Portfolio, Watchlist, Market map, and more |
| **Cool** | 23 spatial families, from Skyline and Terrain to Chord loom, Sunburst terraces, and Voxel cloud |
### Charts drawn in depth
[Explore the Cool families](https://liltui.vercel.app/charts/skyline): Skyline, Block city, Hex city, Voxel waffle, Terrain, Ridgeline, Spiral year, Event helix, Chord loom, Arc bridges, Rank ribbons, Parallel ribbons, Contour islands, Sunburst terraces, Cluster constellation, Ternary prism, Wind rose, Marimekko blocks, Intersection towers, Horizon folds, Circle archipelago, Helix ribbons, and Voxel cloud. Each is its own card with its own data contract.
### Companion cards
`TreemapChartCard` reads `label`, `value`, and an optional `group` for one parent level. `CalendarHeatmapCard` reads `date` and `value`, with optional inclusive UTC `from`/`to` bounds. `TimelineChartCard` reads `label`, `start`, and `end`, and packs overlaps within optional `lane` categories. `StripChartCard` reads `category` and `value`; `display="beeswarm"` separates collisions without moving numeric positions.
They take the same `depth`, loading, empty, and header props as every other card, plus `onSelectionChange` and `renderReadout` for your own presentation. Treemap areas must be nonnegative, calendar dates are UTC, and timeline durations are measured in milliseconds (displayed as hours by default).
Existing family pages also cover `StreamgraphCard`, `DivergingBarCard`, `MirroredBarCard`, `NestedDonutCard`, `ComparativeFunnelCard`, `GoalPacingCard`, `MilestoneProgressCard`, `ViolinCard`, and `CorrelationMatrixCard`. Line supports indexed growth; Line and unstacked Area accept supplied forecast bands; Horizontal Bar supports lollipops; Scatter supports ordered trails; and Treemap supports group drill-down.
## Finance charts
Candlesticks, indicators, and order books ship from their own entry point, so apps that never draw a candle never load one:
```tsx
'use client';
import { CandlestickChartCard } from '@lilt-ui/charts/finance';
const candles = [
{
date: new Date('2026-08-20'),
open: 243.1,
high: 246.4,
low: 241.8,
close: 245.2,
volume: 2410000,
},
{
date: new Date('2026-08-21'),
open: 245.2,
high: 247.0,
low: 243.9,
close: 244.6,
volume: 1980000,
},
];
export function MarketCard() {
return (
);
}
```
| Card | What it shows |
| ---------------------- | ------------------------------------------------------------------------------ |
| `CandlestickChartCard` | Candles, hollow candles, OHLC bars, or a price area, with a linked volume pane |
| `IndicatorChartCard` | Moving averages or Bollinger bands over the price; RSI, MACD, or volume panes |
| `PriceChartCard` | A ticker with its latest price and change, or several instruments rebased |
| `DepthChartCard` | How much could trade at each price, buying and selling, and the gap between |
| `OrderBook` | Resting orders level by level, the best prices meeting in the middle |
| `PortfolioChartCard` | What an account is worth next to what went in, and its fall from its best |
| `WatchlistCard` | Sortable rows of prices, moves, and sparklines that roll between periods |
| `MarketMapCard` | Holdings sized by weight and coloured by how far each moved |
| `VolumeProfileCard` | Volume traded at each price, with the point of control and value area |
| `MonthlyReturnsCard` | A year-by-month grid of returns, with each year's total |
| `EarningsCard` | Estimate against actual each quarter, and how far each one surprised |
| `YieldCurveCard` | Yield by maturity over earlier curves, with every inversion shaded |
| `PayoffChartCard` | An options strategy at expiry, with its breakevens and best and worst outcomes |
Candles draw into a handful of paths however many there are, so years of daily history stay fast. `scale="log"` spaces long histories by ratio, and `live` follows new rows as they arrive. The indicator math (`sma`, `ema`, `rsi`, `macd`, `bollinger`, `drawdown`, `depthLevels`, `volumeProfile`, `monthlyReturns`, `payoffAt`, `payoffSummary`, `curveSpread`) is exported too, for your own layouts.
## Built in, one prop away
- **Linked hover.** Cards with `sync`, including Area, Line, Bar, Combo, and Stat, read the same moment together. Stat also needs `x`.
- **Targets and forecasts.** On Area, Line, Bar, and Combo cards, `target` draws a goal line and counts the points that reach it. `forecast` marks supplied projected rows and keeps them out of the headline. Lilt does not estimate forecasts.
- **Pin and compare.** On cards with inspection, click a mark to pin it; press off the marks, or Escape, to let go. Cards with `compare` let you drag across the plot to see what changed, in the headline or, with `compare="badge"`, in the card's tab. Check the family's props for availability.
- **Honest data.** `null` is a gap, never a zero, and missing values say so.
- **Loading and empty.** `loading` shows a skeleton that `"shimmer"`s, `"draw"`s, or `"breathe"`s in the chart's own shape, then hands over to the data. A period with no rows shows a still empty state, or your own with `empty`, and the headline reads a dash, never zero.
- **Long series.** Line and area cards draw tens of thousands of points from four per pixel column; hover, tiles, and exports still read every row.
- **Calm by default.** Keyboard navigation, screen reader labels, and motion that respects reduced-motion settings.
## Fits your design system
Omit `title` to render no visible title. `header={false}` removes the entire header, including the headline, delta and period controls. Cards with legend layouts accept `legend={false}` independently. `surface="ghost"` only removes the visual frame. Give embedded charts an `aria-label`; pass `data` directly when your app owns the period selector.
Cards with `ranges` draw Lilt's period select: a pill that opens a frosted list, with arrows, Home/End, Enter, Escape and type-ahead. To use your design system's select in every card instead, wrap them once:
```tsx
import { ChartComponentsProvider, type ChartRangeSelectProps } from '@lilt-ui/charts';
function PeriodSelect({ value, options, onValueChange, ...rest }: ChartRangeSelectProps) {
return (
);
}
{children};
```
Every card that pins works from the keyboard: Tab to the chart, arrows to inspect, Enter or Space to pin, and Escape to clear. Radial, Funnel, and Horizontal bar cards can hand their pin to you with a controlled `selected`; a click, Escape, or a press off the marks then asks `onSelectedChange` instead of changing it.
Cards follow shadcn theme variables when your app defines them: `--card`, `--card-foreground`, `--muted-foreground`, `--border`, `--ring`, and `--chart-1` to `--chart-5`. Anything you leave out falls back to Lilt's own palette.
Every Lilt style lives in the `lilt` cascade layer, so your CSS wins without specificity tricks. With Tailwind, declare the layer order once at the top of your global stylesheet:
```css
@layer theme, base, lilt, components, utilities;
@import 'tailwindcss';
```
## Contributing
Use Node.js 24 and pnpm 11.9.0. From a clone of this repository:
```bash
pnpm install --frozen-lockfile
pnpm dev
```
The documentation app opens at [localhost:5173](http://localhost:5173). The library lives in
`packages/charts`; the Next.js documentation app lives in `apps/showcase`.
See [CONTRIBUTING.md](https://github.com/TheeHappyCoder/lilt-charts/blob/main/CONTRIBUTING.md)
for checks, package testing, and contribution guidance. Report vulnerabilities using
[SECURITY.md](https://github.com/TheeHappyCoder/lilt-charts/blob/main/SECURITY.md).
## License
MIT © Lilt UI

