Leaflet.DonutCluster
=====================
> forked from [akq/Leaflet.DonutCluster](https://github.com/akq/Leaflet.DonutCluster)
A lightweight standalone [Leaflet](https://leafletjs.com) plugin to display donut charts instead of circles in map when using [Leaflet marker cluster](https://github.com/Leaflet/Leaflet.markercluster). This lib copies the codes which generate the donut svg from [donutjs](https://github.com/finom/donutjs).
**Only depends on Leaflet and Leaflet.markercluster, NOT on other chart library like d3.js**
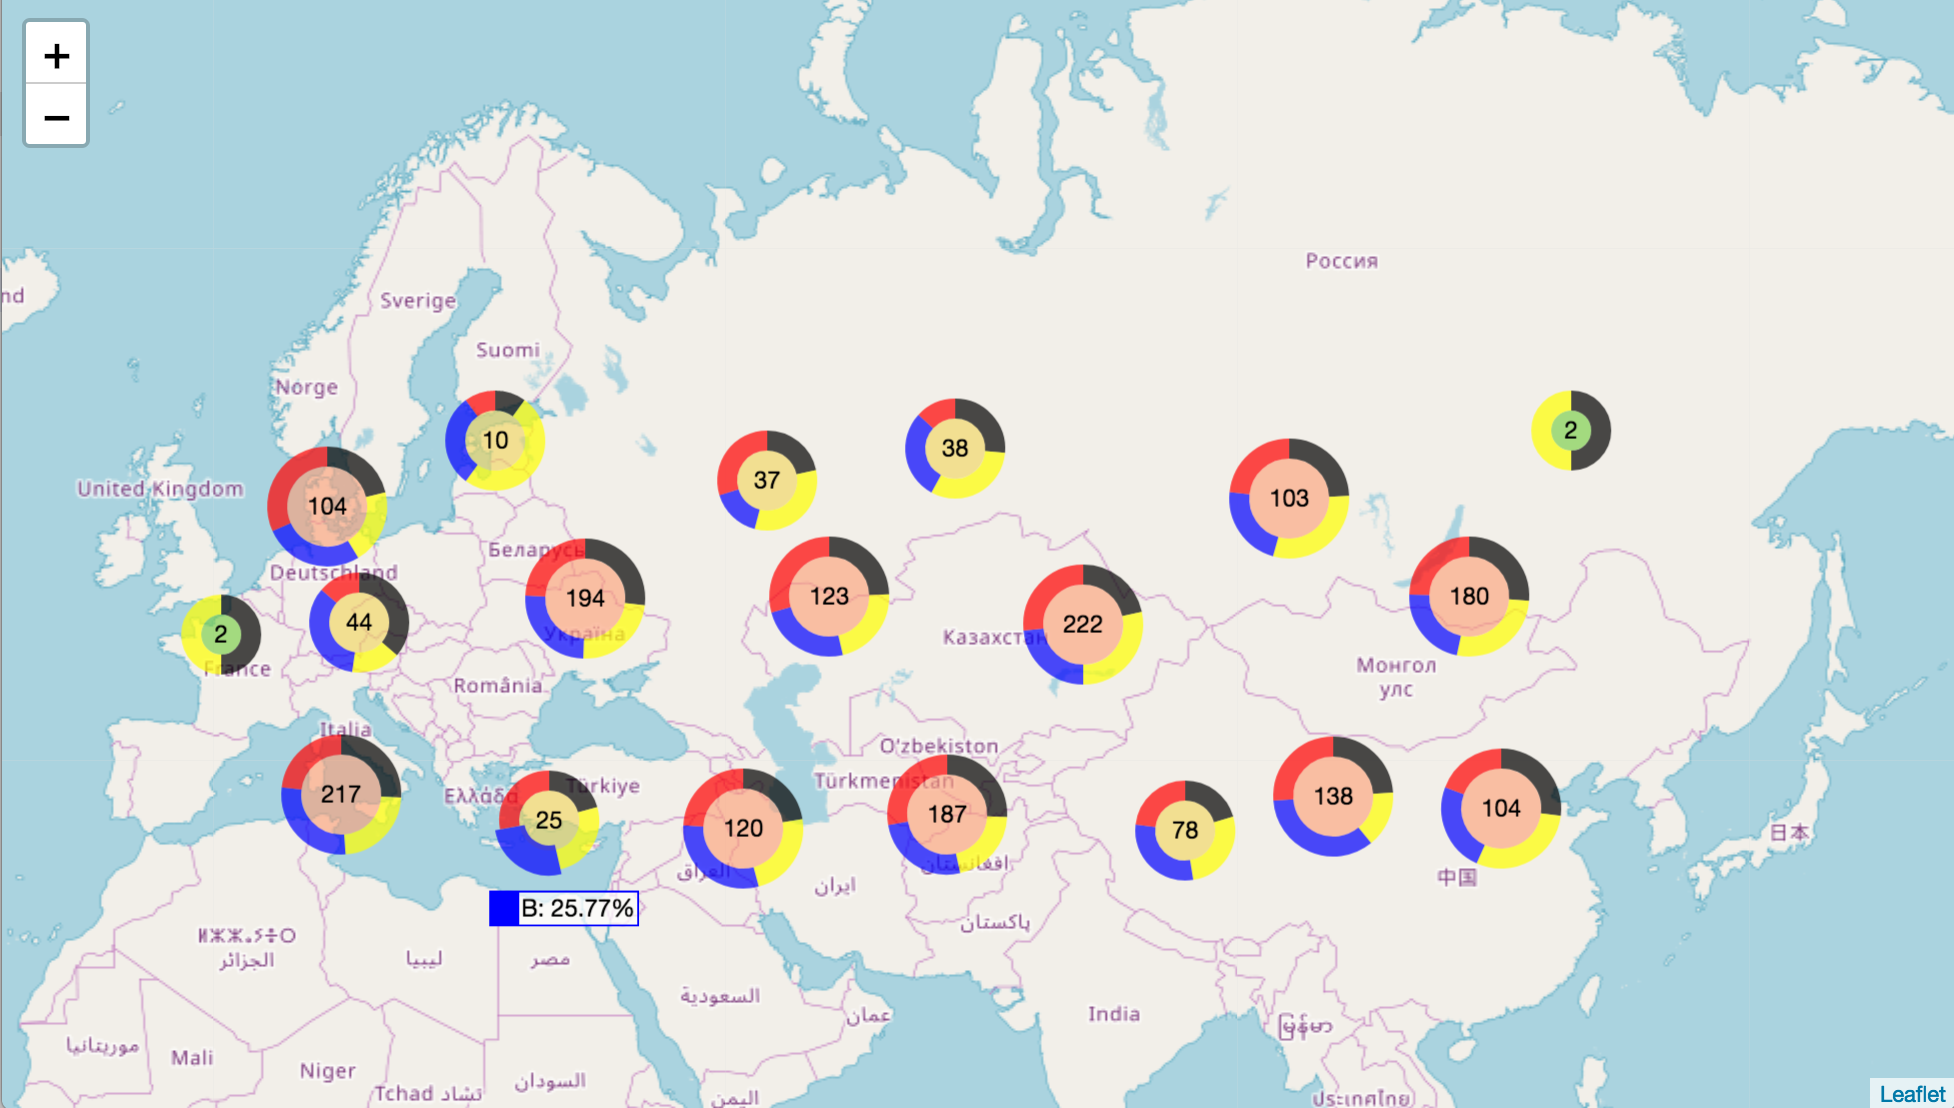
- [Online Demo -- basic](https://jsfiddle.net/b43c1xkf/1/embedded/result,html/)
- [Online Demo -- sum by field](https://jsfiddle.net/mfxd015b/3/embedded/result,html/)
- [Online Demo -- total by field](https://jsfiddle.net/kdL4gu6f/embedded/result,html/)
## Usage
First install using `npm install @kalisio/leaflet.donutcluster` or `yarn add @kalisio/leaflet.donutcluster` and import in your project:
```javascript
import '@kalisio/leaflet.donutcluster/src/Leaflet.DonutCluster.css'
import '@kalisio/leaflet.donutcluster/src/Leaflet.DonutCluster.js'
```
You can also directly include `Leaflet.DonutCluster.js` and `Leaflet.DonutCluster.css` in your HTML pages.
Then use `L.DonutCluster` to create a marker cluster instance with options:
```javascript
// Create the markercluster
var markers = L.DonutCluster(
// The first parameter is the standard marker cluster's configuration.
{
chunkedLoading: true
}
// The second parameter is the donut cluster's configuration.
, {
// Mandotary, indicates the field to group items by in order to create donut' sections.
key: 'title',
// Optional, indicates the value field to compute the "weight" of each donut section, ie item group.
// If not given each item is assumed to have a value of 1 and the weight will be thus equal to item count of the group.
// The size of each donut section is related to the weight of the group vs the sum of all weights.
sumField: 'value',
// Optional, indicates the value field to compute a "maximum weight" of each donut section, ie item group.
// If given the size of each donut section will be related to the weight of the group vs the sum of maximum weights.
totalField: 'maxValue',
// Optional, indicates the group order.
order: ['A', 'D', 'B', 'C'],
// Optional, indicates the group IDs, when it is an array, the order option must be specified.
// Otherwise use an object like `{ A: 'Type A', D: 'Type D', B: 'Type B', C: 'Type C' }``
title: ['Type A','Type D','Type B','Type C' ],
// Mandotary, the arc color for each donut section.
// If array of colors will loop over it to pick color of each section sequentially.
arcColorDict: {
A: 'red',
B: 'blue',
C: 'yellow',
D: 'black'
},
// Optional, the style of the donut
style: {
size: 40,
fill: '#99d8c9',
opacity: 1,
weight: 7
},
// A class to assign to the donut center text
textClassName: 'donut-text',
// The value to be displayed in the donut center text
// Could be `count`, `total` or `sum` (defaults).
textContent: 'count',
// If lodash is available text content can be based on a template.
textTemplate: '<%= data.active.value %>/<%= sum %>',
// A class to assign to the donut legend text on mouse hover
legendClassName: 'donut-legend',
// The value to be displayed in the donut legend text on mouse hover
// Could be `percentage` or `value` (defaults).
legendContent: 'value',
// If lodash is available legend HTML content can be based on a template.
legendTemplate: '<%= selected.title %>: <%= selected.value %>',
// Set this to true to avoid displaying legend on mouse over
hideLegend: true,
// Function used to format value numbers for display
// Possible types are `count`, `percentage` or `value` and can help to use different formattings
format: (value, type) => value.toFixed(0),
// Function used to customize legend output
getLegend: (title, color, percentage, value) => `${title}: ${percentage}%`
}
)
```
Then add the marker into the marker cluster:
```javascript
var marker = L.marker(L.latLng(a[0], a[1]), {
title: title // the value to group
});
...
markers.addLayer(marker);
```
> Note: when the markers are created from a Leaflet GeoJson layer you can also directly reference properties of the underlying feature instead of marker options
## License
Licensed under the [MIT license](LICENSE).
## Authors
This project is sponsored by
[](https://kalisio.com)