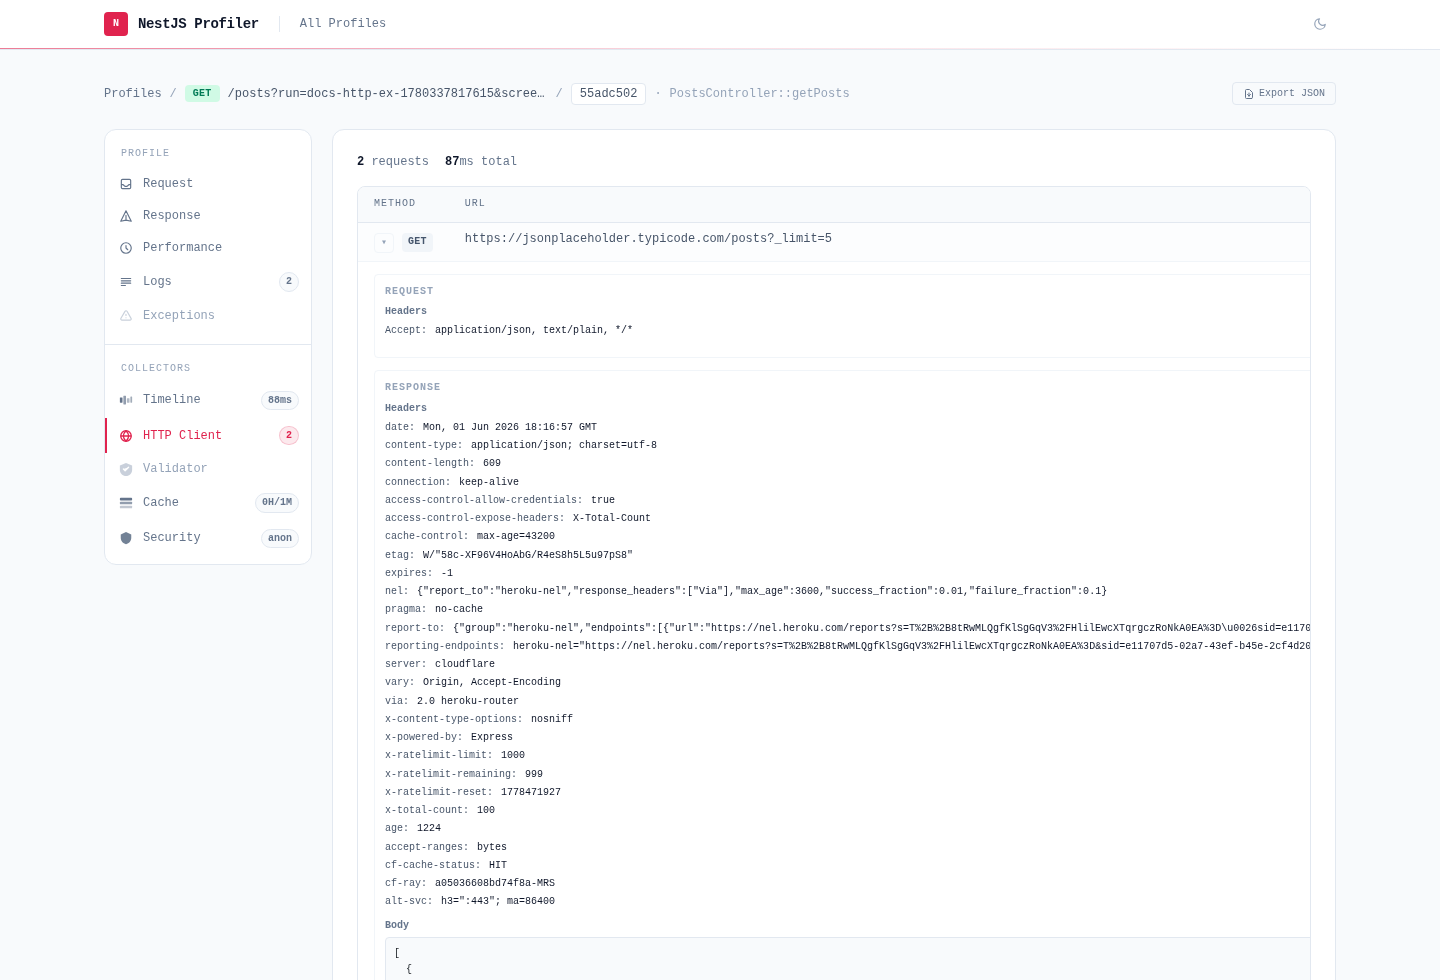
`@eleven-labs/nest-profiler-http` captures outgoing HTTP requests and displays them in a dedicated **HTTP Client** panel. It is **client-agnostic**: it owns the `HttpRequestEntry` contract, the collector, the `HttpProfilerRecorder` and an `HttpInstrumentation` interface, and never depends on any HTTP-client library. It ships two opt-in, subpath-isolated adapters — **axios** and **fetch** — that both capture request and response bodies safely, and you pick exactly which client(s) to instrument. Nothing is patched unless you select it, and you can bring your own client the same way. Two equally opt-in **phases providers** break each call down into DNS, handshake, time-to-first-byte and download.
## Installation
```bash
pnpm add -D @eleven-labs/nest-profiler-http
# only if you select the axios adapter — your app already owns these (regular dependencies):
pnpm add @nestjs/axios axios
```
**Optional peer dependency:** `axios ^1.0.0` (type-only, used by the `/axios` adapter). `fetch` is a Node ≥ 22 built-in and needs no dependency. This package never imports `@nestjs/axios` — that is your application's dependency.
## Selecting clients
Import each adapter from its own subpath and list it in `instrumentations`. **Nothing is instrumented unless it appears in the list.**
```ts title="profiling/profiling.module.ts"
import { Module } from '@nestjs/common';
import { ProfilerModule } from '@eleven-labs/nest-profiler';
import { HttpCollectorModule } from '@eleven-labs/nest-profiler-http';
import { AxiosInstrumentation } from '@eleven-labs/nest-profiler-http/axios';
import { FetchInstrumentation } from '@eleven-labs/nest-profiler-http/fetch';
@Module({
imports: [
ProfilerModule.forRoot({ isGlobal: true }),
HttpCollectorModule.forRoot({
instrumentations: [AxiosInstrumentation, FetchInstrumentation],
captureResponseBody: true,
}),
],
})
export class ProfilingModule {}
```
Each adapter lives on its own subpath (`/axios`, `/fetch`), so importing one never loads another's dependency. The root barrel exports only the client-agnostic API.
> `ProfilingModule` is the dev-only bundle loaded by `main-dev.ts` — see [Enabling and disabling the profiler](https://nest-profiler.eleven-labs.com/docs/packages/nest-profiler/configuration#recommended-install-it-as-a-dev-dependency). If the profiler is installed as a production dependency behind the [runtime gate](https://nest-profiler.eleven-labs.com/docs/packages/nest-profiler/configuration#when-production-code-calls-the-profiler-conditionalmodule), wrap the same call in `ConditionalModule.registerWhen(..., isProfilerEnabled)`.
### How each adapter finds requests
- **`AxiosInstrumentation`** (`/axios`) — **auto-discovers** every axios instance in the DI container via `DiscoveryService`: `@nestjs/axios` `HttpService` (including each per-feature `HttpModule` / `HttpModule.register()`, which build distinct instances) and bare axios instances provided directly. No `axiosRef` wiring, no `@nestjs/axios` import: `HttpModule` stays imported by your own feature modules and the collector in the bundle finds it. Just inject `HttpService` in your services as usual — requests are captured automatically. Axios instances created outside DI (a bare `axios.create()` held in a private field, a third-party library's internal client) aren't discoverable — record those with a custom instrumentation (below).
- **`FetchInstrumentation`** (`/fetch`) — patches `globalThis.fetch` once. A single global hook covers every caller.
> **Other clients (got, undici, superagent…)?** There is no `node:http` catch-all **for recording**: instrument them with a small custom `HttpInstrumentation` using the client's own hooks (see [Bring your own HTTP client](#bring-your-own-http-client)). Going through the client's native API captures full request **and** response bodies safely — which a generic `node:http` hook cannot do for response bodies. Phase _timings_ are a different matter: those do have a `node:http` catch-all, because a timer reads nothing (see below).
## Phase timings
A duration tells you a call took 180ms. A breakdown tells you whether that was DNS, a TLS handshake, an upstream thinking, or a large body coming down the wire — which is the difference between a fix in your infrastructure and a conversation with the team that owns the API.
Phases are opt-in and selected exactly like an adapter, from the `/phases` subpath:
```ts
import { HttpCollectorModule } from '@eleven-labs/nest-profiler-http';
import { AxiosInstrumentation } from '@eleven-labs/nest-profiler-http/axios';
import { FetchInstrumentation } from '@eleven-labs/nest-profiler-http/fetch';
import { NodeHttpPhases, UndiciPhases } from '@eleven-labs/nest-profiler-http/phases';
HttpCollectorModule.forRoot({
instrumentations: [AxiosInstrumentation, NodeHttpPhases, FetchInstrumentation, UndiciPhases],
});
```
A provider **records nothing** — no entry, no header, no body. It measures, and the adapter that records the call picks the breakdown up. Which one you need depends on the transport, not on the client's name:
| Provider | Times | Reports |
| ---------------- | ---------------------------------------------------------------------------------------------------------------------- | --------------------------------------------------------------- |
| `NodeHttpPhases` | every client built on `node:http`/`node:https` — axios, superagent, `got`, `node-fetch`, a hand-rolled `https.request` | `wait`, `dns`, `tcp`, `tls`, `request`, `firstByte`, `download` |
| `UndiciPhases` | `fetch` and anything else on **undici**, which does not go through `node:http` | `wait`, `connect`, `request`, `firstByte`, `download` |
`got` needs no provider at all: it embeds `@szmarczak/http-timer` and its own `response.timings` are read natively.
**Every phase is optional, and a partial breakdown is the normal case.** A reused keep-alive connection reports no handshake — it connected nothing. An IP literal reports no DNS. undici publishes one `connected` event covering DNS, TCP and TLS, so it reports the coarse `connect` phase instead of the three. And because `fetch()` resolves on the response _headers_, a body still streaming when the call is recorded has no measured `download`. Whatever the phases do not account for is drawn as an explicit **Other** segment rather than folded into a neighbour — the arithmetic stays honest about what was measured and what was not.
The breakdown appears twice: as a stacked bar in the HTTP Client panel (hover a segment, or expand the row for the numbers), and as labelled extras on the call's bar in the Execution Trace of the Performance tab.
### Why a timings-only `node:http` hook is safe
This package deliberately ships no `node:http` **recording** adapter: capturing a response body there means reading the stream, which steals chunks from a caller consuming it in paused mode. `NodeHttpPhases` has nothing of that problem — it notes _when_ events fired and never reads a request or a response, so both streams reach the caller untouched. It also cannot double-record, because it records nothing.
Not covered: a request built by hand with `new http.ClientRequest(...)`, and any client that captured a reference to `http.request` before your application booted. Time those explicitly with `instrumentClientRequest(request)`.
## Bring your own HTTP client
For an ad-hoc call, inject `HttpProfilerRecorder` and call `capture()` — it applies your capture options (headers/body) and masks sensitive headers, so a custom client shows the same detail in the panel. Keeping such a call in production code requires installing the profiler as a regular dependency behind the [runtime gate](https://nest-profiler.eleven-labs.com/docs/packages/nest-profiler/configuration#when-production-code-calls-the-profiler-conditionalmodule), since a dev-dependency install is absent in production — and `HttpCollectorModule`, which exports the recorder, is not global, so import the gated module where the service is declared. To stay dev-only, prefer a reusable `HttpInstrumentation` registered in the bundle (below):
```ts
import { HttpProfilerRecorder } from '@eleven-labs/nest-profiler-http';
@Injectable()
export class WeatherService {
constructor(private readonly recorder: HttpProfilerRecorder) {}
async getForecast() {
const url = 'https://api.weather.example.com/forecast';
const startedAt = Date.now();
const res = await fetch(url, { headers: { accept: 'application/json' } });
const body = await res.json();
this.recorder.capture({
method: 'GET',
url,
startedAt,
duration: Date.now() - startedAt,
statusCode: res.status,
responseHeaders: res.headers, // fetch `Headers` (and `Map`) are supported
responseBody: body,
});
return body;
}
}
```
For a **reusable** integration, implement `HttpInstrumentation` — a NestJS provider with `install(recorder)` — and add it to `instrumentations`. It can inject `ModuleRef`, config, etc. This is exactly how the bundled adapters work. Example, instrumenting [`got`](https://github.com/sindresorhus/got):
```ts
import { Injectable } from '@nestjs/common';
import type { HttpInstrumentation, HttpProfilerRecorder } from '@eleven-labs/nest-profiler-http';
import got from 'got';
@Injectable()
export class GotInstrumentation implements HttpInstrumentation {
install(recorder: HttpProfilerRecorder): void {
got.extend({
hooks: {
beforeRequest: [
(options) => {
(options as { _start?: number })._start = Date.now();
},
],
afterResponse: [
(response) => {
const started = (response.request.options as { _start?: number })._start ?? Date.now();
recorder.capture({
method: response.request.options.method,
url: response.requestUrl.toString(),
startedAt: started,
duration: Date.now() - started,
statusCode: response.statusCode,
responseHeaders: response.headers,
responseBody: response.body,
});
return response;
},
],
},
});
}
}
// HttpCollectorModule.forRoot({ instrumentations: [GotInstrumentation] });
```
### Phases for a custom client
`readHttpPhases(source)` finds the breakdown behind whatever object you happen to hold — a response, an error, a `ClientRequest`, an `IncomingMessage`, a `follow-redirects` wrapper, or a `got` response — and returns `undefined` when nothing timed the call:
```ts
import { readHttpPhases } from '@eleven-labs/nest-profiler-http';
recorder.capture({
method: 'GET',
url,
startedAt,
duration: Date.now() - startedAt,
statusCode: response.statusCode,
phases: readHttpPhases(response), // whatever a provider (or got) measured, or undefined
});
```
Three ways to feed it, in order of how little work they are:
1. **`NodeHttpPhases` is installed and your client uses `node:http`** — pass the response (or the error) to `readHttpPhases` as above. Nothing else to do.
2. **Your client hands you its request object** — time it yourself with `instrumentClientRequest(request)`, no global patch involved: `got.stream(url).on('request', (req) => instrumentClientRequest(req))`.
3. **Your client exposes neither** — measure what you can and pass it directly. Every field is optional, so a transport that only knows its time-to-first-byte says exactly that:
```ts
recorder.capture({ method, url, startedAt, duration, phases: { firstByte: 42 } });
```
The panel draws the segments you provided and shows the rest as **Other**. Never inflate a phase to make the total add up — a missing phase reads as missing, a wrong one reads as a fact.
`HttpPhases` field names are the de-facto vocabulary (`got`/`@szmarczak/http-timer` use them, and they map onto the browser's `PerformanceResourceTiming`), so a reader coming from either already knows what they mean.
Use `record(entry)` instead of `capture(input)` if you have already built a final `HttpRequestEntry` and want to bypass the capture options. The example API swaps its whole `ArticleGateway` between the axios and fetch adapters with `HTTP_CLIENT=axios|fetch` — run it with `HTTP_CLIENT=fetch` to see the fetch adapter capturing the same calls.
## Options
`HttpCollectorModule.forRoot(options)` accepts:
| Option | Default | Description |
| --------------------------- | --------- | -------------------------------------------------------------------------------------------------------------------------------------------------------------------------------------------------------------------------------------------------------------------------------------- |
| `instrumentations` | `[]` | The adapters and phases providers to install (`AxiosInstrumentation`, `FetchInstrumentation`, `NodeHttpPhases`, `UndiciPhases`, your own…). Nothing is instrumented unless listed. |
| `propagateTraceId` | `false` | Forward the profile's trace id on every instrumented call. `true` uses `x-request-id`; pass a header name for another. See [Propagating the trace id](#propagating-the-trace-id). |
| `slowThreshold` | `300` | Calls at/above this duration (ms) are tagged `slow`. |
| `nPlusOneThreshold` | `2` | Identical calls repeated ≥ N in one request are tagged `n-plus-one`. |
| `chattyThreshold` | `10` | A request making ≥ N outgoing calls is tagged `chatty`. |
| `largePayloadThreshold` | `1048576` | A call whose payload reaches this size (bytes) is tagged `large-payload`. `0` disables. |
| `slowSeverity` | `warning` | Severity of the `slow` tag (`'info' \| 'warning' \| 'danger'`). |
| `nPlusOneSeverity` | `danger` | Severity of the `n-plus-one` tag. |
| `chattySeverity` | `warning` | Severity of the `chatty` tag. |
| `largePayloadSeverity` | `warning` | Severity of the `large-payload` tag. |
| `error` | 5xx | What counts as a **failed call**: it threw, or answered ≥ 500. A 404 from an API you call is an answer, not a failure — pass `{ httpStatus: 400 }` to count it. See [What counts as an error](https://nest-profiler.eleven-labs.com/docs/packages/nest-profiler/error-classification). |
| `captureRequestHeaders` | `true` | Capture (and mask) outgoing request headers. |
| `captureRequestBody` | `false` | Capture request body for non-GET/HEAD requests. |
| `captureResponseHeaders` | `true` | Capture (and mask) response headers. |
| `captureResponseBody` | `false` | Capture response body — can be large. |
| `maskHeaders` | `[]` | Extra header names to redact (merged with the defaults). |
| `maskQueryParams` | `[]` | Extra query-parameter names whose value is redacted in the recorded URL (merged with the defaults). |
| `useDefaultMaskQueryParams` | `true` | Mask the built-in sensitive query parameters (`token`, `access_token`, `api_key`, `code`, `state`, `signature`…) on top of `maskQueryParams`. |
## What it collects
For each outgoing request: `method`, `url`, `statusCode`, `duration`, `startedAt`, optional `error`, an optional `phases` breakdown when a provider timed the call, and (per options) request/response headers and bodies.
## Propagating the trace id
Off by default. Turn it on and every instrumented outgoing call carries the profile's trace id:
```ts
HttpCollectorModule.forRoot({
instrumentations: [AxiosInstrumentation],
propagateTraceId: true, // or 'x-correlation-id'
});
```
This is **not** distributed tracing: no span tree is shared, nothing is negotiated. It is the same id travelling — which is what lets two services that both run the profiler file one request under one id. Paste it into either dashboard's search box and you land on that side of the call.
It is opt-in because adding a header to an application's outgoing traffic is a visible change, and some upstreams sign or validate the exact header set they receive.
Two behaviours worth knowing:
- **A header the caller set explicitly always wins.** They wrote it on purpose, and overwriting it would break the correlation they were setting up.
- **Nothing is added outside a profiled request.** A call made during bootstrap or from a background task goes out unchanged: propagation is an aid, never a precondition for the call.
The `fetch` adapter builds a fresh `init` rather than mutating the one it was given, so a client that reuses a single `init` across calls cannot accumulate a header from an unrelated request.
## Redaction
Two things are masked by default, before anything is persisted:
- **Headers** — `authorization`, `cookie`, `set-cookie`, `x-api-key`, `x-auth-token`, `proxy-authorization`, plus whatever `maskHeaders` adds.
- **Query-parameter values in the recorded URL** — `token`, `access_token`, `refresh_token`, `api_key`, `code`, `state`, `signature`, `password`, `secret`, `client_secret`… plus whatever `maskQueryParams` adds, matched case-insensitively and ignoring `-`/`_`.
Both lists are **additive**: naming your own entries extends the built-ins rather than replacing them. Parameter names are kept and only values replaced, so a recorded URL still reads `?api_key=[REDACTED]` — knowing a call carried a key is useful when reading a trace, knowing which one is not. The lists come from the core package, so an outgoing `?token=` is treated exactly like an incoming one.
Masking applies to `HttpProfilerRecorder.capture()`, which both bundled instrumentations and the recommended custom-client path go through. `HttpProfilerRecorder.record()` and `appendHttpRequestEntry()` deliberately bypass every capture flag and all masking — they append the entry you built, as-is — so redact the URL yourself (`redactQueryString`, exported here) when you reach for them.
## Toolbar badge
Request count (e.g. `3`). When errors are present: `3 (1 err)`.
## Panel behaviour
The HTTP Client panel lets you expand each row to inspect request/response headers and bodies. That behaviour ships as a compiled, same-origin browser bundle (`http.js`) that the module registers with the profiler automatically — there is nothing to configure, and the templates carry no inline JavaScript. It is a reference implementation of the [Extending the UI with JavaScript](https://nest-profiler.eleven-labs.com/docs/packages/nest-profiler/extending-the-ui) pattern, reusing the core `window.NestProfiler` runtime.
---
Part of the [nest-profiler](https://github.com/eleven-labs/nest-profiler) toolkit · Powered & maintained by [Eleven Labs](https://eleven-labs.com)






