DebuggAI (@debugg-ai/node)
Debugg AI's Node sdk for enabling your personal AI QA engineer
DebuggAI super‑charges engineers with an AI‑powered custom QA Engineer personalized to every user that _finds_ and _fixes_ bugs while your app runs locally, in production, or in CI. DebuggAI's Agent works with you in the background to generate, run, and improve your test suites to ensure that every PR is ready to go. Stop waiting for problems to pop up and build robust code without the big headache of managing your tests.
---
## ✨ Why DebuggAI?
Most AI coding tools focus on **writing** code. DebuggAI focuses on the other 50 % of an engineer’s life: **getting it to run.**
- **AI Test Suites** — We let you focus on the code while our QA engineering agent handles the rest. DebuggAI builds & runs test suites in the background to ensure old code continues to run and new code avoids possible edge cases BEFORE it gets to a PR, or worse to your users.
- **1‑line monitoring SDK** — drop‑in client (Node, Python, Go) that captures rich runtime context remotely similar to DebuggAI or Datadog
- **AI Debug** — Errors are instantly sent to failure lines in your IDE so you can see what happened and why, making solving it easy.
- **Instant Fix Suggestions** — one‑click patches and PRs generated from stack‑trace + context
- **Source‑map de‑minification** — readable traces even for bundled / minified front‑end code
- **Branch‑aware log search** — slice errors by branch, release, or feature flag to zero in fast
---
## 📺 Demo - Get Instant Insight Into Runtime Issues
### 🔍 Typical workflows:
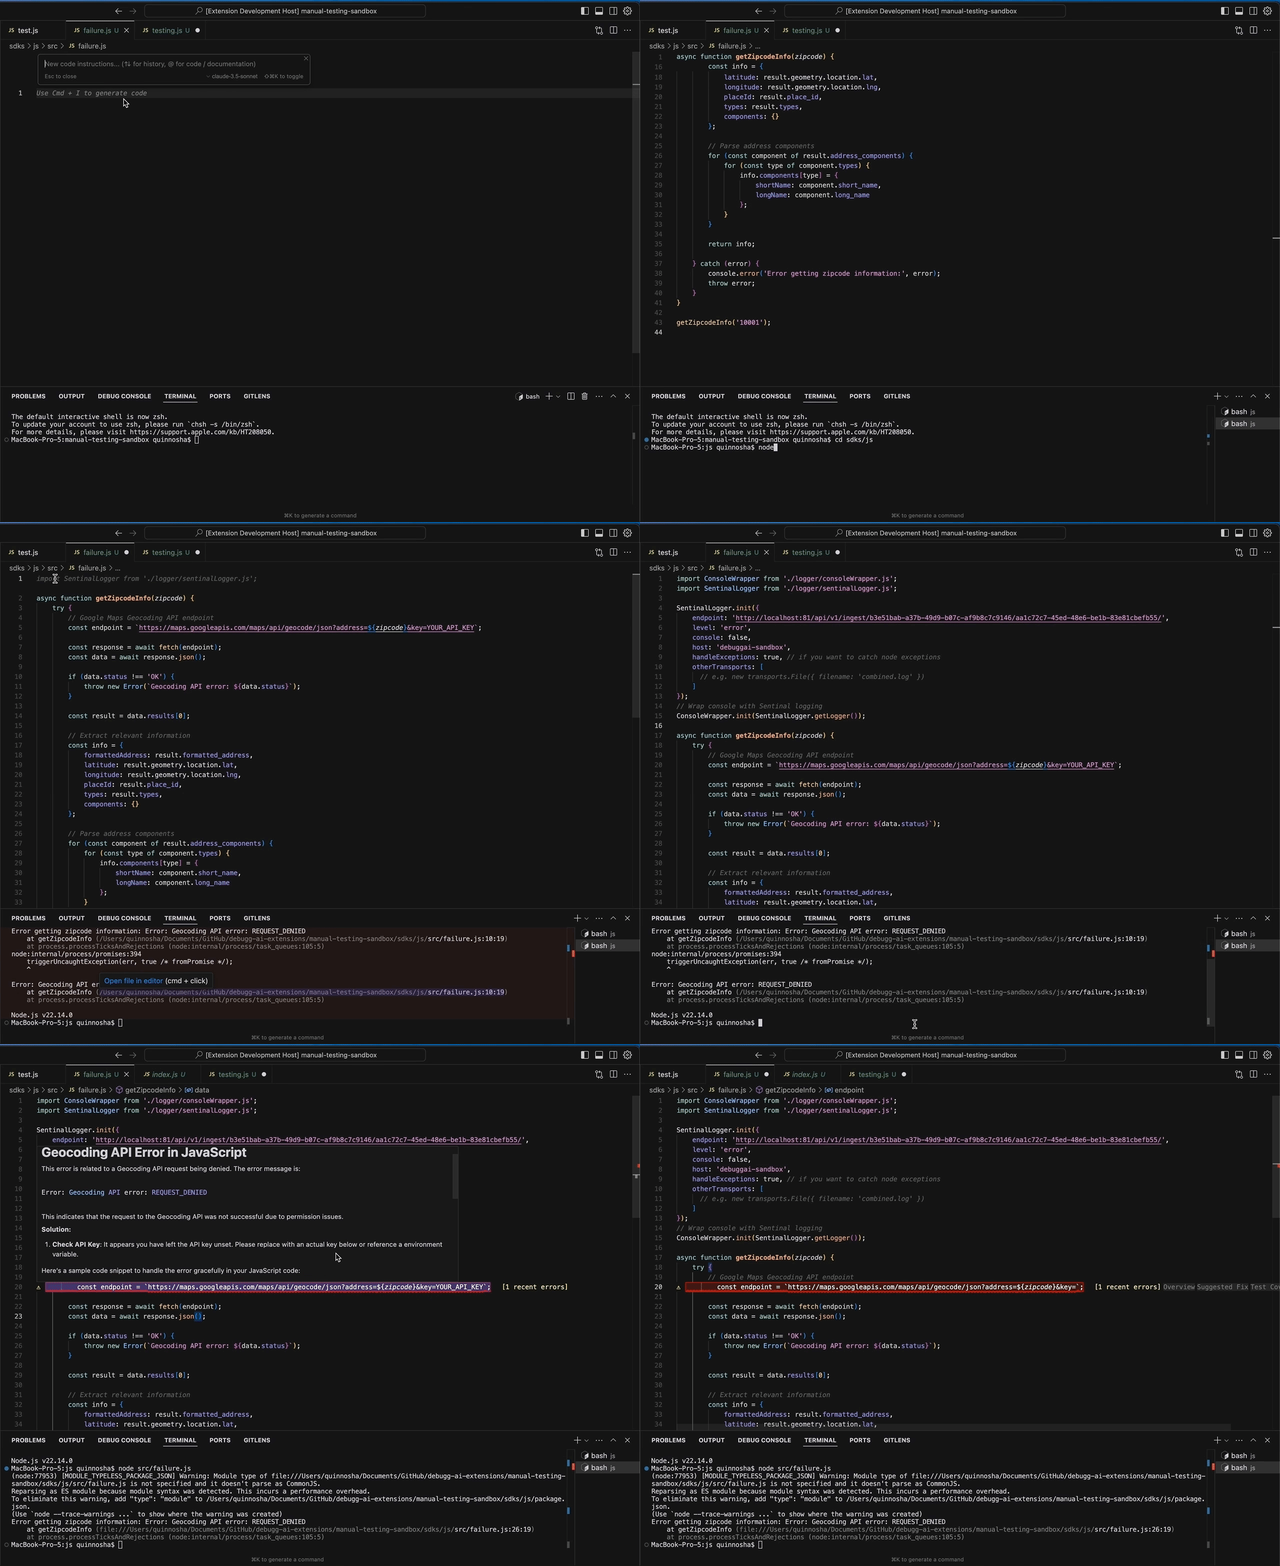
1. You use your favorite AI agent to write code
2. You run your app and it crashes (ah whyyyyy!)
3. DebuggAI sees the error, grabs the full stack trace + context, and uses it to generate a solution & show you EXACTLY where to look
4. You review the solution, edit it locally if needed, and apply it
### 🔍 How it works
---
## 🖥️ Core IDE Features
| Feature | Description |
| ---------------------------- | --------------------------------------------------------------------------------- |
| **Inline Issue Highlighter** | See issues in realtime in your IDE, with full stack traces and suggested fixes |
| **AI Test Generator** | Go from 0 to 100% test coverage for files with a single command |
| **Test iteration** | Run & Improve tests in the background while you code |
| **Future Proof** | Continually add new tests as new errors arise to ensure your code is future proof |
---
## 🚀 Getting Started
1. **Install the extension**
- [VS Code Marketplace](https://marketplace.visualstudio.com/items?itemName=debugg-ai.debuggai)
- Jetbrains coming soon
2. **Create a project**
- [Sign up & create a project in the DebuggAI app](https://app.debugg.ai)

3. **Add the Node Logging SDK** (using `npm` or `yarn`)
```bash
npm install @debugg-ai/node
# Or yarn
yarn add @debugg-ai/node
```
4. **Initialize** (one line):
- Get the initialization code from the DebuggAI app

## Usage
DebuggAI should be initialized as early in your app as possible. It is essential that you call `DebuggAI.init` before you require any other modules in your application, otherwise auto-instrumentation of these modules will **not** work.
You need to create a file named `instrument.js` that imports and initializes DebuggAI:
```js
// CJS Syntax
const DebuggAI = require('@debugg-ai/node');
// ESM Syntax
import * as DebuggAI from '@debugg-ai/node';
DebuggAI.init({
dsn: '__DSN__',
// ...
});
```
You need to require or import the `instrument.js` file before importing any other modules in your application. This is
necessary to ensure that DebuggAI can automatically instrument all modules in your application:
```js
// Import this first!
import './instrument';
// Now import other modules
import http from 'http';
// Your application code goes here
```
### ESM Support
When running your application in ESM mode, you should use the Node.js
[`--import`](https://nodejs.org/api/cli.html#--importmodule) command line option to ensure that DebuggAI is loaded before
the application code is evaluated.
Adjust the Node.js call for your application to use the `--import` parameter and point it at `instrument.js`, which
contains your `DebuggAI.init`() code:
```bash
# Note: This is only available for Node v18.19.0 onwards.
node --import ./instrument.mjs app.mjs
```
If it is not possible for you to pass the `--import` flag to the Node.js binary, you can alternatively use the
`NODE_OPTIONS` environment variable as follows:
```bash
NODE_OPTIONS="--import ./instrument.mjs" npm run start
```
5. **Trigger an error** – head back to the IDE and watch DebuggAI suggest a fix ⚡
Full walkthrough ▶ [docs.debugg.ai/getting-started](https://docs.debugg.ai)
---
## 🛠️ Configuration
You can log in to your DebuggAI account directly in the extension, and then it will automatically connect to your project.
---
## Contact & Support
If you have any questions or need personalized support:
- **Email**: support@debugg.ai
- **Discord**: Join our Discord community at [DebuggAI Discord Server](https://discord.gg/frJsD2Vx)
- **Documentation**: [Official DebuggAI Docs](https://docs.debugg.ai)
---
## 🤝 Interested in Contributing?
We're looking to expand the DebuggAI team!
If you're interested in joining the team or contributing to the project, please reach out to us at [hello@debugg.ai](mailto:hello@debugg.ai).
---
## 📜 License & Credits
- **Code:** [MIT](LICENSE) © 2025 Debugg, Inc.
- **Foundation:** proudly built on open-source technology, see note below.
---
## Attribution
We at Debugg AI want to thank the open-source community for their contributions. Particularly DebuggAI for the work on this SDK. DebuggAI is building the first fully AI QA Engineer that can automatically generate test suites and highlight issues in your app, but DebuggAI continues to be a great option for Application Monitoring. Use both for the best results!
---
Made with ❤️ and too many stack traces in San Francisco.

