# d3fc-annotation
A collection of components for rendering plot area annotations (bands, crosshairs, gridlines and lines) onto Cartesian charts using SVG and canvas.
[Main D3FC package](https://github.com/d3fc/d3fc)
# Installation
```bash
npm install @d3fc/d3fc-annotation
```
# API
## Gridline Annotation
The gridline component renders horizontal and vertical gridlines.
### SVG Rendering
# *fc*.**annotationSvgGridline**()
Constructs a new SVG gridline annotation component. Once constructed, configure the component with scales and call it on a selection -
```js
const xScale = d3.scaleLinear()
.range([0, 100]);
const yScale = d3.scaleLinear()
.range([0, 100]);
const gridline = fc.annotationSvgGridline()
.xScale(xScale)
.yScale(yScale);
d3.select('svg')
.call(gridline);
```
### Canvas Rendering
# *fc*.**annotationCanvasGridline**()
Constructs a new canvas gridline annotation component. Once constructed, configure the component with scales and call it -
```js
var ctx = canvas.getContext('2d');
const xScale = d3.scaleLinear()
.range([0, 100]);
const yScale = d3.scaleLinear()
.range([0, 100]);
const gridline = fc.annotationCanvasGridline()
.xScale(xScale)
.yScale(yScale)
.context(ctx);
gridline();
```
### Common Properties
# *gridline*.**xScale**(*[scale]*)
If *scale* is specified, sets the scale used for the vertical gridline positions (combined with [xTicks](#gridline_xTicks)). Additionally, its [range](https://github.com/d3/d3-scale#continuous_range) is taken as the bounds of the horizontal gridlines. If *scale* is not specified, returns the current xScale.
# *gridline*.**yScale**(*[scale]*)
If *scale* is specified, sets the scale used for the horizontal gridline positions (combined with [yTicks](#gridline_yTicks)). Additionally, its [range](https://github.com/d3/d3-scale#continuous_range) is taken as the bounds of the vertical gridlines. If *scale* is not specified, returns the current yScale.
# *gridline*.**xTicks**(*[count]*)
# *gridline*.**xTicks**(*[interval]*)
If *count* is specified, sets the count passed to [ticks](https://github.com/d3/d3-scale#continuous_ticks) when requesting the horizontal gridline positions when [xScale](#gridline_xScale) is a continuous scale. For other scales, this value is ignored and the [domain](https://github.com/d3/d3-scale#ordinal_domain) is used directly. If *count* is not specified, returns the current count.
When [xScale](#gridline_xScale) is a [time scale](https://github.com/d3/d3-scale#scaleTime) this method can be passed a [time interval](https://github.com/d3/d3-time) to specify the position of the gridlines. For example to generate gridlines every fifteen minutes:
```
gridline.xTicks(d3.timeMinute.every(15));
```
# *gridline*.**xTickValues**(*[values]*)
Manually specify the vertical gridline positions. Overrides [xTicks](#gridline_xTicks).
# *gridline*.**yTicks**(*[count]*)
# *gridline*.**yTicks**(*[interval]*)
If *count* is specified, sets the count passed to [ticks](https://github.com/d3/d3-scale#continuous_ticks) when requesting the vertical gridline positions when [yScale](#gridline_yScale) is a continuous scale. For other scales, this value is ignored and the [domain](https://github.com/d3/d3-scale#ordinal_domain) is used directly. If *count* is not specified, returns the current count.
When [yScale](#gridline_yScale) is a [time scale](https://github.com/d3/d3-scale#scaleTime) this method can be passed a [time interval](https://github.com/d3/d3-time) to specify the position of the gridlines. For example to generate gridlines every fifteen minutes:
```
gridline.yTicks(d3.timeMinute.every(15));
```
# *gridline*.**yTickValues**(*[args]*)
Manually specify the vertical gridline positions. Overrides [yTicks](#gridline_yTicks).
# *gridline*.**xDecorate**(*[decorateFunc]*)
If *decorateFunc* is specified, sets the decorate function used when joining the vertical gridlines to SVG elements or drawing canvas gridlines. If not specified, returns the current decorate function.
# *gridline*.**yDecorate**(*[decorateFunc]*)
If *decorateFunc* is specified, sets the decorate function used when joining the horizontal gridlines to SVG elements or drawing canvas gridlines. If not specified, returns the current decorate function.
### SVG Specific Properties
# *svgGridline*.**xKey**(*[keyFunc]*)
If *keyFunc* is specified, sets the key function used when joining the vertical gridlines to SVG elements. If not specified, returns the current key function.
# *svgGridline*.**yKey**(*[keyFunc]*)
If *keyFunc* is specified, sets the key function used when joining the horizontal gridlines to SVG elements. If not specified, returns the current key function.
### Canvas Specific Properties
# *canvasGridline*.**context**(*ctx*)
If *ctx* is specified, sets the canvas context and returns this series. If *ctx* is not specified, returns the current context.
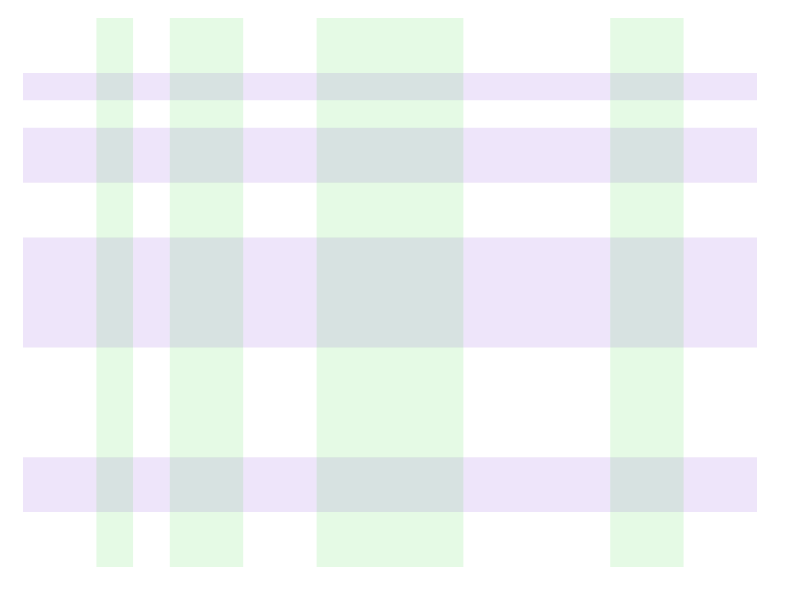
## Band Annotation
The band component renders horizontal and vertical bands.
### SVG Rendering
# *fc*.**annotationSvgBand**()
Constructs a new band annotation component. Once constructed, configure the component with scales, associate a selection with some data representing the band locations and call it on the selection -
```js
const xScale = d3.scaleLinear()
.range([0, 100]);
const yScale = d3.scaleLinear()
.range([0, 100]);
const band = fc.annotationSvgBand()
.xScale(xScale)
.yScale(yScale);
d3.select('svg')
.datum([{ from: 45, to: 55 }])
.call(band);
```
### Canvas Rendering
# *fc*.**annotationCanvasBand**()
Constructs a new band annotation component. Once constructed, configure the component with scales and call with some data representing the band locations -
```js
var ctx = canvas.getContext('2d');
const xScale = d3.scaleLinear()
.range([0, 100]);
const yScale = d3.scaleLinear()
.range([0, 100]);
const band = fc.annotationCanvasBand()
.xScale(xScale)
.yScale(yScale)
.context(ctx);
band([{ from: 45, to: 55 }]);
```
### Common Properties
# *band*.**xScale**(*[scale]*)
If *scale* is specified, sets the scale used for transforming the [fromValue](#band_fromValue)/[toValue](#band_toValue) positions of vertical bands. Additionally, its [range](https://github.com/d3/d3-scale#continuous_range) is taken as the bounds of the horizontal bands. If *scale* is not specified, returns the current xScale.
# *band*.**yScale**(*[scale]*)
If *scale* is specified, sets the scale used for transforming the [fromValue](#band_fromValue)/[toValue](#band_toValue) positions of horizontal bands. Additionally, its [range](https://github.com/d3/d3-scale#continuous_range) is taken as the bounds of the vertical bands. If *scale* is not specified, returns the current yScale.
# *band*.**orient**(*[orientation]*)
If *orientation* is specified, sets the orientation of the bars to either `horizontal` or `vertical`. If *orientation* is not specified, returns the current orientation.
# *band*.**fromValue**(*[accessorFunc]*)
If *accessorFunc* is specified, sets the function used to retrieve the start value for bands. This value will be passed through the appropriate scale. If not specified, returns the current start value.
# *band*.**toValue**(*[accessorFunc]*)
If *accessorFunc* is specified, sets the function used to retrieve the end value for bands. This value will be passed through the appropriate scale. If not specified, returns the current end value.
# *band*.**decorate**(*[decorateFunc]*)
If *decorateFunc* is specified, sets the decorate function used when joining the bands to SVG elements or drawing the canvas. If not specified, returns the current decorate function.
### Canvas Specific Properties
# *canvasBand*.**context**(*ctx*)
If *ctx* is specified, sets the canvas context and returns this series. If *ctx* is not specified, returns the current context.
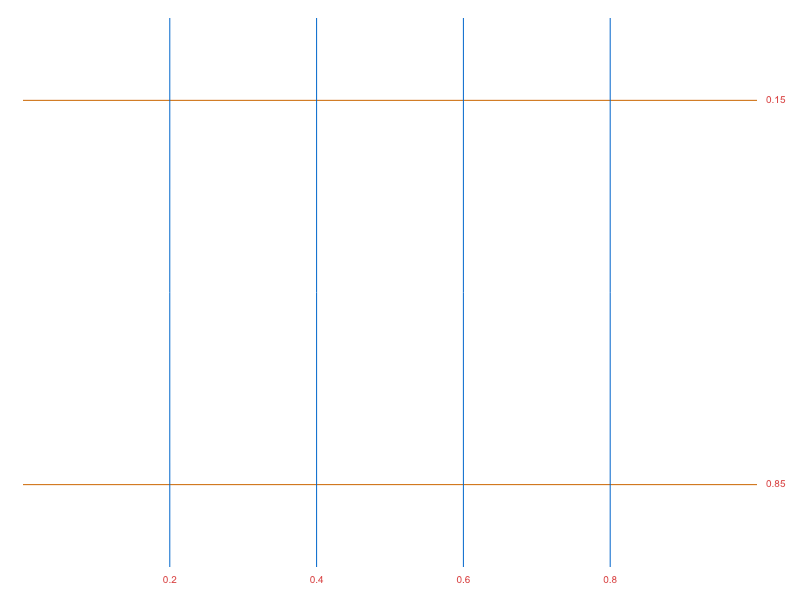
## Line Annotation
The line component renders horizontal and vertical lines.
### SVG Rendering
# *fc*.**annotationSvgLine**()
Constructs a new line annotation component. Once constructed, configure the component with scales, associate a selection with some data representing the line locations and call it on the selection -
```js
const xScale = d3.scaleLinear()
.range([0, 100]);
const yScale = d3.scaleLinear()
.range([0, 100]);
const line = fc.annotationSvgLine()
.xScale(xScale)
.yScale(yScale);
d3.select('svg')
.datum([50])
.call(line);
```
### Canvas Rendering
# *fc*.**annotationCanvasLine**()
Constructs a new line annotation component. Once constructed, configure the component with scales and call it with some data representing the line locations -
```js
var ctx = canvas.getContext('2d');
const xScale = d3.scaleLinear()
.range([0, 100]);
const yScale = d3.scaleLinear()
.range([0, 100]);
const line = fc.annotationCanvasLine()
.xScale(xScale)
.yScale(yScale)
.context(ctx);
line([50]);
```
### Shared Components
# *line*.**xScale**(*[scale]*)
If *scale* is specified, sets the scale used for transforming the [value](#line_value) of the line. Additionally, its [range](https://github.com/d3/d3-scale#continuous_range) is taken as the bounds of the horizontal lines. If *scale* is not specified, returns the current xScale.
# *line*.**yScale**(*[scale]*)
If *scale* is specified, sets the scale used for transforming the [value](#line_value) of the line. Additionally, its [range](https://github.com/d3/d3-scale#continuous_range) is taken as the bounds of the vertical lines. If *scale* is not specified, returns the current yScale.
# *line*.**orient**(*[orientation]*)
If *orientation* is specified, sets the orientation of the lines to either `horizontal` or `vertical`. If *orientation* is not specified, returns the current orientation.
# *line*.**value**(*[accessorFunc]*)
If *accessorFunc* is specified, sets the function used to retrieve the value for lines. This value will be passed through the appropriate scale. If not specified, returns the current value.
# *line*.**label**(*[accessorFunc]*)
If *accessorFunc* is specified, sets the function used to retrieve the label for lines. If not specified, returns the current label.
# *line*.**decorate**(*[decorateFunc]*)
If *decorateFunc* is specified, sets the decorate function used when joining the lines to SVG elements or drawing the lines on the canvas. If not specified, returns the current decorate function.
### Canvas Specific Properties
# *canvasLine*.**context**(*ctx*)
If *ctx* is specified, sets the canvas context and returns this series. If *ctx* is not specified, returns the current context.
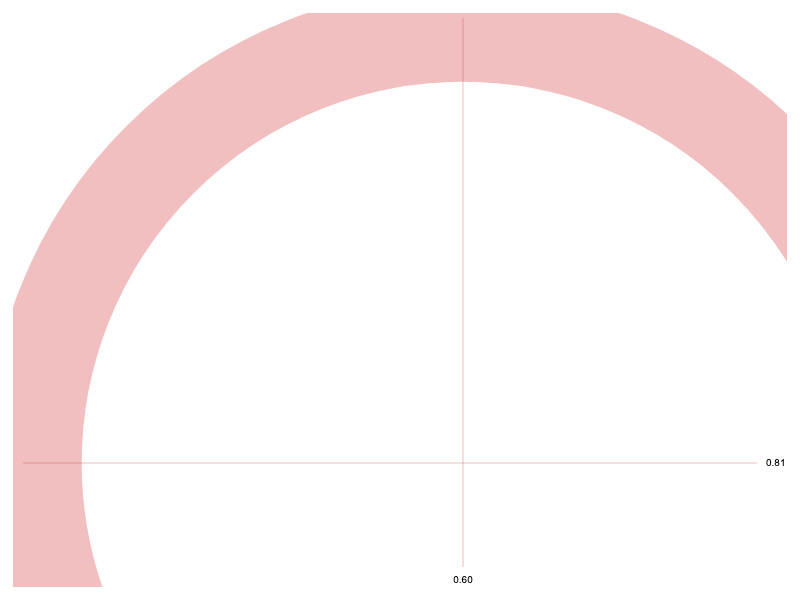
## Crosshair Annotation
The crosshair component renders a pair of vertical and horizontal lines with a point at their center.
### SVG Rendering
# *fc*.**annotationSvgCrosshair**()
Constructs a new crosshair annotation component. Once constructed, configure the component with scales, associate a selection with some data representing the crosshair locations and call it on the selection -
```js
const xScale = d3.scaleLinear()
.range([0, 100]);
const yScale = d3.scaleLinear()
.range([0, 100]);
const crosshair = fc.annotationSvgCrosshair()
.xScale(xScale)
.yScale(yScale);
d3.select('svg')
.datum([{x: 50, y: 50}])
.call(crosshair);
```
### Canvas Rendering
# *fc*.**annotationCanvasCrosshair**()
Constructs a new crosshair annotation component. Once constructed, configure the component with scales and call with some data representing the crosshair locations -
```js
var ctx = canvas.getContext('2d');
const xScale = d3.scaleLinear()
.range([0, 100]);
const yScale = d3.scaleLinear()
.range([0, 100]);
const crosshair = fc.annotationCanvasCrosshair()
.xScale(xScale)
.yScale(yScale)
.context(ctx);
crosshair([{x: 50, y: 50}]);
```
### Common Properties
# *crosshair*.**xScale**(*[scale]*)
If *scale* is specified, sets the scale whose [range](https://github.com/d3/d3-scale#continuous_range) is taken as the bounds of the horizontal lines. If *scale* is not specified, returns the current xScale.
# *crosshair*.**yScale**(*[scale]*)
If *scale* is specified, sets the scale whose [range](https://github.com/d3/d3-scale#continuous_range) is taken as the bounds of the vertical lines. If *scale* is not specified, returns the current yScale.
# *crosshair*.**x**(*[accessorFunc]*)
If *accessorFunc* is specified, sets the function used to retrieve the x position of the crosshair. N.B. this value will **not** be passed through the appropriate scale. If not specified, returns the current value.
# *crosshair*.**y**(*[accessorFunc]*)
If *accessorFunc* is specified, sets the function used to retrieve the y position of the crosshair. N.B. this value will **not** be passed through the appropriate scale. If not specified, returns the current value.
# *crosshair*.**xLabel**(*[accessorFunc]*)
If *accessorFunc* is specified, sets the function used to retrieve the label for vertical lines. If not specified, returns the current label.
# *crosshair*.**yLabel**(*[accessorFunc]*)
If *accessorFunc* is specified, sets the function used to retrieve the label for horizontal lines. If not specified, returns the current label.
### SVG Specific Properties
# *svgCrosshair*.**decorate**(*[decorateFunc]*)
If *decorateFunc* is specified, sets the decorate function used when joining the crosshairs to SVG elements. If not specified, returns the current decorate function.
### Canvas Specific Properties
# *canvasCrosshair*.**decorate**(*[decorateFunc]*)
If *decorateFunc* is specified, sets the decorate function used when drawing the point of the crosshair. If not specified, returns the current decorate function.
# *canvasCrosshair*.**xDecorate**(*[decorateFunc]*)
If *decorateFunc* is specified, sets the decorate function used when drawing the vertical line of the crosshair. If not specified, returns the current decorate function.
# *canvasCrosshair*.**yDecorate**(*[decorateFunc]*)
If *decorateFunc* is specified, sets the decorate function used when drawing the horizontal line of the crosshair. If not specified, returns the current decorate function.
# *canvasCrosshair*.**context**(*ctx*)
If *ctx* is specified, sets the canvas context and returns this series. If *ctx* is not specified, returns the current context.