# **DataDog Reporting Configuration**
## **How to signup and get an API key**
[DataDog](https://www.datadoghq.com/) has several plans for different use cases. You can start a 14-day free trial and get your API Key to collect the test results on your dashboard, or use ours, included in our packaged solutions (for more information, [contact us](mailto:sales@bespoken.io)).
After the signup process, you can create your API key following these steps:
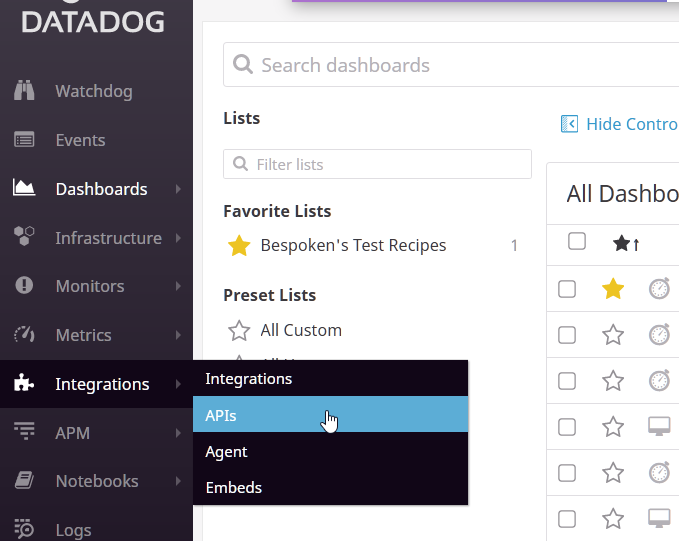
1. Select `APIs` from the left `Integrations` menu.
[ ](images/DataDogCreatingAPIKey.png)
2. Create a new API key in the `API Keys` section.
Then you can copy the value to your `.env` file (use `DATADOG_API_KEY` as variable name), or add it as an environment variable on your CI settings.
## **Creating A Dashboard**
DataDog makes it easy to create a Dashboard:
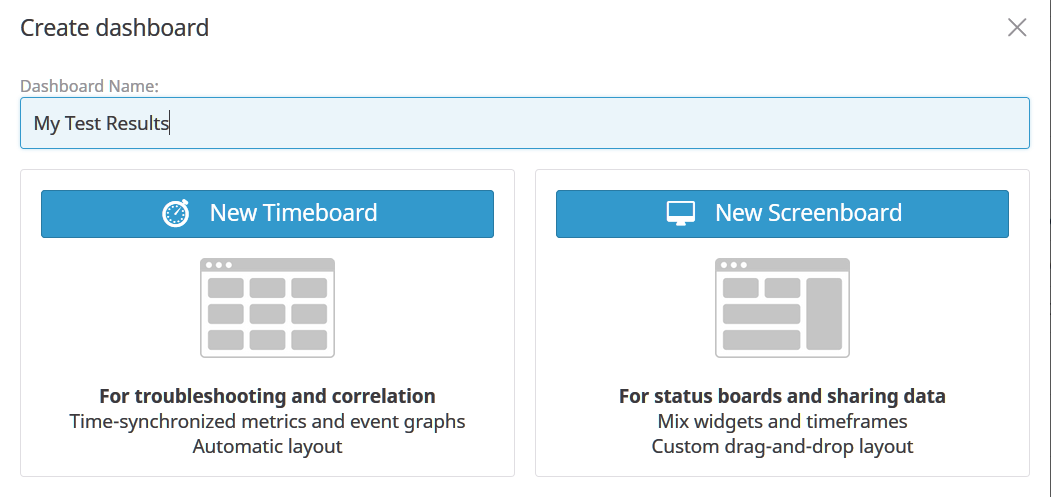
1- Click on Dashboards, then select "New Dashboard" from the left menu. Give the Dashboard a name and select "New Timeboard":
[
](images/DataDogCreatingAPIKey.png)
2. Create a new API key in the `API Keys` section.
Then you can copy the value to your `.env` file (use `DATADOG_API_KEY` as variable name), or add it as an environment variable on your CI settings.
## **Creating A Dashboard**
DataDog makes it easy to create a Dashboard:
1- Click on Dashboards, then select "New Dashboard" from the left menu. Give the Dashboard a name and select "New Timeboard":
[ ](images/DataDogCreatingDashboard2.png)
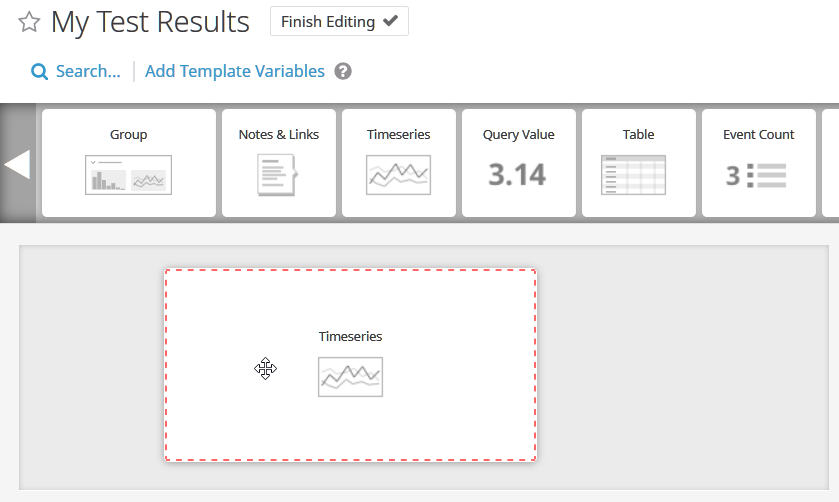
2- Click on "Add a graph". Drag the "Timeseries" widget to the rectangular area below:
[
](images/DataDogCreatingDashboard2.png)
2- Click on "Add a graph". Drag the "Timeseries" widget to the rectangular area below:
[ ](images/DataDogCreatingDashboard3.png)
3- Define the JSON:
```json
{
"viz": "timeseries",
"requests": [
{
"q": "sum:utterance.success{*}.as_count()",
"type": "bars",
"style": {
"palette": "cool",
"type": "solid",
"width": "normal"
},
"aggregator": "avg",
"conditional_formats": []
},
{
"q": "sum:utterance.failure{*}.as_count()",
"type": "bars",
"style": {
"palette": "warm",
"type": "solid",
"width": "normal"
}
}
],
"autoscale": true
}
```
4- Give your graph a title and click on the "Done" button.
Other types of charts and the JSON to create them are described below:
## DataDog Table - Success And Failure Grouped By Tags
Example chart:
[
](images/DataDogCreatingDashboard3.png)
3- Define the JSON:
```json
{
"viz": "timeseries",
"requests": [
{
"q": "sum:utterance.success{*}.as_count()",
"type": "bars",
"style": {
"palette": "cool",
"type": "solid",
"width": "normal"
},
"aggregator": "avg",
"conditional_formats": []
},
{
"q": "sum:utterance.failure{*}.as_count()",
"type": "bars",
"style": {
"palette": "warm",
"type": "solid",
"width": "normal"
}
}
],
"autoscale": true
}
```
4- Give your graph a title and click on the "Done" button.
Other types of charts and the JSON to create them are described below:
## DataDog Table - Success And Failure Grouped By Tags
Example chart:
[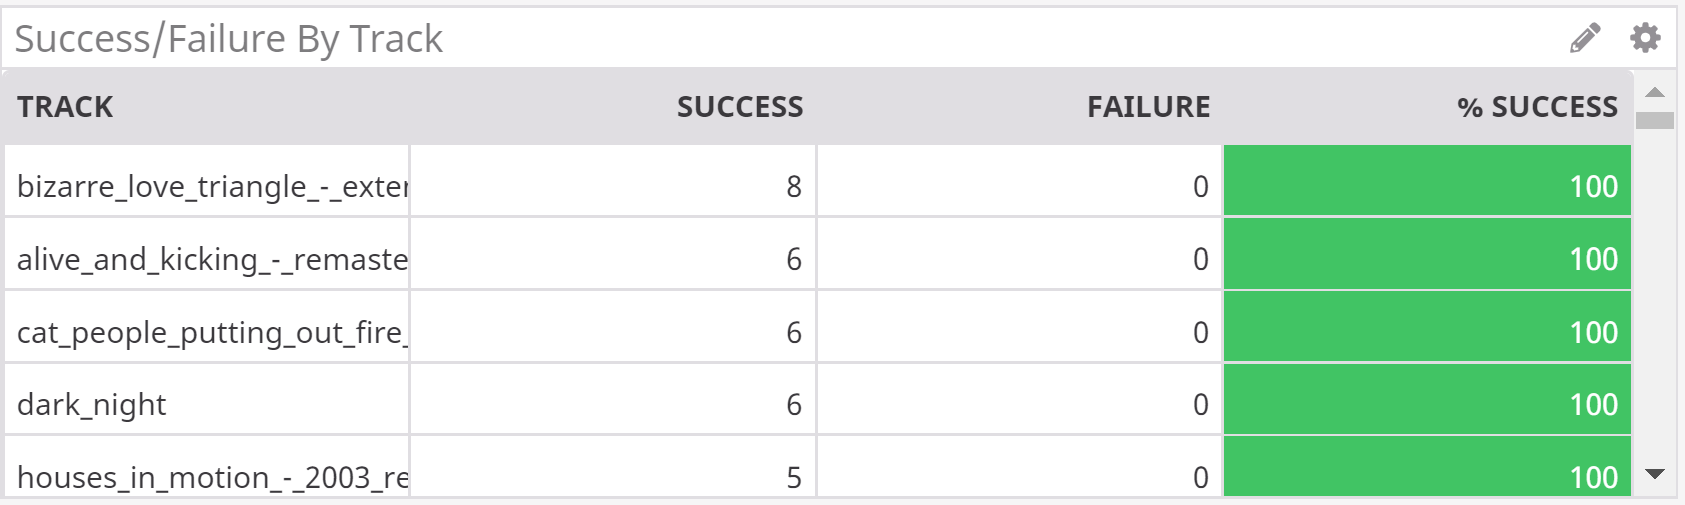 ](images/DataDogTable.png)
The JSON:
```json
{
"viz": "query_table",
"requests": [
{
"q": "sum:utterance.success{customer:customerName} by {utterance}.as_count()",
"conditional_formats": [],
"alias": "Success",
"aggregator": "sum",
"limit": 100,
"order": "desc"
},
{
"q": "sum:utterance.failure{customer:customerName} by {utterance}.as_count()",
"conditional_formats": [],
"alias": "Failure",
"aggregator": "sum"
},
{
"q": "sum:utterance.success{customer:customerName} by {utterance}.as_count()/(sum:utterance.success{customer:customerName} by {utterance}.as_count()+sum:utterance.failure{customer:customerName} by {utterance}.as_count())*100",
"conditional_formats": [
{
"comparator": ">=",
"value": "90",
"palette": "white_on_green"
},
{
"comparator": "<",
"value": "70",
"palette": "white_on_red"
},
{
"comparator": "<",
"value": "90",
"palette": "white_on_yellow"
}
],
"alias": "% Success",
"aggregator": "avg"
}
]
}
```
### DataDog Query Value - a single value:
Example chart:
[
](images/DataDogTable.png)
The JSON:
```json
{
"viz": "query_table",
"requests": [
{
"q": "sum:utterance.success{customer:customerName} by {utterance}.as_count()",
"conditional_formats": [],
"alias": "Success",
"aggregator": "sum",
"limit": 100,
"order": "desc"
},
{
"q": "sum:utterance.failure{customer:customerName} by {utterance}.as_count()",
"conditional_formats": [],
"alias": "Failure",
"aggregator": "sum"
},
{
"q": "sum:utterance.success{customer:customerName} by {utterance}.as_count()/(sum:utterance.success{customer:customerName} by {utterance}.as_count()+sum:utterance.failure{customer:customerName} by {utterance}.as_count())*100",
"conditional_formats": [
{
"comparator": ">=",
"value": "90",
"palette": "white_on_green"
},
{
"comparator": "<",
"value": "70",
"palette": "white_on_red"
},
{
"comparator": "<",
"value": "90",
"palette": "white_on_yellow"
}
],
"alias": "% Success",
"aggregator": "avg"
}
]
}
```
### DataDog Query Value - a single value:
Example chart:
[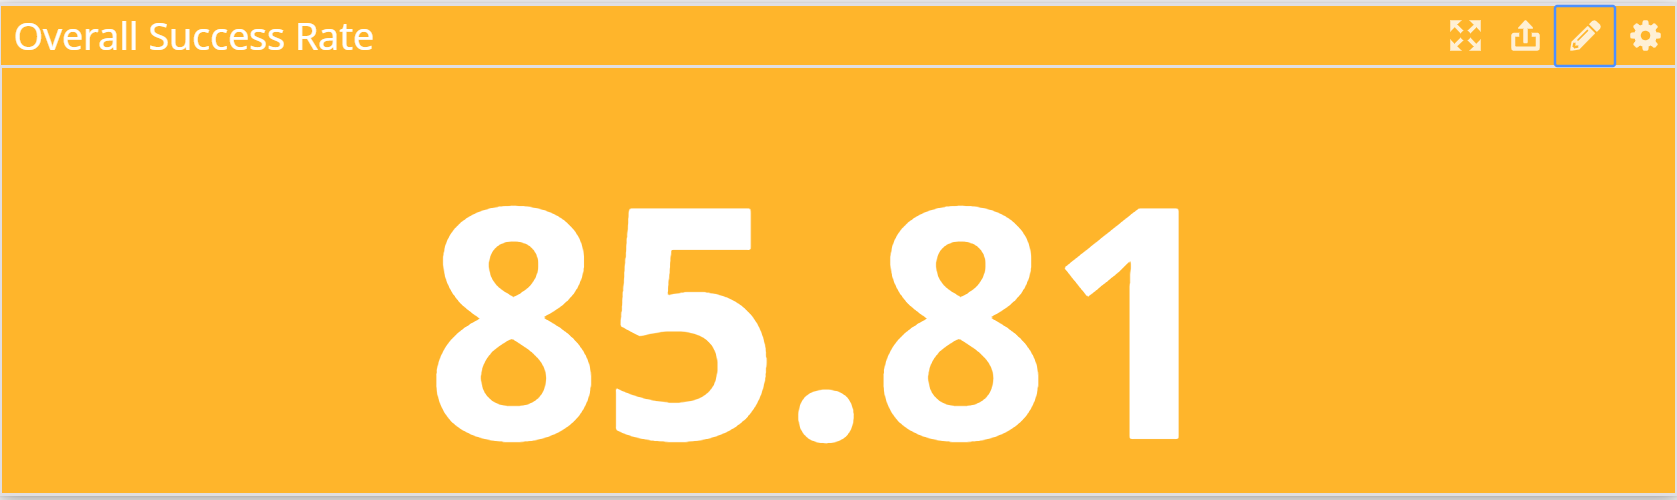 ](images/DataDogQuery.png)
The JSON:
```json
{
"viz": "query_value",
"requests": [
{
"q": "sum:utterance.success{customer:customerName}.as_count()/(sum:utterance.success{customer:customerName}.as_count()+sum:utterance.failure{customer:customerName}.as_count())*100",
"aggregator": "avg",
"conditional_formats": [
{
"comparator": ">=",
"value": "90",
"palette": "white_on_green"
},
{
"comparator": "<",
"value": "70",
"palette": "white_on_red"
},
{
"comparator": "<",
"value": "90",
"palette": "white_on_yellow"
}
]
}
]
}
```
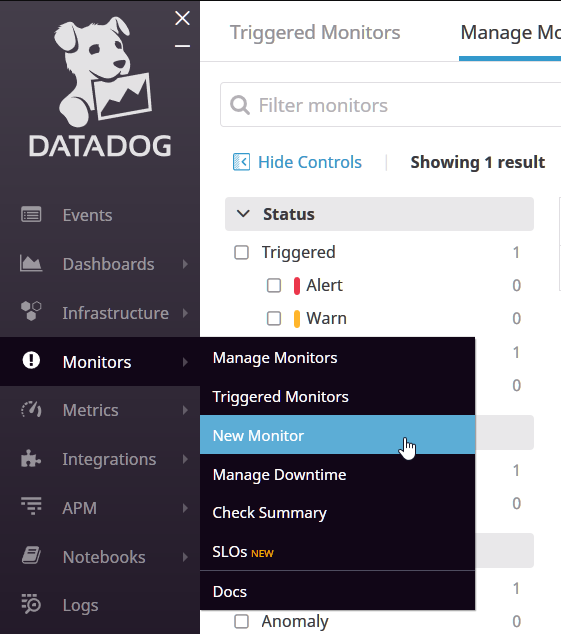
## **Creating Alarms**
DATADOG makes it easy to setup alarms, let's see how:
1- Go to Monitors on the left menu and select "New Monitor":
[
](images/DataDogQuery.png)
The JSON:
```json
{
"viz": "query_value",
"requests": [
{
"q": "sum:utterance.success{customer:customerName}.as_count()/(sum:utterance.success{customer:customerName}.as_count()+sum:utterance.failure{customer:customerName}.as_count())*100",
"aggregator": "avg",
"conditional_formats": [
{
"comparator": ">=",
"value": "90",
"palette": "white_on_green"
},
{
"comparator": "<",
"value": "70",
"palette": "white_on_red"
},
{
"comparator": "<",
"value": "90",
"palette": "white_on_yellow"
}
]
}
]
}
```
## **Creating Alarms**
DATADOG makes it easy to setup alarms, let's see how:
1- Go to Monitors on the left menu and select "New Monitor":
[ ](images/DataDogCreatingAlarm1.png)
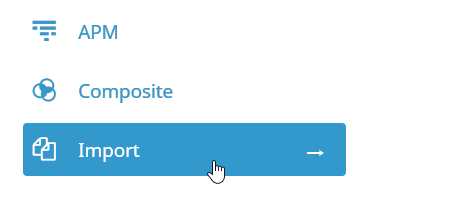
2- Select **Import** as the "monitor type":
[
](images/DataDogCreatingAlarm1.png)
2- Select **Import** as the "monitor type":
[ ](images/DataDogCreatingAlarm2.png)
3- Paste below content in the monitor definition area:
```json
{
"name": "Long audio test failed",
"type": "metric alert",
"query": "sum(last_1h):sum:utterance.failure{*}.as_count() >= 1",
"message": "Please review test results and take action. @all",
"tags": [],
"options": {
"notify_audit": true,
"locked": false,
"timeout_h": 0,
"new_host_delay": 300,
"require_full_window": false,
"notify_no_data": false,
"renotify_interval": "0",
"escalation_message": "",
"no_data_timeframe": null,
"include_tags": true,
"thresholds": {
"critical": 1
}
}
}
```
4- Click on the "Save" button
](images/DataDogCreatingAlarm2.png)
3- Paste below content in the monitor definition area:
```json
{
"name": "Long audio test failed",
"type": "metric alert",
"query": "sum(last_1h):sum:utterance.failure{*}.as_count() >= 1",
"message": "Please review test results and take action. @all",
"tags": [],
"options": {
"notify_audit": true,
"locked": false,
"timeout_h": 0,
"new_host_delay": 300,
"require_full_window": false,
"notify_no_data": false,
"renotify_interval": "0",
"escalation_message": "",
"no_data_timeframe": null,
"include_tags": true,
"thresholds": {
"critical": 1
}
}
}
```
4- Click on the "Save" button