<h1 align="center">L7Plot</h1>

<div align="center">

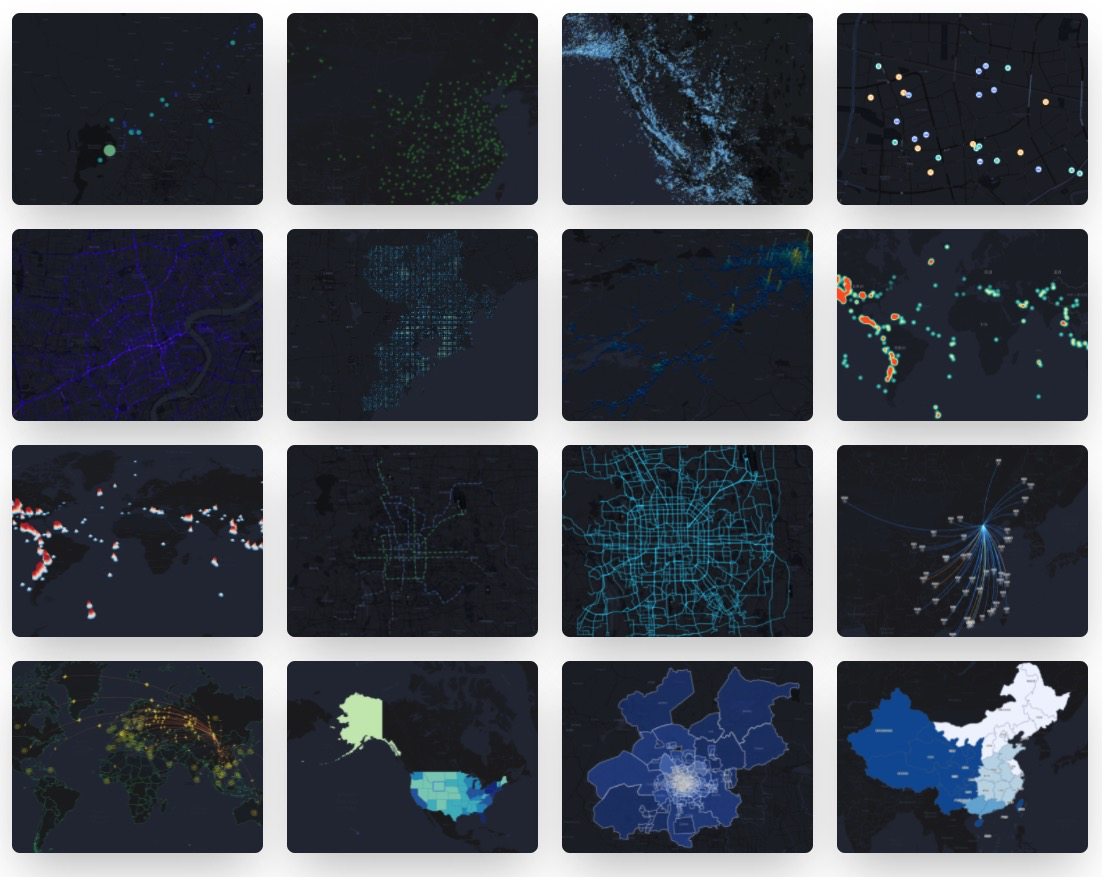
🌍 Geospatial Visualization Chart Library Based on <a href="https://github.com/antvis/L7">L7</a>.

<!-- [![NPM downloads](https://img.shields.io/npm/dm/@antv/l7plot.svg)](https://npmjs.com/@antv/l7plot) -->
<!-- ![Latest commit](https://badgen.net/github/last-commit/antvis/L7Plot) -->

[![Version](https://badgen.net/npm/v/@antv/l7plot)](https://npmjs.com/@antv/l7plot)
![Status](https://badgen.net/github/status/antvis/L7Plot)
[![Release Status](https://github.com/antvis/L7Plot/workflows/release/badge.svg?branch=master)](https://github.com/antvis/L7Plot/actions?query=workflow:release)
[![Coverage Status](https://coveralls.io/repos/github/antvis/L7Plot/badge.svg)](https://coveralls.io/github/antvis/L7Plot)
[![Percentage of issues still open](http://isitmaintained.com/badge/open/antvis/l7plot.svg)](http://isitmaintained.com/project/antvis/l7plot 'Percentage of issues still open')
[![Average time to resolve an issue](http://isitmaintained.com/badge/resolution/antvis/l7plot.svg)](http://isitmaintained.com/project/antvis/l7plot 'Average time to resolve an issue')

<p align="center">
  <a href="https://l7plot.antv.antgroup.com/en">Website</a> •
  <a href="https://l7plot.antv.antgroup.com/en/docs/manual/quick-start">Quick Start</a> •
  <a href="https://l7plot.antv.antgroup.com/zh/docs/api/plot-api">API</a> •
  <a href="https://l7plot.antv.antgroup.com/zh/examples/gallery">Example</a>
</p>

</div>

<div align="center">
  <img src="https://user-images.githubusercontent.com/26923747/160286530-aec01c97-a56b-4ea9-9fc6-f245d8f7b871.png" width="800">
</div>

## ✨ Features

- 📦 Out of the box: configurable geographic charts with built-in multi granularity administrative data
- 🚀 Rich elements: rich chart types and map components, multi map basemap suppor
- 💯 Easy to customize: data driven, from number to shape, support multi-layer and multi map surface stacking
- 🌱 Dynamic interaction: strong chart interaction ability, support 2 / 3D perspective, and provide command dynamic interaction API

## 📦 Installation

```bash
$ npm install @antv/l7 @antv/l7plot
```

## 🔨 Usage

<div align="center">
  <img src="https://gw.alipayobjects.com/zos/antfincdn/Yn%24QslMAWP/20220326145659.jpg" width="600" />
</div>

```html
<div id="container"></div>
```

```ts
import { Dot } from '@antv/l7plot';

const data = [
  { lng: 103.715, lat: 31.211, depth: 10, mag: 5.8, title: 'M 5.8 - eastern Sichuan, China' },
  { lng: 104.682, lat: 31.342, depth: 10, mag: 5.7, title: 'M 5.7 - eastern Sichuan, China' },
  // ...
];

const dot = new Dot('container', {
  map: {
    type: 'mapbox',
    style: 'light',
    center: [103.447303, 31.753574],
    zoom: 7,
  },
  autoFit: true,
  source: {
    data: data,
    parser: { type: 'json', x: 'lng', y: 'lat' },
  },
  color: {
    field: 'mag',
    value: ['#82cf9c', '#10b3b0', '#2033ab'],
    scale: { type: 'quantize' },
  },
  size: {
    field: 'mag',
    value: ({ mag }) => (mag - 4.3) * 10,
  },
  state: { active: true },
  scale: { position: 'bottomright' },
  legend: { position: 'bottomleft' },
  tooltip: {
    items: ['title', 'mag', 'depth'],
  },
});
```

## Local Development

```bash
# Global installation yarn
$ npm install yarn -g

# Install project dependencies
$ yarn bootstrap

# Compile each package in real time and start the storybook
$ yarn dev

# Run website
$ yarn dev-website

# Run unit tests
$ yarn test

# open electron for unit tests
$ yarn test-live
```

## 🤝 How to Contribute

Your contributions are always welcome! Please Do have a look at the [issues](https://github.com/antvis/l7plot/issues) first.

To become a contributor, please follow our [contributing guide](https://github.com/antvis/l7plot/blob/master/CONTRIBUTING.md).

## License

MIT
