# amCharts 5
JavaScript and TypeScript charts and maps for the web: line, column, area and
candlestick charts, pies and funnels, geographic maps, stock charts, Gantt
charts, treemaps and other hierarchies, Sankey and chord diagrams, radars and
gauges, timelines, word clouds and Venn diagrams.
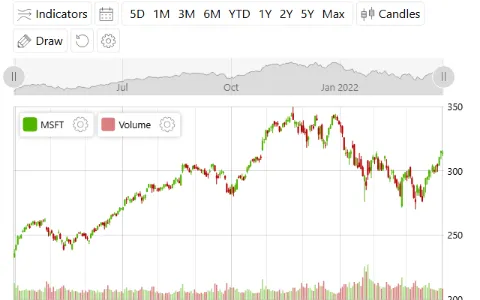
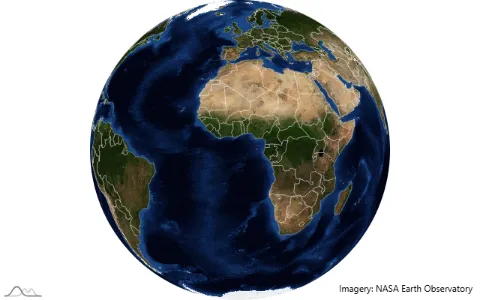
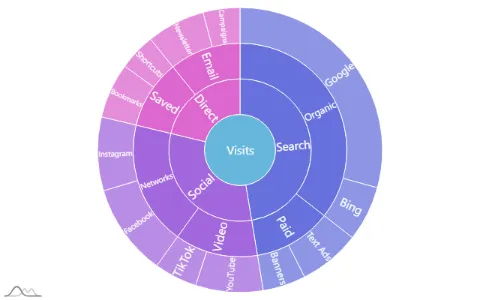
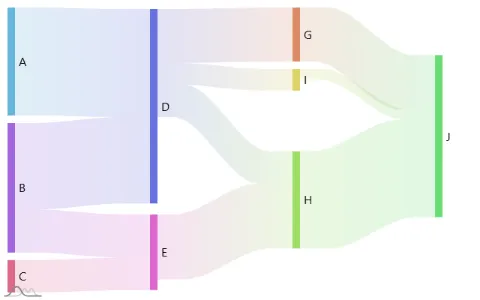
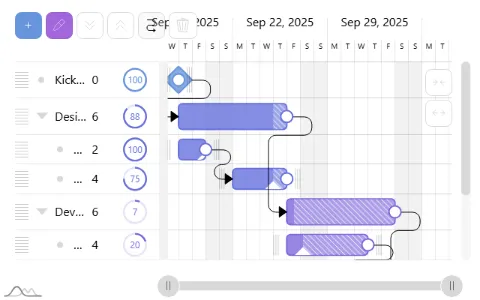
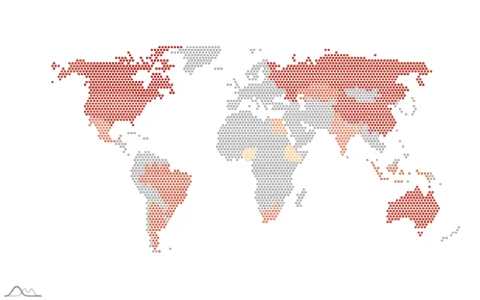
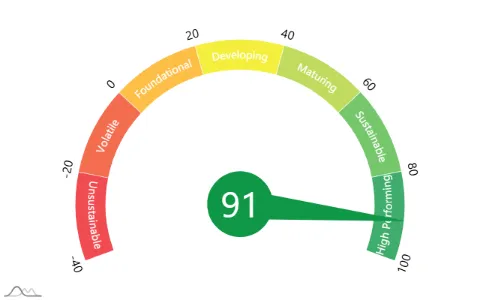
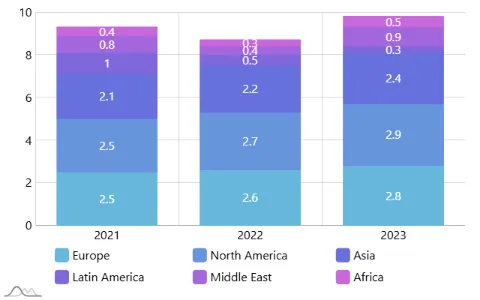
Each picture links to its example's code.
[Demos](https://www.amcharts.com/demos/) |
[Documentation](https://www.amcharts.com/docs/v5/) |
[Class reference](https://www.amcharts.com/docs/v5/reference/) |
[Changelog](https://github.com/amcharts/amcharts5/blob/master/packages/shared/CHANGELOG.md) |
[Download](https://www.amcharts.com/download/)
## Install
With npm, for a project that uses a bundler:
```
npm install @amcharts/amcharts5
```
With script tags, from the CDN or from the files in the
[zip download](https://www.amcharts.com/download/):
```html
```
Maps need map files (geodata), which are a separate package:
[npm](https://www.npmjs.com/package/@amcharts/amcharts5-geodata),
[GitHub](https://github.com/amcharts/amcharts5-geodata),
[zip](https://www.amcharts.com/download/).
## A first chart
The page needs an element with a height:
```html
```
```js
import * as am5 from "@amcharts/amcharts5";
import * as am5xy from "@amcharts/amcharts5/xy";
import am5themes_Animated from "@amcharts/amcharts5/themes/Animated";
const root = am5.Root.new("chartdiv");
root.setThemes([
am5themes_Animated.new(root)
]);
const chart = root.container.children.push(am5xy.XYChart.new(root, {}));
const xAxis = chart.xAxes.push(am5xy.CategoryAxis.new(root, {
categoryField: "country",
renderer: am5xy.AxisRendererX.new(root, {})
}));
const yAxis = chart.yAxes.push(am5xy.ValueAxis.new(root, {
renderer: am5xy.AxisRendererY.new(root, {})
}));
const series = chart.series.push(am5xy.ColumnSeries.new(root, {
xAxis: xAxis,
yAxis: yAxis,
categoryXField: "country",
valueYField: "visits"
}));
const data = [
{ country: "France", visits: 1114 },
{ country: "Germany", visits: 1322 },
{ country: "Spain", visits: 711 },
{ country: "Italy", visits: 984 }
];
xAxis.data.setAll(data);
series.data.setAll(data);
```
With script tags the code is the same without the three `import` lines: each
file makes its module a global of the same name (`am5`, `am5xy`,
`am5themes_Animated`).
In a component (React, Angular, Vue), create the chart when the component is
mounted and call `root.dispose()` when it is removed. There are guides for
[React](https://www.amcharts.com/docs/v5/getting-started/integrations/react/),
[Angular](https://www.amcharts.com/docs/v5/getting-started/integrations/angular/),
[Vue](https://www.amcharts.com/docs/v5/getting-started/integrations/vue/),
[Next.js](https://www.amcharts.com/docs/v5/getting-started/integrations/next-js/)
and [others](https://www.amcharts.com/docs/v5/getting-started/integrations/).
## Chart types
| Charts | Module | Script file |
|---|---|---|
| [XY](https://www.amcharts.com/docs/v5/charts/xy-chart/): line, area, column, bar, scatter, candlestick | `@amcharts/amcharts5/xy` | `xy.js` |
| [Pie and sliced](https://www.amcharts.com/docs/v5/charts/percent-charts/): pie, donut, funnel, pyramid | `@amcharts/amcharts5/percent` | `percent.js` |
| [Map](https://www.amcharts.com/docs/v5/charts/map-chart/) | `@amcharts/amcharts5/map` | `map.js` |
| [Stock](https://www.amcharts.com/docs/v5/charts/stock/) | `@amcharts/amcharts5/stock` | `stock.js` |
| [Gantt](https://www.amcharts.com/docs/v5/charts/gantt/) | `@amcharts/amcharts5/gantt` | `gantt.js` |
| [Hierarchy](https://www.amcharts.com/docs/v5/charts/hierarchy/): treemap, sunburst, force-directed, tree, pack | `@amcharts/amcharts5/hierarchy` | `hierarchy.js` |
| [Flow](https://www.amcharts.com/docs/v5/charts/flow-charts/): Sankey, chord, arc diagram | `@amcharts/amcharts5/flow` | `flow.js` |
| [Radar and gauges](https://www.amcharts.com/docs/v5/charts/radar-chart/) | `@amcharts/amcharts5/radar` | `radar.js` |
| [Timeline](https://www.amcharts.com/docs/v5/charts/timeline/): serpentine, spiral, curve | `@amcharts/amcharts5/timeline` | `timeline.js` |
| [Word cloud](https://www.amcharts.com/docs/v5/charts/word-cloud/) | `@amcharts/amcharts5/wc` | `wc.js` |
| [Venn](https://www.amcharts.com/docs/v5/charts/venn/) | `@amcharts/amcharts5/venn` | `venn.js` |
Stock, Gantt, radar and timeline charts are built on XY charts: with script
tags, load `xy.js` before them. Gantt also needs `plugins/colorPicker.js`.
Also in the library:
* Maps: globes and flat maps, satellite images with day and night, pixel maps,
and map files for the world, continents, countries and their regions.
* Stock charts: over 30 indicators, drawing tools, comparing stocks and period
selectors.
* [Export](https://www.amcharts.com/docs/v5/concepts/exporting/): PNG, JPG,
SVG, PDF, CSV, XLSX, JSON and HTML, and printing.
* [30 themes](https://www.amcharts.com/docs/v5/concepts/themes/), among them
dark, colorblind-friendly and responsive ones.
* [Accessibility](https://www.amcharts.com/docs/v5/concepts/accessibility/):
keyboard navigation and screen reader support.
## Examples
About 80 examples come with the library, one small chart each.
* In the zip download, open `examples/index.html`: a gallery where every
example runs above its source.
* In the npm package they are sources: `examples//index.ts`, indexed in
`examples/README.md` and `examples/examples.json`.
* More, and bigger ones, are in the [demos](https://www.amcharts.com/demos/)
on the website.
## Charts from JSON, and SVG
A chart can be described as [a JSON config](https://www.amcharts.com/docs/v5/concepts/serializing/)
and built with `JsonParser`, and a running chart can be saved as one. Most
examples come with their config.
The `` element builds a chart from a config with no chart code at
all, which suits plain pages, frameworks and tools that only take HTML:
```html
```
The config comes from `src`, from a `config` attribute, or from the `config`
property. With script tags, load `plugins/json.js` before `element.js`, and
the file of every chart type the config uses; with npm, `import "@amcharts/amcharts5/element";` defines the element,
the chart types load by themselves, and themes are given as classes:
`element.themes = [am5themes_Animated]`. Once the chart is built,
`element.root` and `element.chart` hold it; `element.whenReady()` returns a
promise of it, and the element dispatches `ready` (or `error`).
Charts are drawn on canvas. To draw one as SVG instead, create its root with
`am5.Root.new("chartdiv", { renderer: am5.SVGRenderer })`.
## Using amCharts with AI coding agents
The library carries what an agent needs, so that it works from these files and
not from what it remembers:
* `AGENTS.md`: the rules that are most often broken, and where to look.
* `docs/`: a reference for every chart type.
* `examples/`: working code to start from.
To make an agent use them, add this to your project's `AGENTS.md` or
`CLAUDE.md`:
```md
## amCharts 5
This project uses amCharts 5 (`@amcharts/amcharts5`). Its API is not the
amCharts 4 API, and it may be newer than what you remember.
Before writing chart code, read `node_modules/@amcharts/amcharts5/AGENTS.md`
and follow it.
```
With the script files, point it at the `AGENTS.md` in the amCharts folder
instead.
There is also an [MCP server](https://www.amcharts.com/docs/v5/ai/mcp/)
(`npx -y @amcharts/amcharts5-mcp`), a
[skill](https://github.com/amcharts/amcharts5-skill), and
[more about amCharts and AI](https://www.amcharts.com/docs/v5/ai/).
## License
If you have a commercial amCharts 5 license, this software is covered by your
license, which supersedes any other license bundled with this package.
If you don't have a commercial license, the use of this software is covered by
a freeware license. See the included LICENSE file. The license is also
[available online](https://github.com/amcharts/amcharts5/blob/master/packages/shared/LICENSE).
In short: the free license allows use in any project, commercial ones
included, as long as the amCharts logo stays on the charts and the LICENSE file
stays with the files. It does not allow selling the library or distributing it
on its own. The LICENSE file has the exact terms, and
[commercial licenses](https://www.amcharts.com/online-store/) cover what it
does not.
## Support
Found a bug, or have a question? Open an
[issue on GitHub](https://github.com/amcharts/amcharts5/issues): the amCharts
team monitors them.
Guaranteed support comes with the amPlus subscription. If you have a license
or subscription, you can
[contact us directly](https://www.amcharts.com/support/support-info/priority-support/).
If you don't, here are
[a few more options](https://www.amcharts.com/support/support-info/free-support/).
Anything else: contact@amcharts.com.
## More
* [amCharts 5 changelog](https://github.com/amcharts/amcharts5/blob/master/packages/shared/CHANGELOG.md),
also in this package as `CHANGELOG.md`
* [Documentation changelog](https://www.amcharts.com/docs/v5/changelog/)
* [Creating translations](https://www.amcharts.com/docs/v5/concepts/locales/creating-translations/)
* [Source code on GitHub](https://github.com/amcharts/amcharts5)