
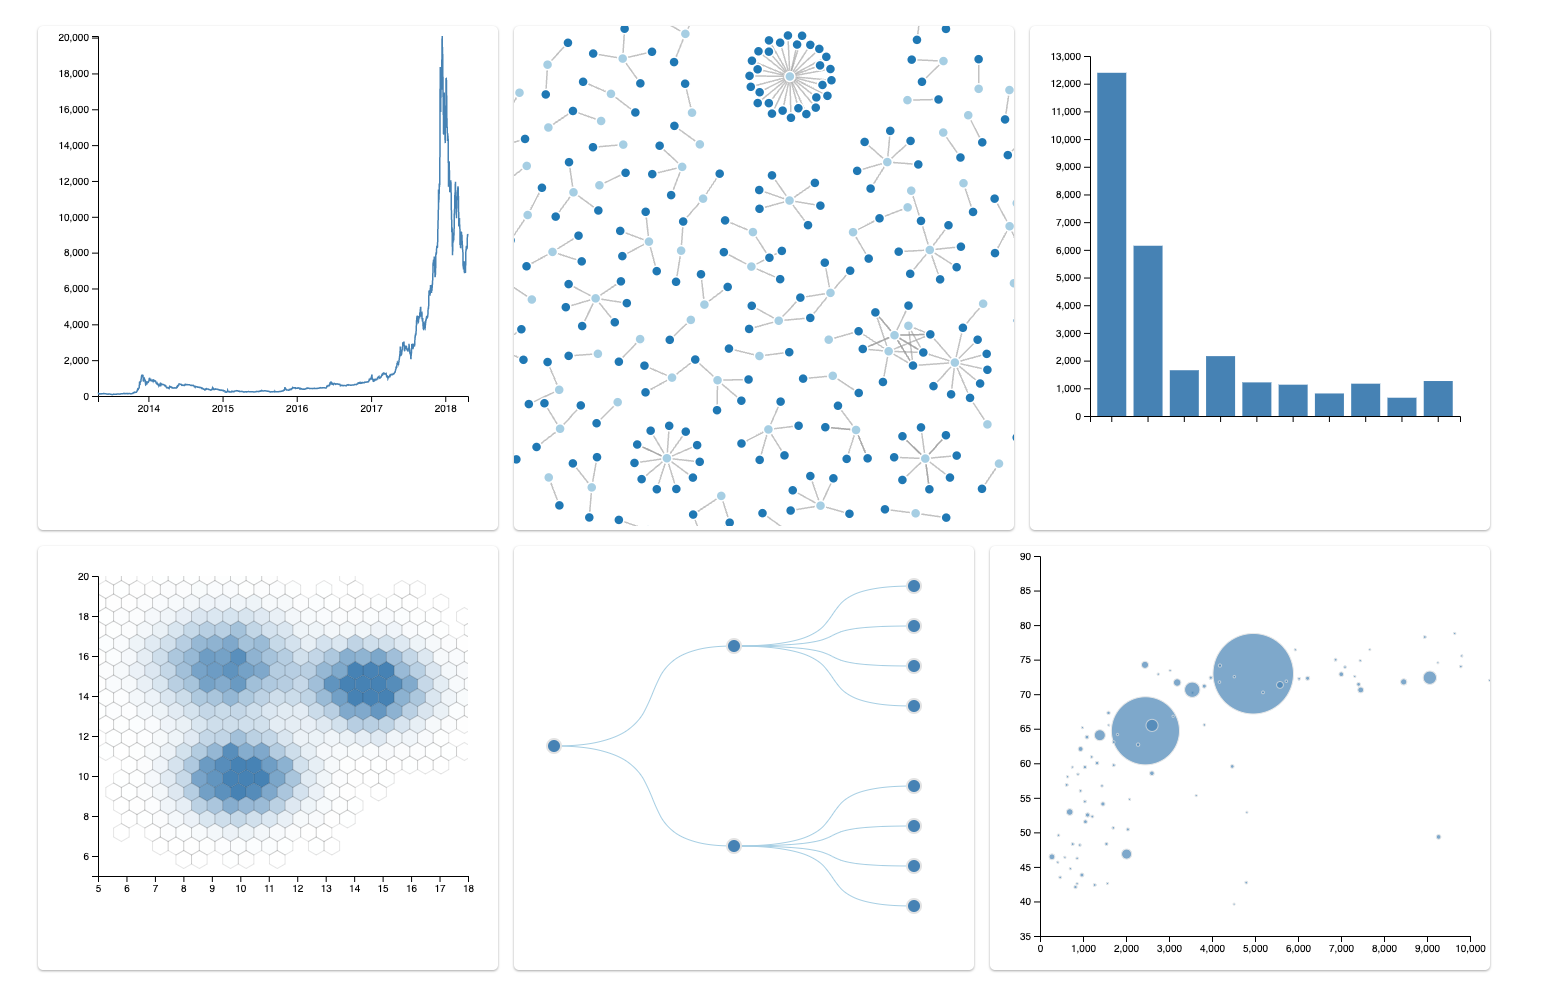
Acho's visualization library (built on top of d3)
> NOTICE: This package is not yet production ready. Please refer to the requirements roadmap.
## 📦 Getting Started
---
```bash
# get the code
git clone https://@bitbucket.org/unibit_web/acho-viz.git
# install dependencies
npm install
# spin it up
npm start
```
## 🦾 Development
---
When developing, you can test changes in the playground.
## 🫣 Testing
---
At this time, tests have not been written. But the scaffolding is there ;)
## 🚀 Deployment
---
TODO
1. `npm publish`
## Acho Viz Roadmap
---
**Why build acho-viz?**
There are plenty of visualization libraries that serve plug-n-play charts. acho-viz will provide this functionality but it utltimately should provide a way for user's to build or define their own charts.
Below I've outlined a high-level phase plan; hopefully this helps articulate the vision for acho-viz.
**Phase I** - Basic Charting Library Functionality
**Phase II** - Advanced Charting Library Functionality
**Phase III** - User defined charts via acho-viz api or d3 api
## Requirements Roadmap
---
acho-viz is not production ready. Requirements that must be completed before a release candidate are marked with a 🔵.
1. **Better support for different data scales/series** 🔵
- At this time, the charts primarily consume data that is oriented in either linear form or categorical form without much programmatic flexibility.
- For example, the bar chart class assumes that the values associated with the x-axis are categories and the y-axis values are numerical.
- But if you wanted the bar chart to consume 'time series' data you would have to manually perform some pre-processing on the data and manually configure the axis scales. This isn't exactly ideal (in terms of usability), so there should be a more high-level way to automatically parse the data and configure the axis but this has yet to be designed.
2. **Support for chart style customizations** 🔵
- User should be able to customize things such as line colors and border widths.
- There is a proof of concept implemented for this but an elegant solution is yet to be designed.
3. **Support for chart animations** 🔵
4. **Better responsiveness** 🔵
- When a chart instance's parent container is resized, the chart should also adhere to the parent's dimensions.
5. **Better tooltip support** 🔵
- There is a proof of concept version for this integrated into the bar chart class but a more desirable solution has yet to be prioritized.
6. **Add more advanced chart support**
- Such as maps, multi-line charts, horizontal bar charts, etc.
7. **Expose an api that serves as a d3-api wrapper or fully expose the d3-api.**
- This would allow users to build or define their own charts and advanced visualizations.
8. **Support rendering charts on svg AND canvas**