Hierarchicagl Flash
Yuxin Zou
7/14/2018
Last updated: 2018-07-14
Code version: 2c8172d
library(flashr); library(ggplot2); library(reshape2)Plot function:
plot_HP = function(title_name, mat, absolute = TRUE){
  p1 = ggplot(data = mat, aes(Var2, Var1, fill = value))+geom_tile(color = "white")+
    scale_fill_gradient2(low = "darkblue", high = "darkred", mid = "white",
     midpoint = 0, space = "Lab") + labs(title = title_name, y = "samples", x = "variables") +
    # scale_fill_gradient2(low = "white", high = "grey6", mid = "grey9", midpoint = 0.41, limit = c(0,0.82), space = "Lab") + labs(title = title_name, y = "samples", x = "variables") +
    theme_minimal() + theme(legend.position="none",plot.title = element_text(size = 12.9, face = "bold"))
  p1
}
Model Outline
In flash model, we have \[ Y_{n\times p} = L_{n \times k}F_{p\times k}^{T} + E_{n\times p} \] We could find some patterns of the data Y based on the factors in F. But the patterns depend on the loadings L. We run flash on L again \[ L_{n\times k} = O_{n\times r} A_{k\times r}^{T} + R_{n\times k} \]
From the factors A, we can check the dependence of factors in F.
I simulate Y with 5 conditions (p = 5). Some have equal effect in all conditions; some have equal effect in consition 3, 4 and 5, but stronger effect in condition 1 and 2 (all effects are in the same direction); some have effect only in the last condition.
Summary from the simulation:
From the simulation, we see factors with loadings both positive or both negative, and also see cases where one loading is positive and the other is negative.
Question:
We interprete the factor as a pattern in the data
Y. For example, in GTEx data, we say a factor with approximately equal weight for every tissue reflects that many eQTLs have similar effects accross all tissues. I doubt whether our interpretation is correct. The pattern in Y depends on L. If some rows of L have 2 large entries, then those samples depend on 2 factors. The pattern inYis actually a linear combination of the 2 factors. Therefore, we perform factor analysis onLagain. Using the new factorsA, we check if there is a linear combination of factorsF.My question is that the actual pattern in
Yis still depending on the new loadingO. The rows of loadingOcould also have several large entries, which suggests that the pattern inYdepends on a combination of factors. I don’t have an example for this case yet. So I think we cannot say the factors summarize the patterns in the data.The pattern in the data depends on loadings, and we don’t have any summary about the loadings.
Simulation
flashdata = function(n, FF, LL, Lsd, err_sd){
  k = ncol(FF)
  p = nrow(FF)
  LLL = matrix(0,0,k)
  for(i in 1:nrow(LL)){
    temp = matrix(rnorm(n * k, sd = Lsd), n, k)
    direction = c(sign(temp[,1]))
    temp2 = direction * abs(temp)
    LLL = rbind(LLL, t(t(temp2) * LL[i,] ))
  }
  Ytrue = LLL %*% t(FF)
  Y = Ytrue + matrix(rnorm(n*nrow(LL)*p, sd = err_sd), n*nrow(LL), p)
  return(list(Y = Y, Ytrue = Ytrue))
}
set.seed(1)
FF = cbind(c(1,1,1,1,1), c(1,1,0,0,0), c(0,0,0,0,1))
LL = rbind(c(1,0,0), c(0,0,1), c(0.3,0.7,0))
data = flashdata(500, FF, LL, 4,0.5)Flash model (loading opposite sign)
Using greefy+backfit flash method:
f1 = flash(data$Y, greedy = TRUE, backfit = TRUE)fitting factor/loading 1fitting factor/loading 2fitting factor/loading 3fitting factor/loading 4ff1 = flash_get_ldf(f1)$f; Loadings1 = flash_get_ldf(f1)$l * flash_get_ldf(f1)$dThe factors are
par(mfrow=c(1,3))
for(i in 1:ncol(ff1)){
  barplot(ff1[,i], main = paste0('Factor ', i, ', pve=', round(flash_get_pve(f1)[i],3)))
}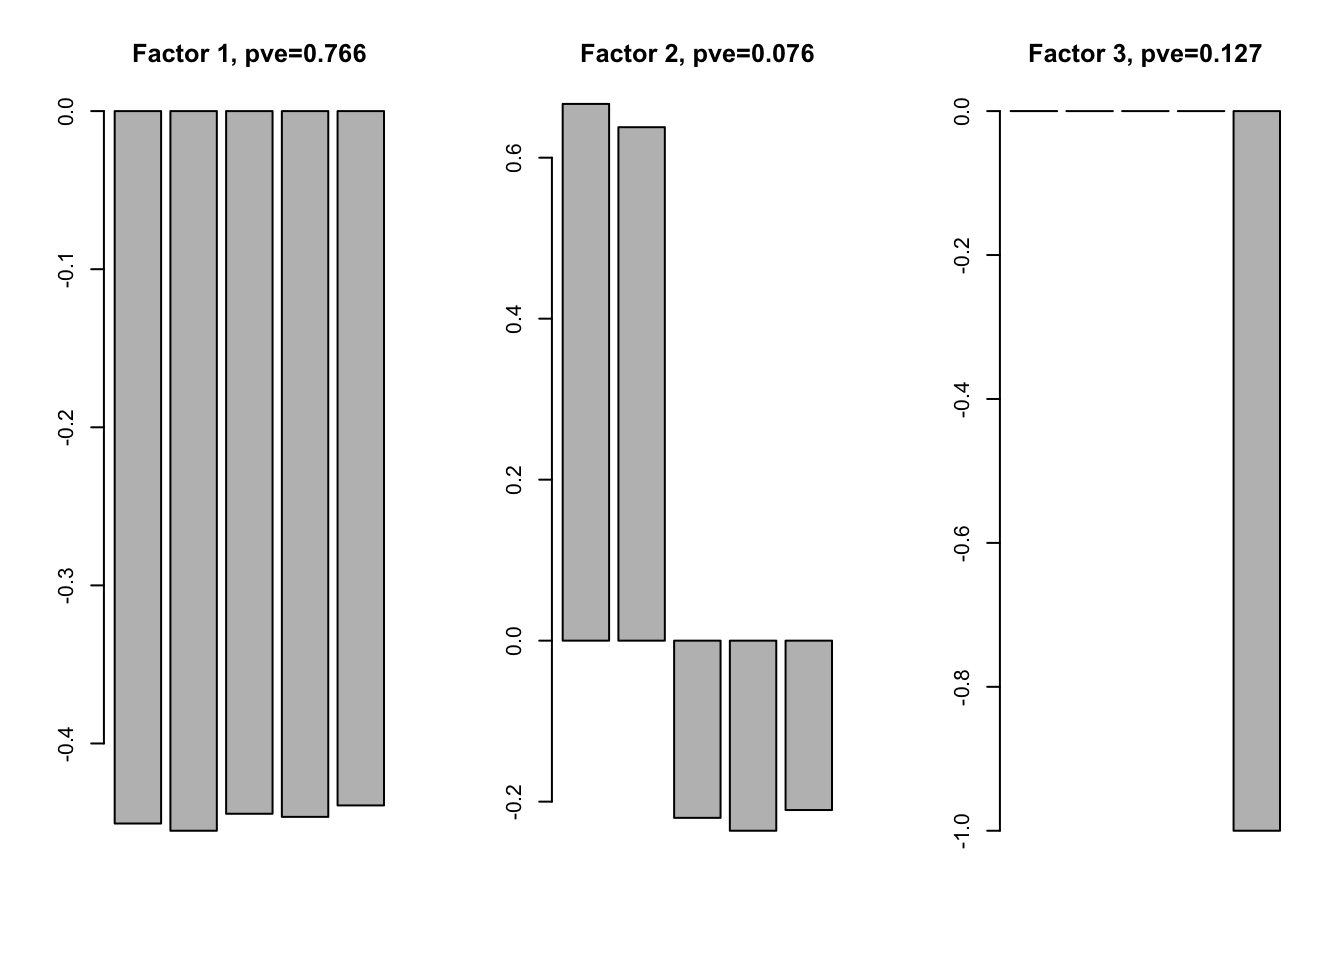
The factor 1 and 3 reflect the pattern in the simulated data. But for factor 2, we expect they have effect in the same direction. Factor 2 is not a pattern in the data. The real pattern is a combination of factor 1 and 2.
Let’s check the L matrix
melted_Loading = melt(Loadings1)
melted_Loading_zoom = melt(Loadings1[1001:1500,])
p1 = plot_HP('Loading', melted_Loading)
p2 = plot_HP('Loading 1001-1500', melted_Loading_zoom)
gridExtra::grid.arrange(p1,p2, ncol = 2)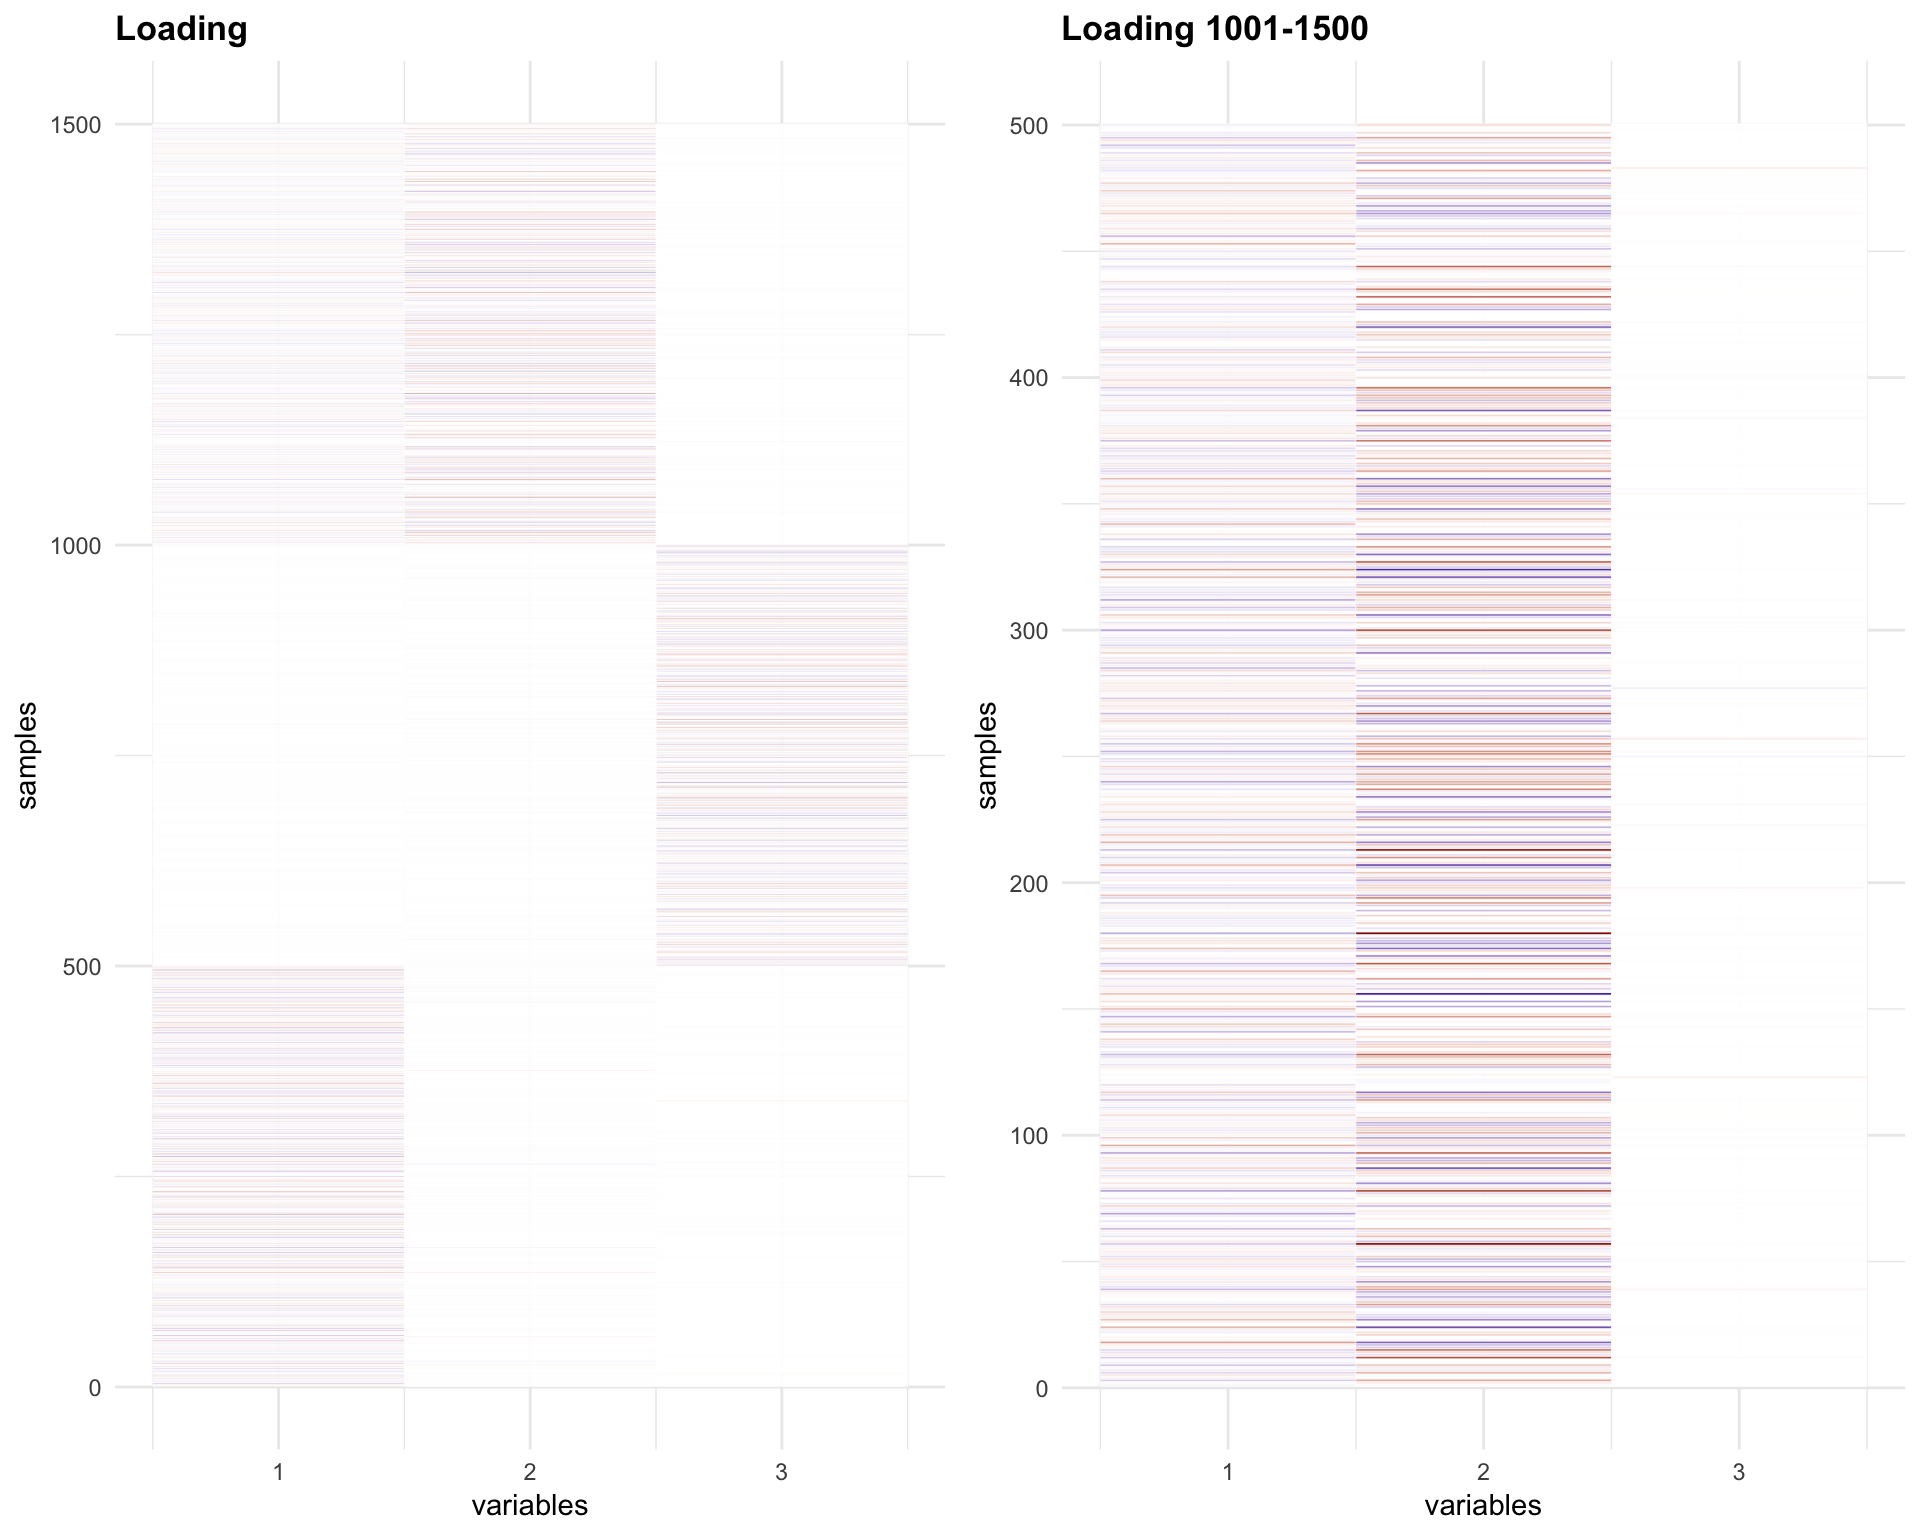
The Loadings for the last 500 samples (1001-1500) have opposite sign for factor 1 and 2.
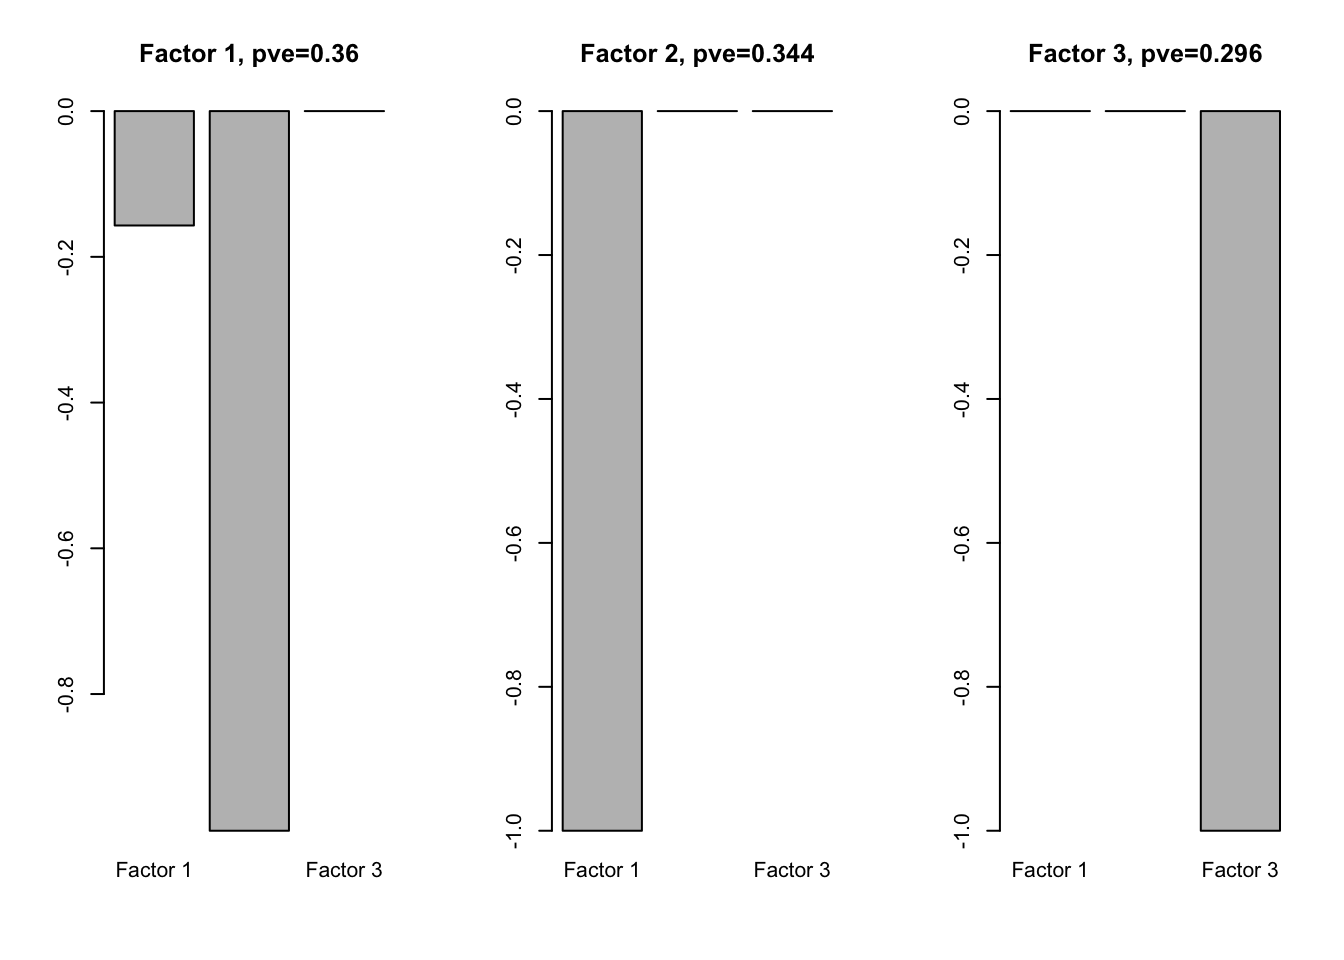
We perform flash analysis on L:
f1.l = flash(Loadings1, greedy = TRUE, backfit = TRUE)fitting factor/loading 1fitting factor/loading 2fitting factor/loading 3fitting factor/loading 4f1l.f = flash_get_ldf(f1.l)$f
row.names(f1l.f) = paste0('Factor ', 1:3)
par(mfrow=c(1,3))
for(i in 1:ncol(f1l.f)){
barplot(f1l.f[,i], main = paste0('Factor ', i, ', pve=', round(flash_get_pve(f1.l)[i],3)))
}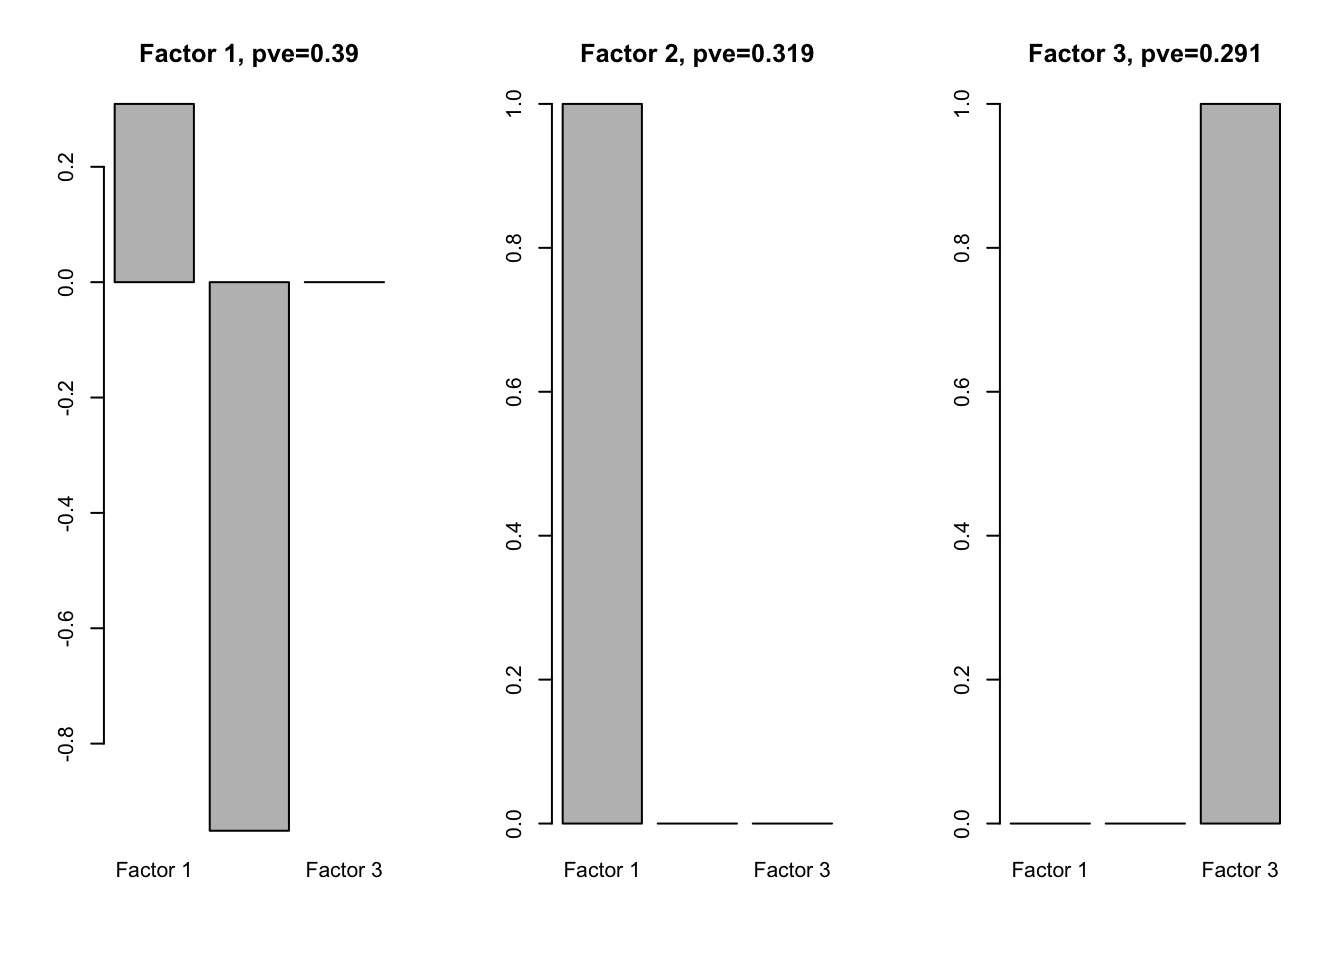
We see that one loading is positive and the other is negative.
Check loadings (O) of Loadings:
melted_LLoading = melt(flash_get_ldf(f1.l)$l * flash_get_ldf(f1.l)$d)
p3 = plot_HP('Loadings of Loadings', melted_LLoading)
p3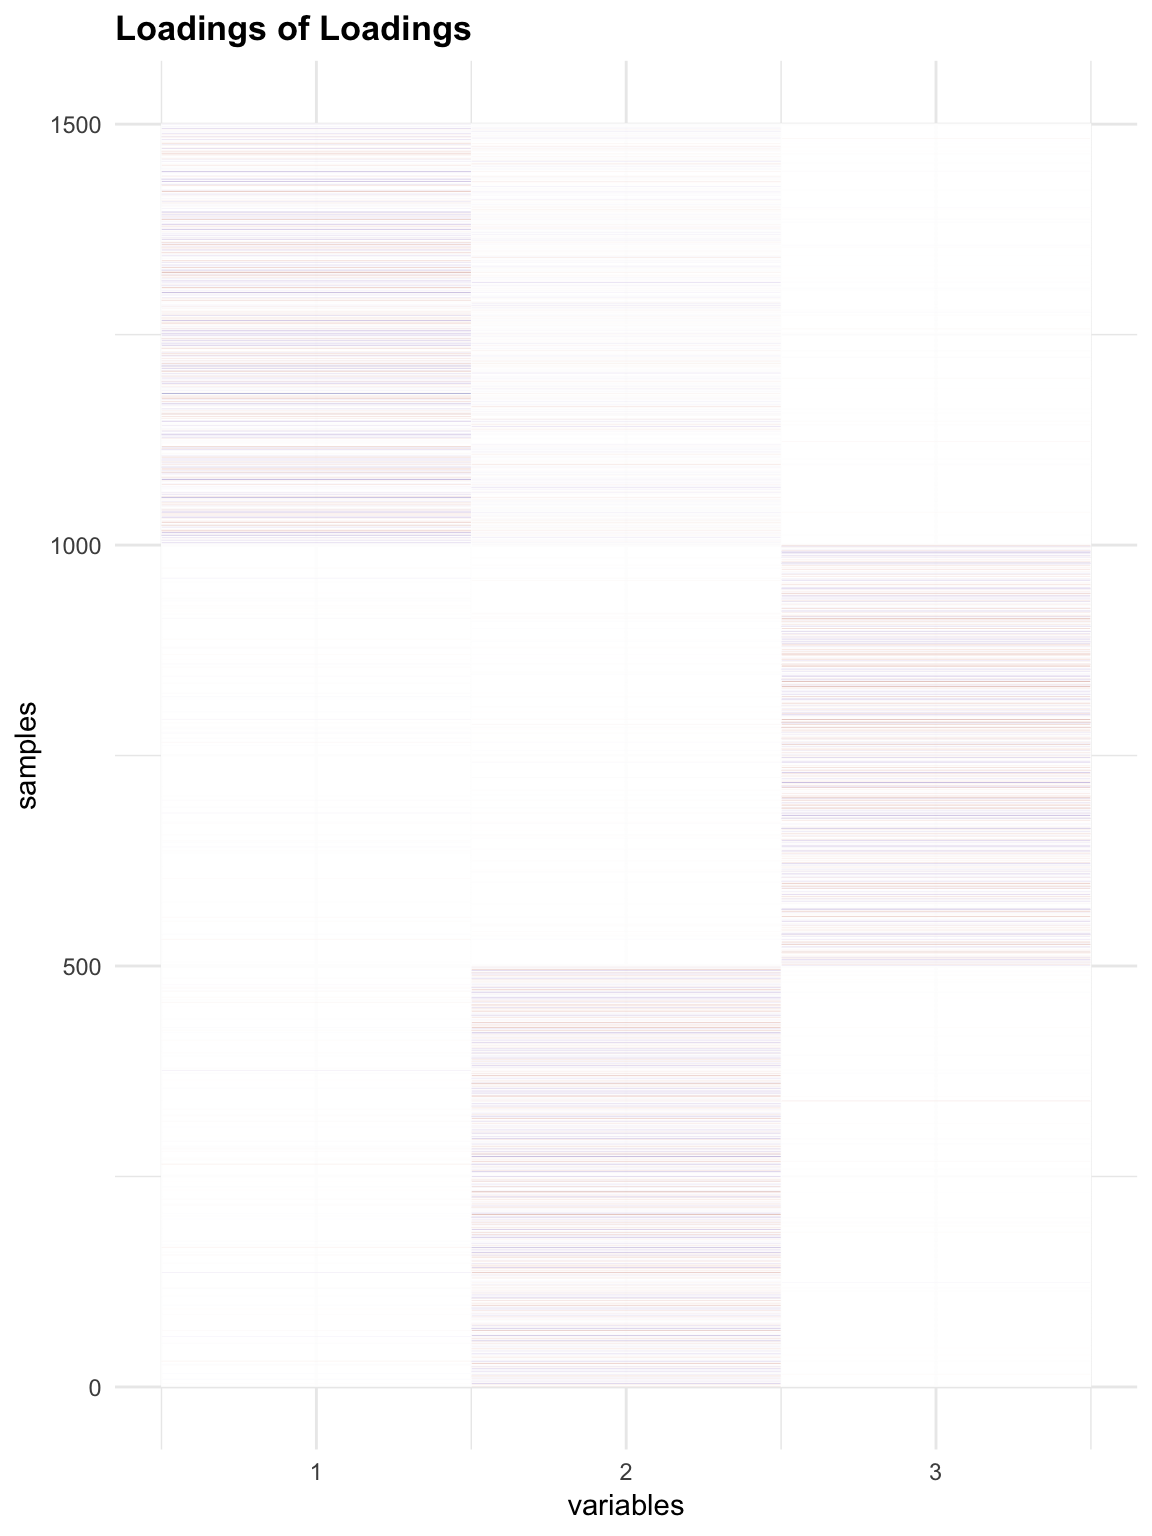
Flash with fixed factors (loading same sign)
f2 = flash_add_fixed_f(data$Y, FF=cbind(c(1,1,1,1,1), c(1,1,0,0,0), c(0,0,0,0,1)))
f2 = flash_backfit(data$Y, f2)
Loading.fix = flash_get_ldf(f2)$l * flash_get_ldf(f2)$d
# Check loadings
melted_LoadingFix = melt(Loading.fix)
melted_LoadingFix_zoom = melt(Loading.fix[1001:1500,])
p4 = plot_HP('Loading', melted_LoadingFix)
p5 = plot_HP('Loading_zoom', melted_LoadingFix_zoom)
gridExtra::grid.arrange(p4,p5, ncol = 2)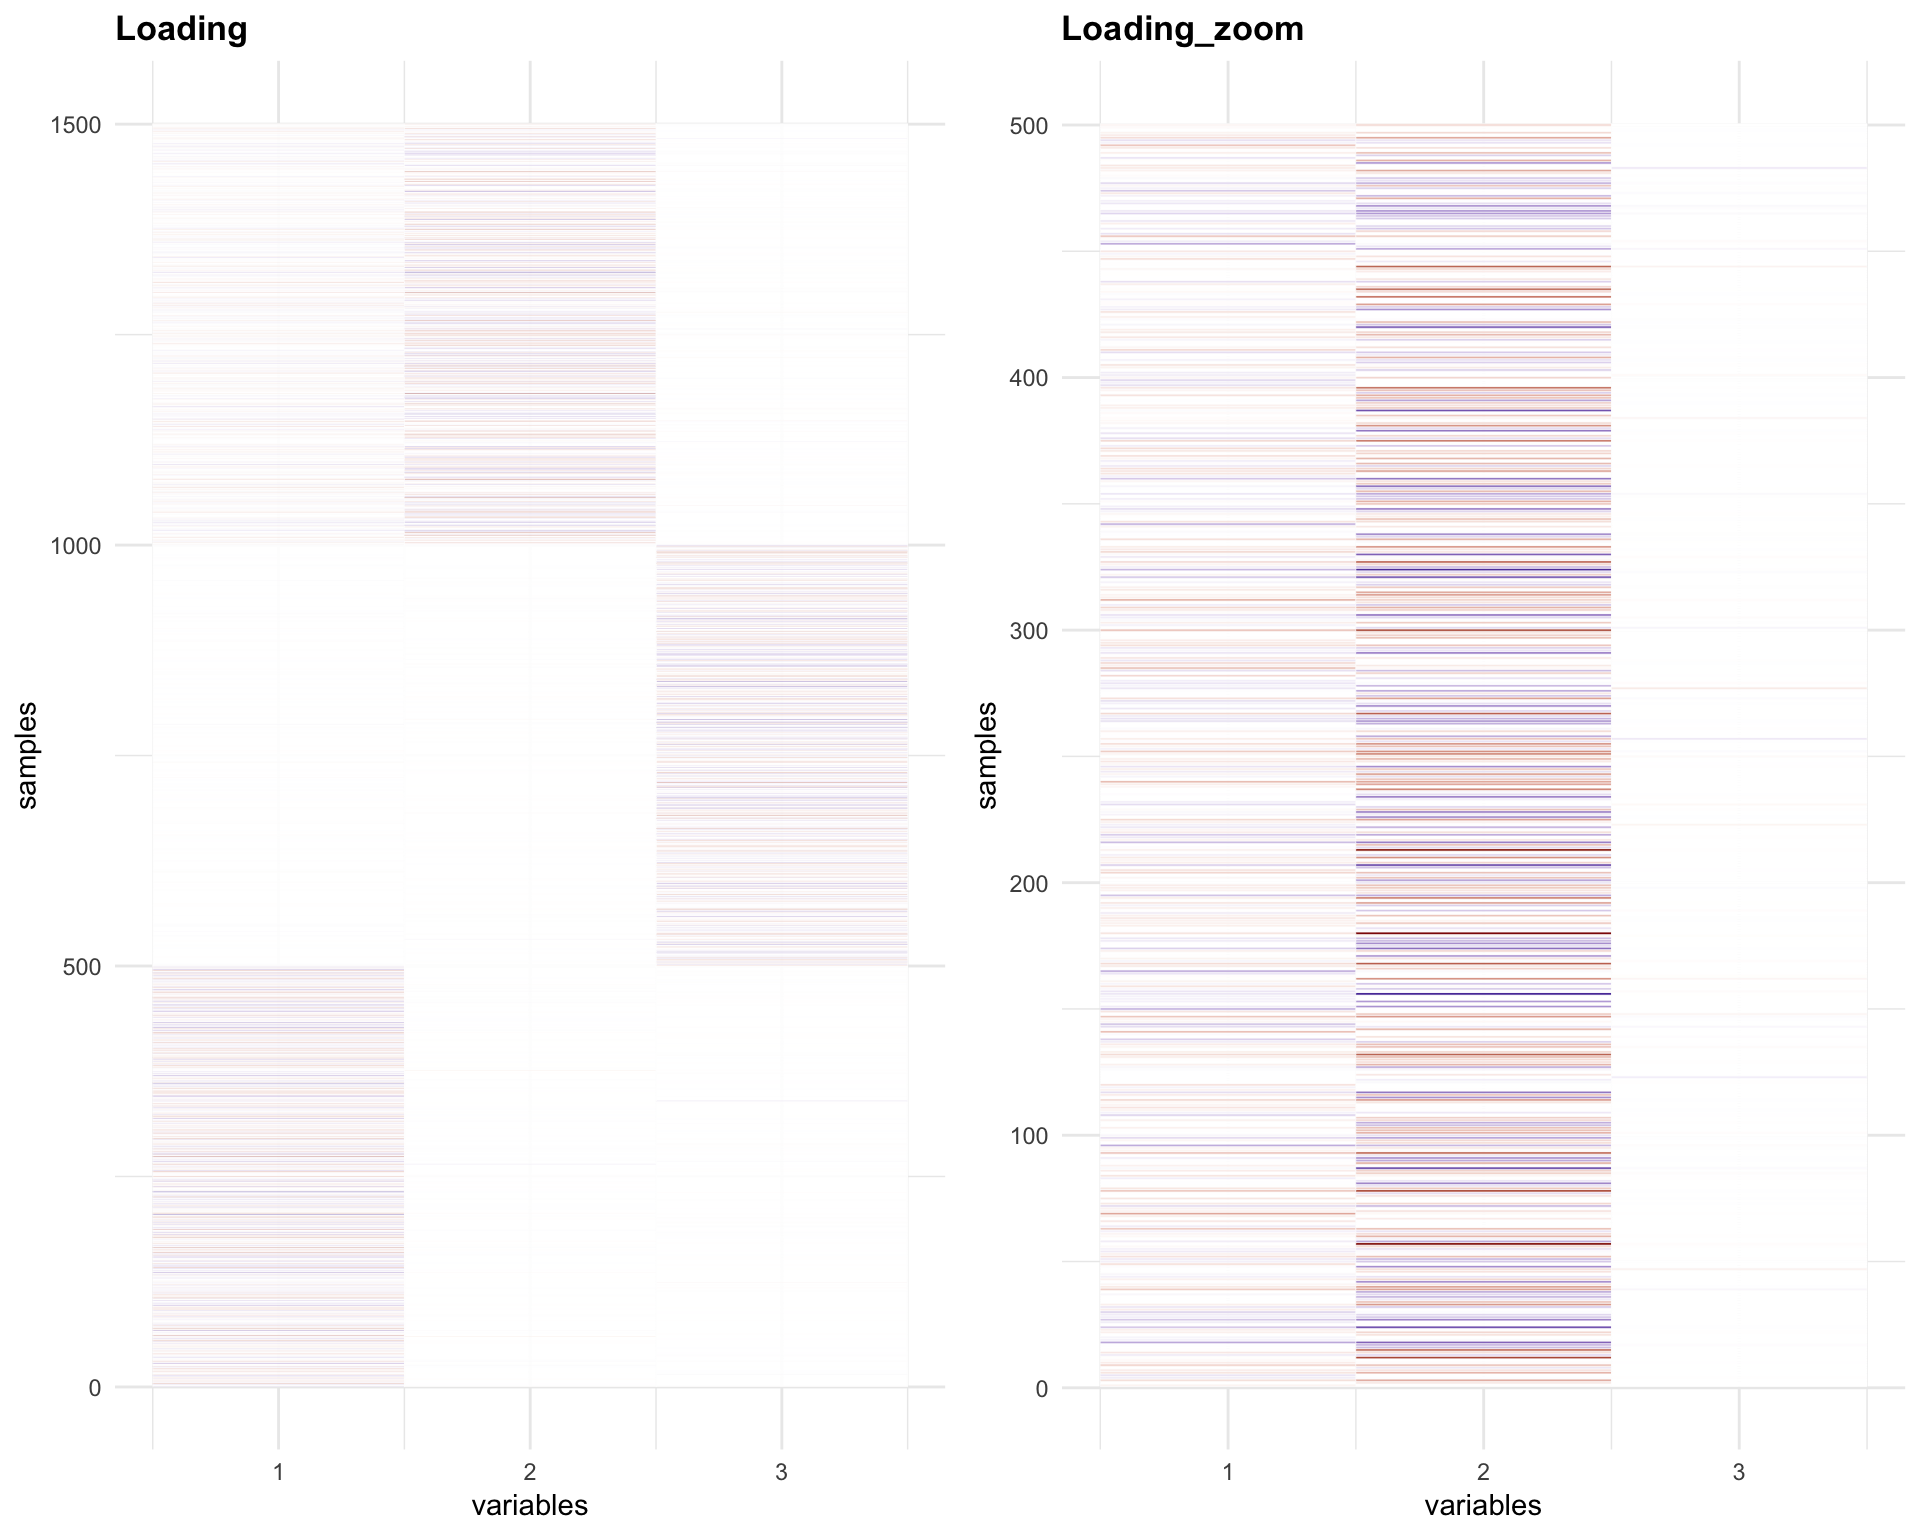
The Loadings for the last 500 samples (1001-1500) have same sign for factor 1 and 2.
Flash on loadings
f2.l = flash(Loading.fix, greedy = TRUE, backfit = TRUE)fitting factor/loading 1fitting factor/loading 2fitting factor/loading 3fitting factor/loading 4f2l.f = flash_get_ldf(f2.l)$f
row.names(f2l.f) = paste0('Factor ', 1:3)
par(mfrow=c(1,3))
for(i in 1:ncol(f2l.f)){
barplot(f2l.f[,i], main = paste0('Factor ', i, ', pve=', round(flash_get_pve(f2.l)[i],3)))
}
Check Loading of Loaing
melted_LLoading.fix = melt(flash_get_ldf(f2.l)$l * flash_get_ldf(f2.l)$d)
p6 = plot_HP('Loadings of Loadings', melted_LLoading.fix)
p6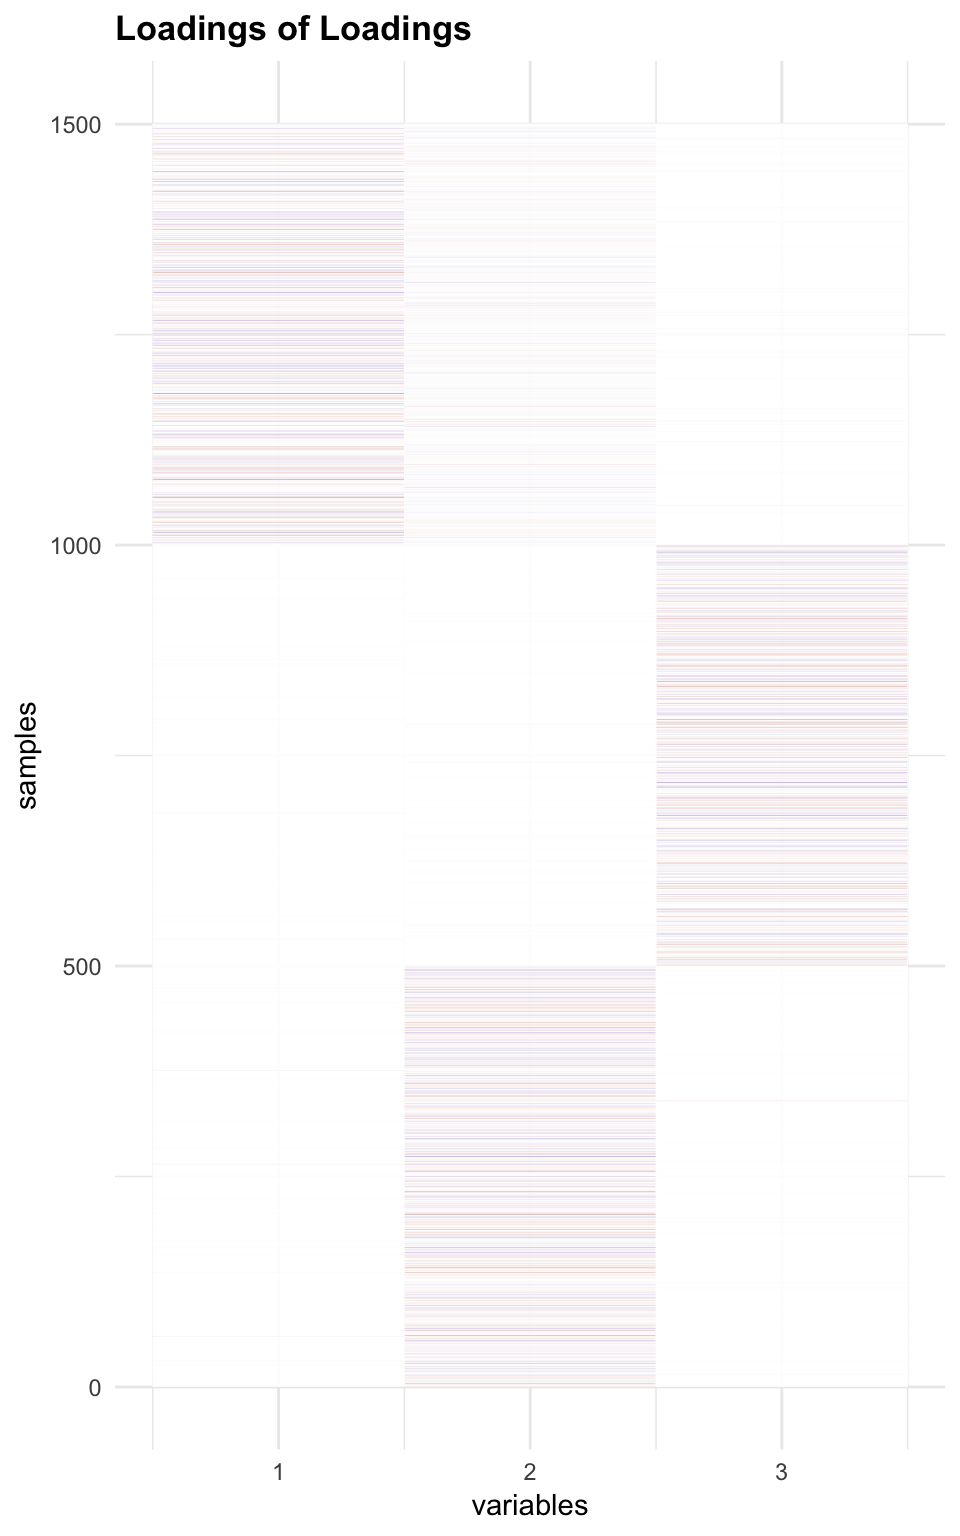
Session information
sessionInfo()R version 3.4.4 (2018-03-15)
Platform: x86_64-apple-darwin15.6.0 (64-bit)
Running under: macOS High Sierra 10.13.5
Matrix products: default
BLAS: /Library/Frameworks/R.framework/Versions/3.4/Resources/lib/libRblas.0.dylib
LAPACK: /Library/Frameworks/R.framework/Versions/3.4/Resources/lib/libRlapack.dylib
locale:
[1] en_US.UTF-8/en_US.UTF-8/en_US.UTF-8/C/en_US.UTF-8/en_US.UTF-8
attached base packages:
[1] stats graphics grDevices utils datasets methods base
other attached packages:
[1] reshape2_1.4.3 ggplot2_3.0.0 flashr_0.5-12
loaded via a namespace (and not attached):
[1] Rcpp_0.12.17 bindr_0.1.1 compiler_3.4.4
[4] pillar_1.2.2 git2r_0.21.0 plyr_1.8.4
[7] iterators_1.0.9 tools_3.4.4 digest_0.6.15
[10] evaluate_0.10.1 tibble_1.4.2 gtable_0.2.0
[13] lattice_0.20-35 pkgconfig_2.0.1 rlang_0.2.1
[16] Matrix_1.2-14 foreach_1.4.4 yaml_2.1.19
[19] parallel_3.4.4 ebnm_0.1-12 bindrcpp_0.2.2
[22] gridExtra_2.3 withr_2.1.2 stringr_1.3.0
[25] dplyr_0.7.4 knitr_1.20 rprojroot_1.3-2
[28] grid_3.4.4 glue_1.2.0 R6_2.2.2
[31] rmarkdown_1.9 ashr_2.2-7 magrittr_1.5
[34] backports_1.1.2 scales_0.5.0 codetools_0.2-15
[37] htmltools_0.3.6 MASS_7.3-50 assertthat_0.2.0
[40] softImpute_1.4 colorspace_1.3-2 labeling_0.3
[43] stringi_1.2.2 lazyeval_0.2.1 pscl_1.5.2
[46] doParallel_1.0.11 munsell_0.4.3 truncnorm_1.0-8
[49] SQUAREM_2017.10-1This R Markdown site was created with workflowr