Mash_missing
Yuxin Zou
2/14/2018
Last updated: 2018-02-27
Code version: be7f846
Generate data with missing value:
Some rows have very sparse observations.
library(mashr)Loading required package: ashrset.seed(2018)
data = simple_sims(500, ncond = 60, err_sd = 0.5)
data.miss = data
missing.row = sample(1:nrow(data$Bhat), nrow(data$Bhat)/4)
# choose number of missing for each row
missing.num = sample(50:59, length(missing.row), replace = TRUE)
missing.ind = matrix(0, nrow = nrow(data$B), ncol=ncol(data$B))
for(i in 1: length(missing.row)){
col = sample(1:60, missing.num[i])
missing.ind[missing.row[i], col] = 1
}
missing = which(missing.ind == 1)
data.miss$Bhat[missing] = NA
data.miss$Shat[missing] = NA
missing1 = is.na(data.miss$Bhat[,1])Set the missing value with large standard deviation
data.large.dev = data.miss
data.large.dev$Bhat[is.na(data.miss$Bhat)] = 0
data.large.dev$Shat[is.na(data.miss$Shat)] = 1000
ash
ash_res = ash(data.large.dev$Bhat[,1], data.large.dev$Shat[,1], mixcompdist = "normal", alpha = 0)

which(ash_res$result$lfsr[missing1] < 0.05)integer(0)ash_res_orig = ash(data.large.dev$Bhat[!missing1,1], data.large.dev$Shat[!missing1,1], mixcompdist = "normal", alpha = 0)
sum((ash_res$result$PosteriorMean[!missing1] - ash_res_orig$result$PosteriorMean)^2)[1] 1.09632e-11The missing data are estimated as 0 and non-significant using ash. Since the missing data was assigned with large error, the analysis ignore those missing values. The estimates for the non-missing ones are similar.
mash
- EE model
mash.data.missing = mash_set_data(Bhat=data.large.dev$Bhat, Shat=data.large.dev$Shat)
U.c = cov_canonical(mash.data.missing)

mash.model.missing = mash(mash.data.missing, U.c)
- Computing 2000 x 1106 likelihood matrix.
- Likelihood calculations took 41.36 seconds.
- Fitting model with 1106 mixture components.
- Model fitting took 19.91 seconds.
- Computing posterior matrices.
- Computation allocated took 21.42 seconds.barplot(get_estimated_pi(mash.model.missing), las=2, cex.names = 0.7)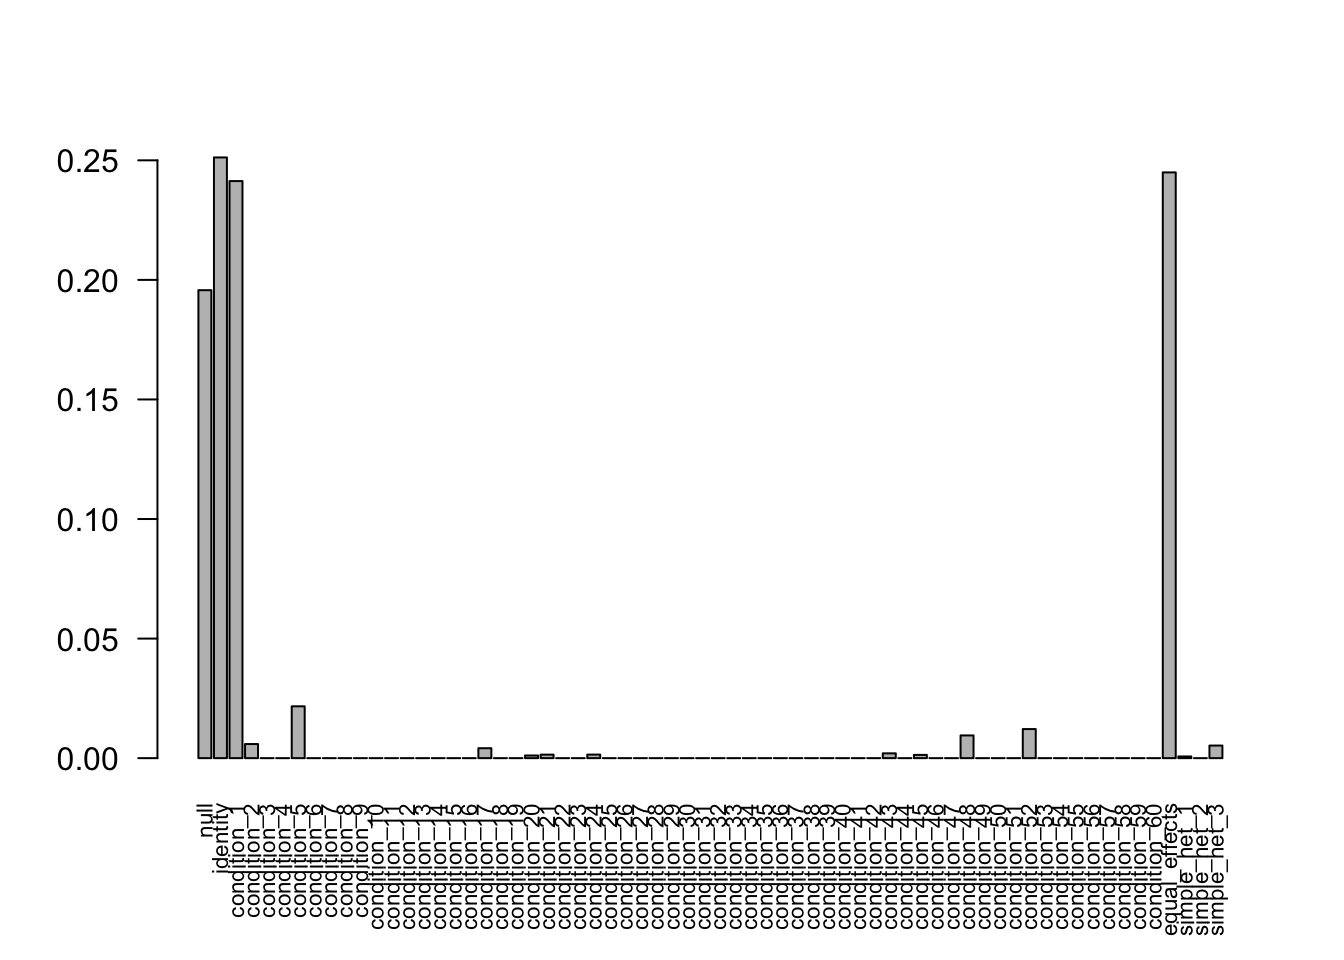
The weights learned from the data is correct, even there are many missing values. There are 888 significant samples, 2071 significent effects in missing data.
Some of the missing value is estimated with significant posterior mean. This is caused by the information borrowing from other observations. Based on the covariance structure learned from the whole dataset, the missing value are imputed.
We can check the RMSE, comparing the posterior mean for the missing data with the true value.
# RMSE
sqrt(sum(((mash.model.missing$result$PosteriorMean[missing] - data$B[missing])^2))/length(missing))
[1] 0.5383296- EZ model
mash.data.missing.1 = mash_set_data(Bhat=data.large.dev$Bhat, Shat=data.large.dev$Shat, alpha = 1)
U.c = cov_canonical(mash.data.missing)

mash.model.missing.1 = mash(mash.data.missing.1, U.c)
- Computing 2000 x 1106 likelihood matrix.
- Likelihood calculations took 6.58 seconds.
- Fitting model with 1106 mixture components.Warning in REBayes::KWDual(A, rep(1, k), normalize(w), control = control): estimated mixing distribution has some negative values:
consider reducing rtolWarning in mixIP(matrix_lik = structure(c(0.239881584685685,
0.339137348690074, : Optimization step yields mixture weights that are
either too small, or negative; weights have been corrected and renormalized
after the optimization. - Model fitting took 24.21 seconds.
- Computing posterior matrices.
- Computation allocated took 9.73 seconds.FIXME: 'compute_posterior_matrices' in Rcpp does not transfer EZ to EEbarplot(get_estimated_pi(mash.model.missing.1), las=2, cex.names = 0.7)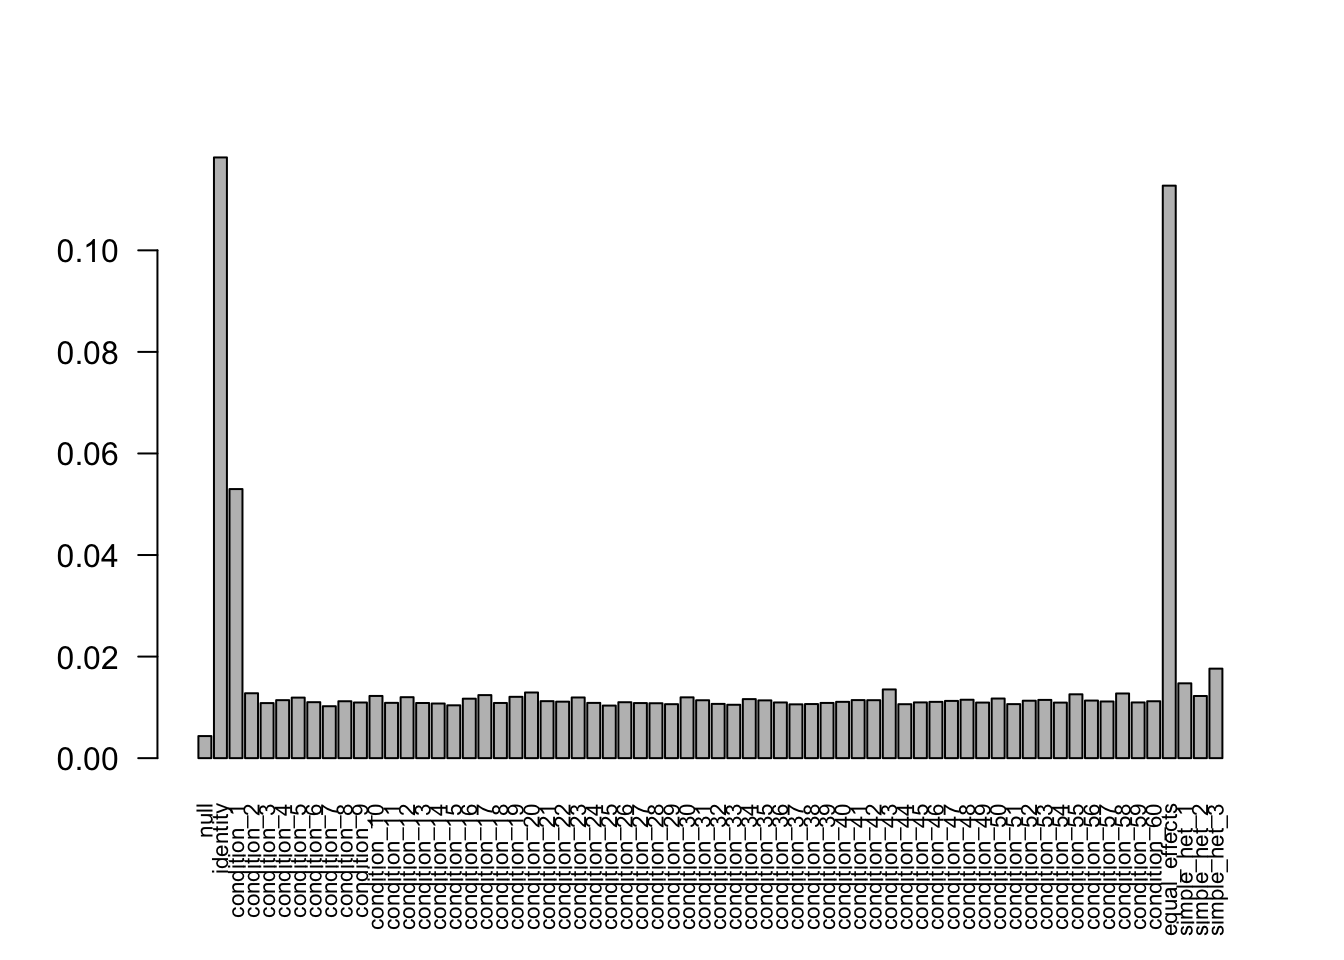 The weights learned from the data are very weird and incorrect. There are 763 significant samples, 0 significent effects in missing data. The maximum of the estimated posterior mean is 240.0490705 with estimated sd 737.2168498. This result is not what we expected. In the EZ model, multiplying back the standard errors causes the problem, since the missing data are set with large standard error.
So, one lesson is that we should use EE model when there are missing values in the data.
Session information
sessionInfo()R version 3.4.3 (2017-11-30)
Platform: x86_64-apple-darwin15.6.0 (64-bit)
Running under: macOS High Sierra 10.13.3
Matrix products: default
BLAS: /Library/Frameworks/R.framework/Versions/3.4/Resources/lib/libRblas.0.dylib
LAPACK: /Library/Frameworks/R.framework/Versions/3.4/Resources/lib/libRlapack.dylib
locale:
[1] en_US.UTF-8/en_US.UTF-8/en_US.UTF-8/C/en_US.UTF-8/en_US.UTF-8
attached base packages:
[1] stats graphics grDevices utils datasets methods base
other attached packages:
[1] mashr_0.2-4 ashr_2.2-4
loaded via a namespace (and not attached):
[1] Rcpp_0.12.15 knitr_1.17 magrittr_1.5
[4] REBayes_1.2 MASS_7.3-47 doParallel_1.0.11
[7] pscl_1.5.2 SQUAREM_2017.10-1 lattice_0.20-35
[10] foreach_1.4.4 plyr_1.8.4 stringr_1.2.0
[13] tools_3.4.3 parallel_3.4.3 grid_3.4.3
[16] rmeta_2.16 git2r_0.20.0 htmltools_0.3.6
[19] iterators_1.0.9 assertthat_0.2.0 yaml_2.1.16
[22] rprojroot_1.2 digest_0.6.13 Matrix_1.2-12
[25] codetools_0.2-15 evaluate_0.10.1 rmarkdown_1.8
[28] stringi_1.1.6 compiler_3.4.3 Rmosek_8.0.69
[31] backports_1.1.2 mvtnorm_1.0-7 truncnorm_1.0-7 This R Markdown site was created with workflowr