<!DOCTYPE html> <html xmlns="http://www.w3.org/1999/xhtml"> <head> <meta charset="utf-8" /> <meta http-equiv="Content-Type" content="text/html; charset=utf-8" /> <meta name="generator" content="pandoc" /> <meta name="author" content="Yuxin Zou" /> <title>Table 2</title> <script src="site_libs/jquery-1.11.3/jquery.min.js"></script> <meta name="viewport" content="width=device-width, initial-scale=1" /> <link href="site_libs/bootstrap-3.3.5/css/cosmo.min.css" rel="stylesheet" /> <script src="site_libs/bootstrap-3.3.5/js/bootstrap.min.js"></script> <script src="site_libs/bootstrap-3.3.5/shim/html5shiv.min.js"></script> <script src="site_libs/bootstrap-3.3.5/shim/respond.min.js"></script> <script src="site_libs/jqueryui-1.11.4/jquery-ui.min.js"></script> <link href="site_libs/tocify-1.9.1/jquery.tocify.css" rel="stylesheet" /> <script src="site_libs/tocify-1.9.1/jquery.tocify.js"></script> <script src="site_libs/navigation-1.1/tabsets.js"></script> <script src="site_libs/navigation-1.1/codefolding.js"></script> <link href="site_libs/highlightjs-9.12.0/textmate.css" rel="stylesheet" /> <script src="site_libs/highlightjs-9.12.0/highlight.js"></script> <link href="site_libs/font-awesome-4.5.0/css/font-awesome.min.css" rel="stylesheet" /> <style type="text/css">code{white-space: pre;}</style> <style type="text/css"> pre:not([class]) { background-color: white; } </style> <script type="text/javascript"> if (window.hljs) { hljs.configure({languages: []}); hljs.initHighlightingOnLoad(); if (document.readyState && document.readyState === "complete") { window.setTimeout(function() { hljs.initHighlighting(); }, 0); } } </script> <style type="text/css"> h1 { font-size: 34px; } h1.title { font-size: 38px; } h2 { font-size: 30px; } h3 { font-size: 24px; } h4 { font-size: 18px; } h5 { font-size: 16px; } h6 { font-size: 12px; } .table th:not([align]) { text-align: left; } </style> </head> <body> <style type = "text/css"> .main-container { max-width: 940px; margin-left: auto; margin-right: auto; } code { color: inherit; background-color: rgba(0, 0, 0, 0.04); } img { max-width:100%; height: auto; } .tabbed-pane { padding-top: 12px; } button.code-folding-btn:focus { outline: none; } </style> <style type="text/css"> /* padding for bootstrap navbar */ body { padding-top: 51px; padding-bottom: 40px; } /* offset scroll position for anchor links (for fixed navbar) */ .section h1 { padding-top: 56px; margin-top: -56px; } .section h2 { padding-top: 56px; margin-top: -56px; } .section h3 { padding-top: 56px; margin-top: -56px; } .section h4 { padding-top: 56px; margin-top: -56px; } .section h5 { padding-top: 56px; margin-top: -56px; } .section h6 { padding-top: 56px; margin-top: -56px; } </style> <script> // manage active state of menu based on current page $(document).ready(function () { // active menu anchor href = window.location.pathname href = href.substr(href.lastIndexOf('/') + 1) if (href === "") href = "index.html"; var menuAnchor = $('a[href="' + href + '"]'); // mark it active menuAnchor.parent().addClass('active'); // if it's got a parent navbar menu mark it active as well menuAnchor.closest('li.dropdown').addClass('active'); }); </script> <div class="container-fluid main-container"> <!-- tabsets --> <script> $(document).ready(function () { window.buildTabsets("TOC"); }); </script> <!-- code folding --> <style type="text/css"> .code-folding-btn { margin-bottom: 4px; } </style> <script> $(document).ready(function () { window.initializeCodeFolding("hide" === "show"); }); </script> <script> $(document).ready(function () { // move toc-ignore selectors from section div to header $('div.section.toc-ignore') .removeClass('toc-ignore') .children('h1,h2,h3,h4,h5').addClass('toc-ignore'); // establish options var options = { selectors: "h1,h2,h3", theme: "bootstrap3", context: '.toc-content', hashGenerator: function (text) { return text.replace(/[.\\/?&!#<>]/g, '').replace(/\s/g, '_').toLowerCase(); }, ignoreSelector: ".toc-ignore", scrollTo: 0 }; options.showAndHide = true; options.smoothScroll = true; // tocify var toc = $("#TOC").tocify(options).data("toc-tocify"); }); </script> <style type="text/css"> #TOC { margin: 25px 0px 20px 0px; } @media (max-width: 768px) { #TOC { position: relative; width: 100%; } } .toc-content { padding-left: 30px; padding-right: 40px; } div.main-container { max-width: 1200px; } div.tocify { width: 20%; max-width: 260px; max-height: 85%; } @media (min-width: 768px) and (max-width: 991px) { div.tocify { width: 25%; } } @media (max-width: 767px) { div.tocify { width: 100%; max-width: none; } } .tocify ul, .tocify li { line-height: 20px; } .tocify-subheader .tocify-item { font-size: 0.90em; padding-left: 25px; text-indent: 0; } .tocify .list-group-item { border-radius: 0px; } </style> <!-- setup 3col/9col grid for toc_float and main content --> <div class="row-fluid"> <div class="col-xs-12 col-sm-4 col-md-3"> <div id="TOC" class="tocify"> </div> </div> <div class="toc-content col-xs-12 col-sm-8 col-md-9"> <div class="navbar navbar-default navbar-fixed-top" role="navigation"> <div class="container"> <div class="navbar-header"> <button type="button" class="navbar-toggle collapsed" data-toggle="collapse" data-target="#navbar"> <span class="icon-bar"></span> <span class="icon-bar"></span> <span class="icon-bar"></span> </button> <a class="navbar-brand" href="index.html">mash_application</a> </div> <div id="navbar" class="navbar-collapse collapse"> <ul class="nav navbar-nav"> <li> <a href="index.html">Home</a> </li> <li> <a href="about.html">About</a> </li> <li> <a href="license.html">License</a> </li> </ul> <ul class="nav navbar-nav navbar-right"> <li> <a href="https://github.com/jdblischak/workflowr"> <span class="fa fa-github"></span> </a> </li> </ul> </div><!--/.nav-collapse --> </div><!--/.container --> </div><!--/.navbar --> <!-- Add a small amount of space between sections. --> <style type="text/css"> div.section { padding-top: 12px; } </style> <div class="fluid-row" id="header"> <div class="btn-group pull-right"> <button type="button" class="btn btn-default btn-xs dropdown-toggle" data-toggle="dropdown" aria-haspopup="true" aria-expanded="false"><span>Code</span> <span class="caret"></span></button> <ul class="dropdown-menu" style="min-width: 50px;"> <li><a id="rmd-show-all-code" href="#">Show All Code</a></li> <li><a id="rmd-hide-all-code" href="#">Hide All Code</a></li> </ul> </div> <h1 class="title toc-ignore">Table 2</h1> <h4 class="author"><em>Yuxin Zou</em></h4> <h4 class="date"><em>2018-2-1</em></h4> </div> <!-- Update knitr chunk options --> <!-- Insert the date the file was last updated --> <p><strong>Last updated:</strong> 2018-03-06</p> <!-- Insert the code version (Git commit SHA1) if Git repository exists and R package git2r is installed --> <p><strong>Code version:</strong> 866f1eb</p> <pre class="r"><code>library(gdata); library(mashr);library(flashr)</code></pre> <pre><code>gdata: read.xls support for 'XLS' (Excel 97-2004) files ENABLED.</code></pre> <pre><code></code></pre> <pre><code>gdata: read.xls support for 'XLSX' (Excel 2007+) files ENABLED.</code></pre> <pre><code> Attaching package: 'gdata'</code></pre> <pre><code>The following object is masked from 'package:stats': nobs</code></pre> <pre><code>The following object is masked from 'package:utils': object.size</code></pre> <pre><code>The following object is masked from 'package:base': startsWith</code></pre> <pre><code>Loading required package: ashr</code></pre> <pre class="r"><code>library(mclust); library(plyr); library(corrplot)</code></pre> <pre><code>Package 'mclust' version 5.4 Type 'citation("mclust")' for citing this R package in publications.</code></pre> <pre><code> Attaching package: 'mclust'</code></pre> <pre><code>The following object is masked from 'package:ashr': dens</code></pre> <pre><code>corrplot 0.84 loaded</code></pre> <pre class="r"><code>library(ggplot2); library(ggpubr)</code></pre> <pre><code>Loading required package: magrittr</code></pre> <div id="read-table-2" class="section level1"> <h1>Read Table 2</h1> <pre class="r"><code>SupplTable2 = read.xls('../data/Suppl.Table.2.xlsx') saveRDS(SupplTable2, '../data/SupplTable2.rds')</code></pre> <p>There are missing value in the data. I guess this is caused by the 0 count, since the effect is <span class="math inline">\(\log_{2} (X_{1}/X_{2})\)</span>. We set these NAs to 0 with huge variance.</p> <pre class="r"><code>Genename = as.character(SupplTable2$Gene.ID) colname = colnames(SupplTable2)[seq(3,89,by=3)] Tissue = gsub( "_.*$", "", colname) p.value = SupplTable2[,seq(3,89,by=3)] logFC = SupplTable2[,seq(4,89,by=3)] missing = is.na(as.matrix(logFC)) p.value[is.na(as.matrix(p.value))] = 1 logFC[is.na(as.matrix(logFC))] = 0 row.names(p.value) = Genename row.names(logFC) = Genename colnames(p.value) = Tissue colnames(logFC) = Tissue saveRDS(list(logFC = as.matrix(logFC), pval = as.matrix(p.value), category = SupplTable2$category, region = SupplTable2$region, missing = missing), '../data/SupplTable2_0.rds')</code></pre> <p>Since the sample size is large, we assume the p value is from normal distribution.</p> <pre class="r"><code>mash.data = mash_set_data(Bhat = data$logFC, pval = data$pval) # set large variance to missing data mash.data$Shat[is.na(mash.data$Shat)] = 1000 mash.data$Shat[is.infinite(mash.data$Shat)] = 1000 # find strong genes m.1by1 = mash_1by1(mash.data, alpha=0) strong = get_significant_results(m.1by1, 0.01) # estimate cor V on non strong genes Z = mash.data$Bhat/mash.data$Shat Z.null = Z[setdiff(1:349,strong),]</code></pre> </div> <div id="estimate-covariance-structure-using-strong-genes" class="section level1"> <h1>Estimate covariance structure using strong genes</h1> <pre class="r"><code>Z.strong = Z[strong,] # center Z.center = apply(Z.strong, 2, function(x) x - mean(x))</code></pre> <div id="flash" class="section level2"> <h2>Flash</h2> <p><span class="math display">\[ \tilde{Z} = LF' + E \]</span> where F is <span class="math inline">\(29 \times K\)</span>, L is <span class="math inline">\(n \times K\)</span>, E is <span class="math inline">\(n\times 29\)</span>.</p> <pre class="r"><code>mash_data_flash = flash_set_data(as.matrix(Z.center)) fmodel = flash(mash_data_flash, greedy = TRUE, backfit = TRUE) saveRDS(fmodel, '../output/Flash_T2_0.rds')</code></pre> <div id="flash-result" class="section level3"> <h3>Flash result</h3> <p>
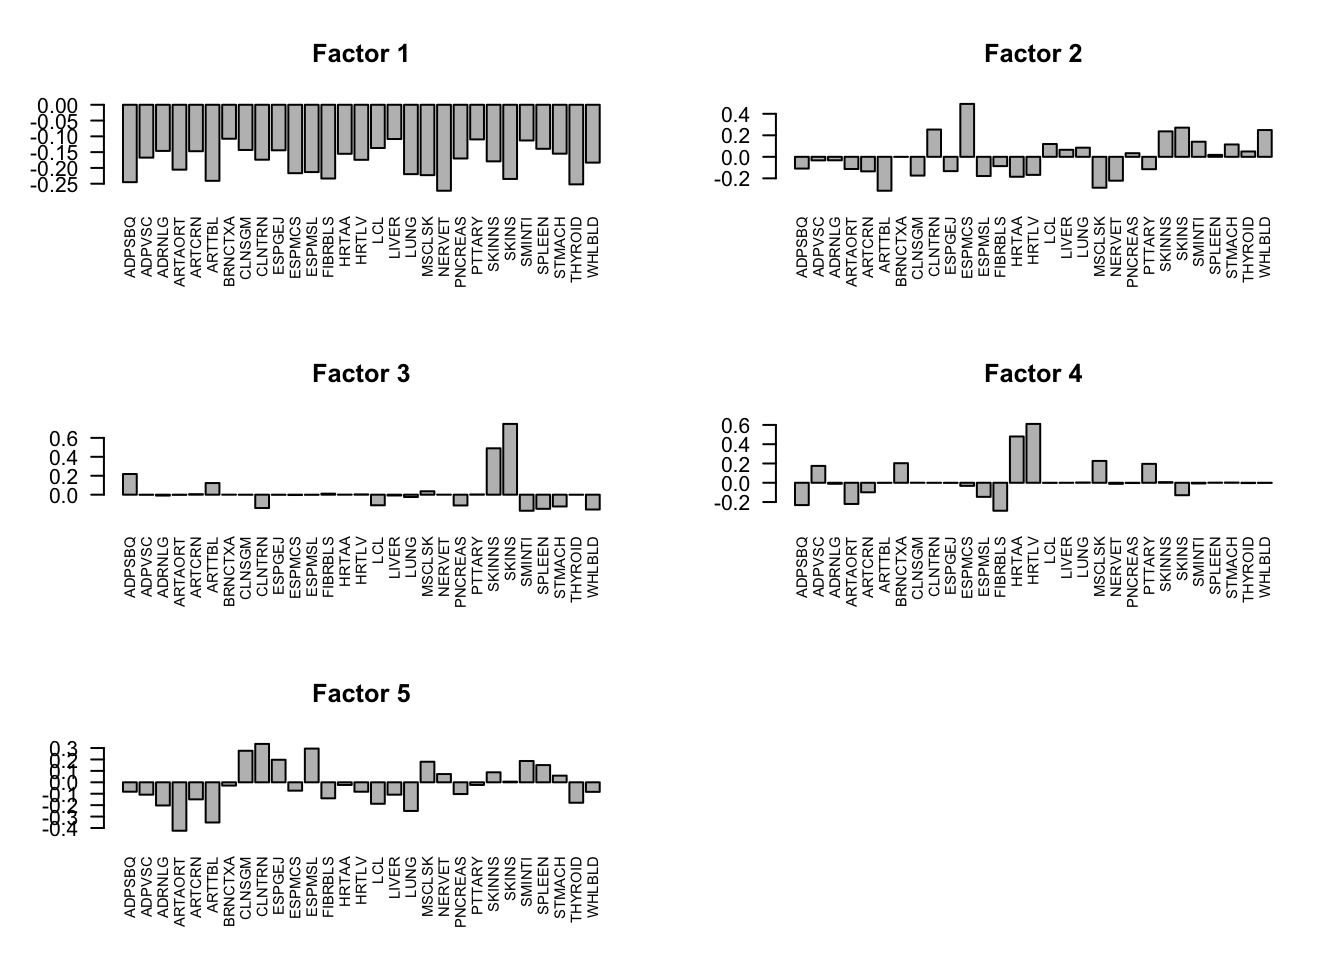
The first factor explains the main proportion of variance in effects.</p> <pre class="r"><code>flash_get_pve(fmodel)</code></pre> <pre><code>[1] 0.786204732 0.009596396 0.011735441 0.008650019 0.003879352</code></pre> <p>The first factor is the overall summary of treatment effects.</p> <pre class="r"><code>factors = flash_get_ldf(fmodel)$f row.names(factors) = colnames(data$logFC) layout(matrix(c(1,2,3,4,5,6), 3, 2, byrow = TRUE)) for(i in 1:5){ barplot(factors[,i], las=2, main=paste0('Factor ', i), cex.names = 0.7) }</code></pre> <p><img src="figure/sexbias_Table2.Rmd/unnamed-chunk-12-1.png" width="672" style="display: block; margin: auto;" /></p> </div> <div id="clustering-loadings" class="section level3"> <h3>Clustering loadings</h3> <pre class="r"><code>loading = fmodel$EL[,1:5] row.names(loading) = rownames(Z.strong) colnames(loading) = paste0('F',seq(1,5)) mod = Mclust(loading) summary(mod$BIC) saveRDS(mod, '../output/Flash_T2_0_mclust.rds')</code></pre> <p>Using clustering result to fit <code>mash</code>:</p> <p><span class="math display">\[l_{i}\sim \sum_{i=1}^{m}N(\mu_{i}, \Sigma_{i})\]</span> We estimate the covariance as <span class="math inline">\(F(\Sigma_i + \mu_{i}\mu_{i}')F'\)</span>.</p> <pre class="r"><code>U_list = alply(mod$parameters$variance$sigma,3) mu_list = alply(mod$parameters$mean,2) ll = list() for (i in 1:length(U_list)){ ll[[i]] = U_list[[i]] + mu_list[[i]] %*% t(mu_list[[i]]) } U.loading = lapply(ll, function(U){factors %*% (U %*% t(factors))}) names(U.loading) = paste0('Load', "_", (1:length(U.loading))) # rank 1 Flash_res = flash_get_lf(fmodel) U.Flash = c(mashr::cov_from_factors(t(as.matrix(factors)), "Flash"), list("tFlash" = t(Flash_res) %*% Flash_res / nrow(Z.center)))</code></pre> </div> </div> <div id="pca" class="section level2"> <h2>PCA</h2> <pre class="r"><code>U.pca = cov_pca(mash_set_data(Z.center), 7)</code></pre> </div> <div id="canonical" class="section level2"> <h2>Canonical</h2> <pre class="r"><code>U.c = cov_canonical(mash_set_data(Z.center))</code></pre> </div> <div id="extreme-deconvolution" class="section level2"> <h2>Extreme Deconvolution</h2> <pre class="r"><code>U.dd = c(U.pca, U.loading, U.Flash, list('XX' = t(Z.center) %*% Z.center / nrow(Z.center) )) mash.data.ed = mash.data mash.data.ed$Bhat = mash.data$Bhat[strong,] mash.data.ed$Shat = mash.data$Shat[strong,] mash.data.ed$Shat_alpha = mash.data$Shat_alpha[strong,] saveRDS(cov_ed(mash.data.ed, U.dd), '../output/Mash_EE_Cov_0_plusR1.rds')</code></pre> </div> </div> <div id="mash-model" class="section level1"> <h1>mash model</h1> <pre class="r"><code>vhat = 1 if (vhat == 1) { V = cor(Z.null) } else { V = diag(ncol(Z.null)) } mash_data = mash_set_data(Bhat = mash.data$Bhat, Shat = mash.data$Shat, V = V, alpha = 0) saveRDS(mash(mash_data, c(U.c, U.ed)), '../output/Mash_model_0_plusR1.rds') </code></pre> <pre><code> - Computing 959 x 1711 likelihood matrix. - Likelihood calculations took 17.60 seconds. - Fitting model with 1711 mixture components. - Model fitting took 15.55 seconds. - Computing posterior matrices. - Computation allocated took 3.72 seconds.</code></pre> </div> <div id="v1-ee-result" class="section level1"> <h1>V1 EE result</h1> <p>The log-likelihood of fit is</p> <pre class="r"><code>get_loglik(mash.model)</code></pre> <pre><code>[1] -80852.06</code></pre> <p>Here is a plot of weights learned.</p> <pre class="r"><code>options(repr.plot.width=12, repr.plot.height=4) barplot(get_estimated_pi(mash.model), las = 2, cex.names = 0.7)
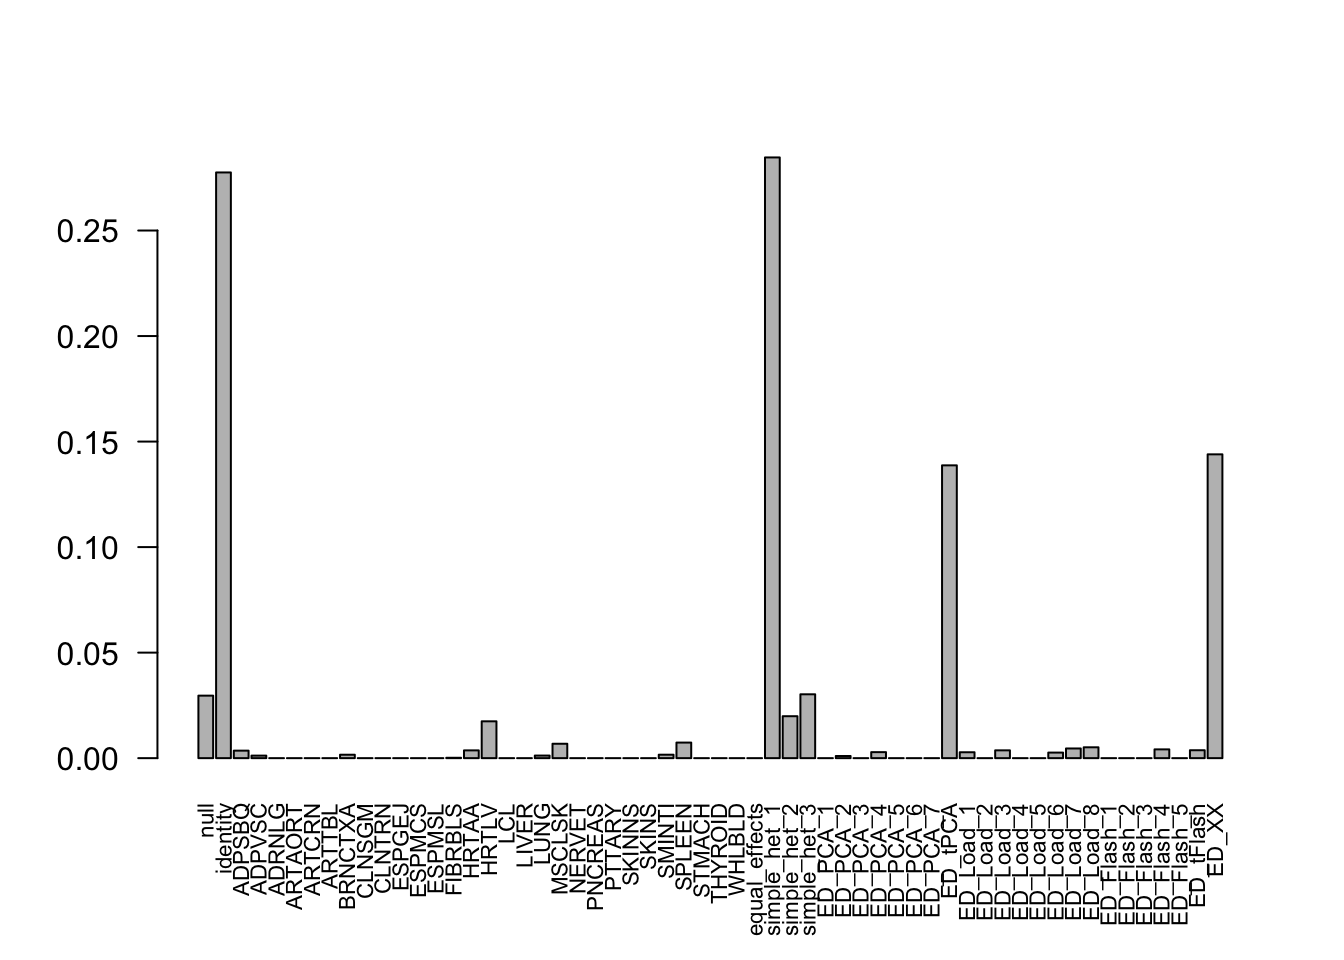
</code></pre> <p><img src="figure/sexbias_Table2.Rmd/unnamed-chunk-23-1.png" width="672" style="display: block; margin: auto;" /></p> <p>Check <code>ED_XX</code> and <code>ED_tPCA</code>:</p> <pre class="r"><code>layout(matrix(c(1,2,3,4), 2, 2, byrow=TRUE)) svd.out = svd(mash.model$fitted_g$Ulist[["ED_XX"]]) v = svd.out$v colnames(v) = colnames(get_lfsr(mash.model)) rownames(v) = colnames(v) options(repr.plot.width=10, repr.plot.height=5) for (j in 1:4) barplot(v[,j]/v[,j][which.max(abs(v[,j]))], cex.names = 0.7, las = 2, main = paste0("EigenVector ", j, " for XX"))</code></pre> <p><img src="figure/sexbias_Table2.Rmd/unnamed-chunk-24-1.png" width="672" style="display: block; margin: auto;" /></p> <pre class="r"><code>
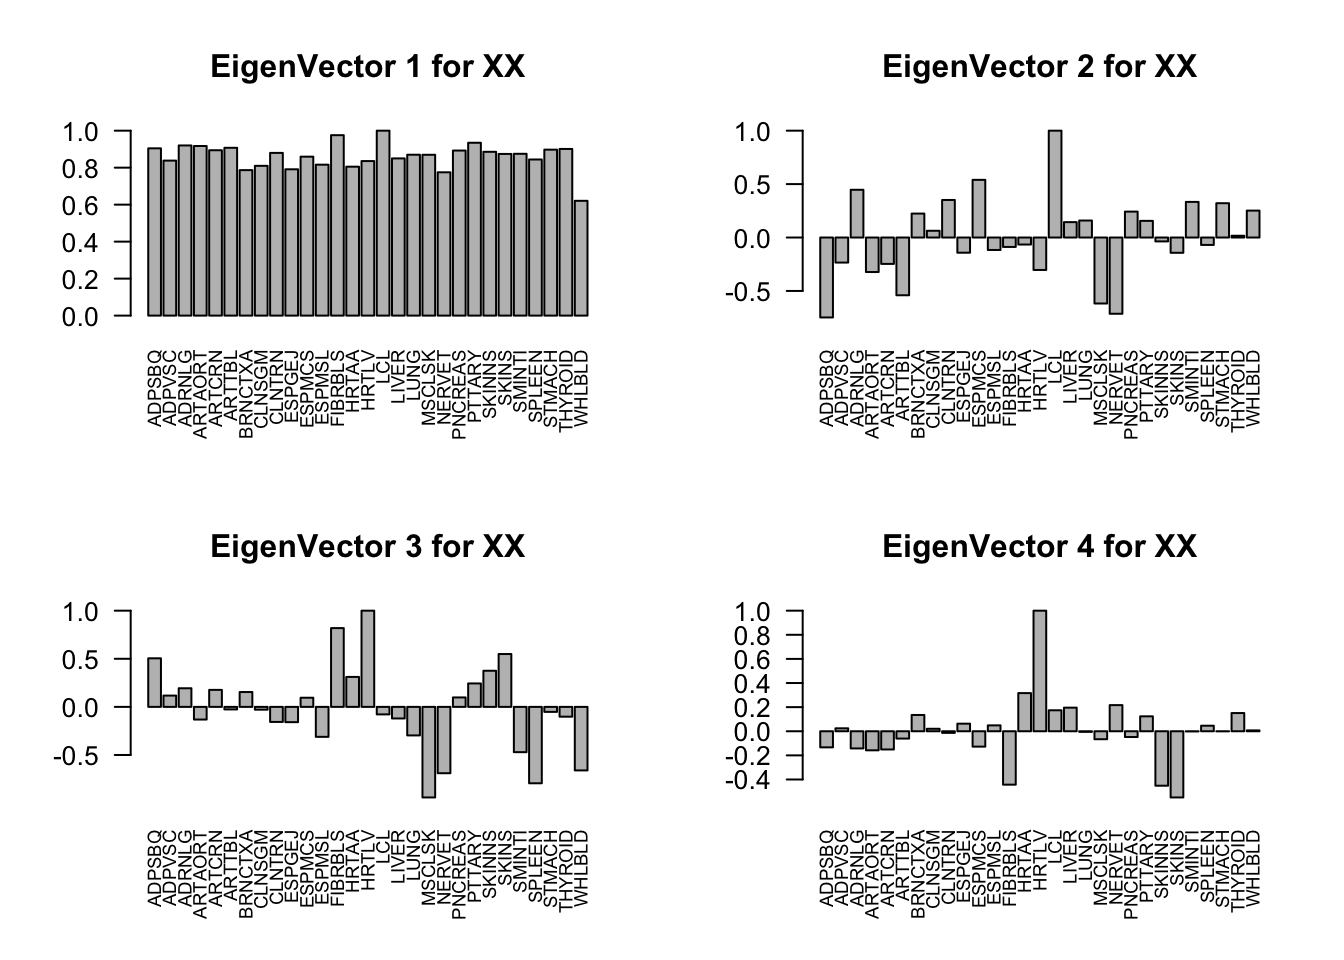
svd.out = svd(mash.model$fitted_g$Ulist[["ED_tPCA"]]) v = svd.out$v colnames(v) = colnames(get_lfsr(mash.model)) rownames(v) = colnames(v) options(repr.plot.width=10, repr.plot.height=5) for (j in 1:4) barplot(v[,j]/v[,j][which.max(abs(v[,j]))], cex.names = 0.7, las = 2, main = paste0("EigenVector ", j, " for tPCA"))
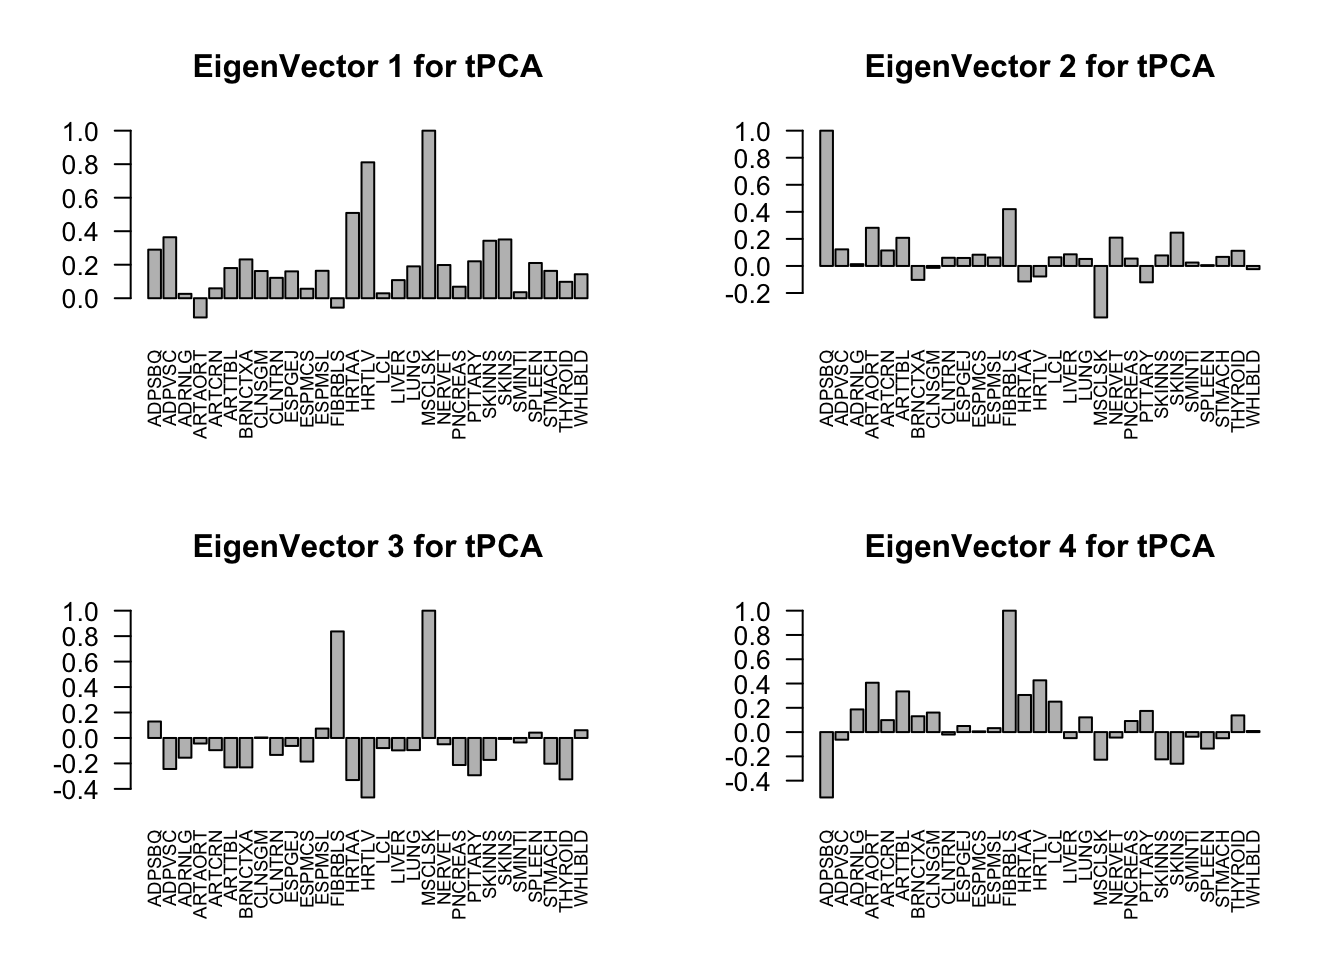
</code></pre> <p><img src="figure/sexbias_Table2.Rmd/unnamed-chunk-24-2.png" width="672" style="display: block; margin: auto;" /></p> <p>Among the 959 genes, <code>MASH</code> found 372 to be significant in at least one treatment.</p> <p>There are 84 effects are estimated as significant, even though they are originally missing! This is caused by the borrowing information from other samples.</p> <p>The plot below compares the data with the <code>mash</code> output. The gene ASMT has lots of missing vales in tissues. The <code>mash</code> model estimates all effects as significant.</p> <pre class="r"><code># before gene667 = data.frame(mash.data$Bhat[667,]) colnames(gene667) = 'EffectSize' gene667$Group = row.names(gene667) gene667$se = data.frame(ifelse(mash.data$Shat[667,]>100, 0, mash.data$Shat[667,])) gene667$EffectSize[gene667$se == 0] = NA # after gene667.post = data.frame(mash.model$result$PosteriorMean[667,]) colnames(gene667.post) = 'EffectSize' gene667.post$Group = row.names(gene667) gene667.post$se = data.frame(mash.model$result$PosteriorSD[667,]) p.orig = ggplot(gene667, aes(y = EffectSize, x = Group, color=Group)) + geom_point() + geom_errorbar(aes(ymin=EffectSize-1.96*se, ymax=EffectSize+1.96*se), width=0.4) + theme_bw(base_size=12) + coord_flip() + ggtitle('ASMT original' ) p.post = ggplot(gene667.post, aes(y = EffectSize, x = Group, color=Group)) + geom_point() + geom_errorbar(aes(ymin=EffectSize-1.96*se, ymax=EffectSize+1.96*se), width=0.4) + theme_bw(base_size=12) + coord_flip() + ggtitle('ASMT mash') + theme(legend.position = 'bottom') ggarrange(p.orig, p.post, ncol=2, nrow=1, common.legend = TRUE, legend="right")</code></pre> <pre><code>Warning: Removed 24 rows containing missing values (geom_point).</code></pre> <pre><code>Warning: Removed 24 rows containing missing values (geom_errorbar).</code></pre> <pre><code>Warning: Removed 24 rows containing missing values (geom_point).</code></pre> <pre><code>Warning: Removed 24 rows containing missing values (geom_errorbar).</code></pre> <p><img src="figure/sexbias_Table2.Rmd/unnamed-chunk-26-1.png" width="672" style="display: block; margin: auto;" /></p> <p>
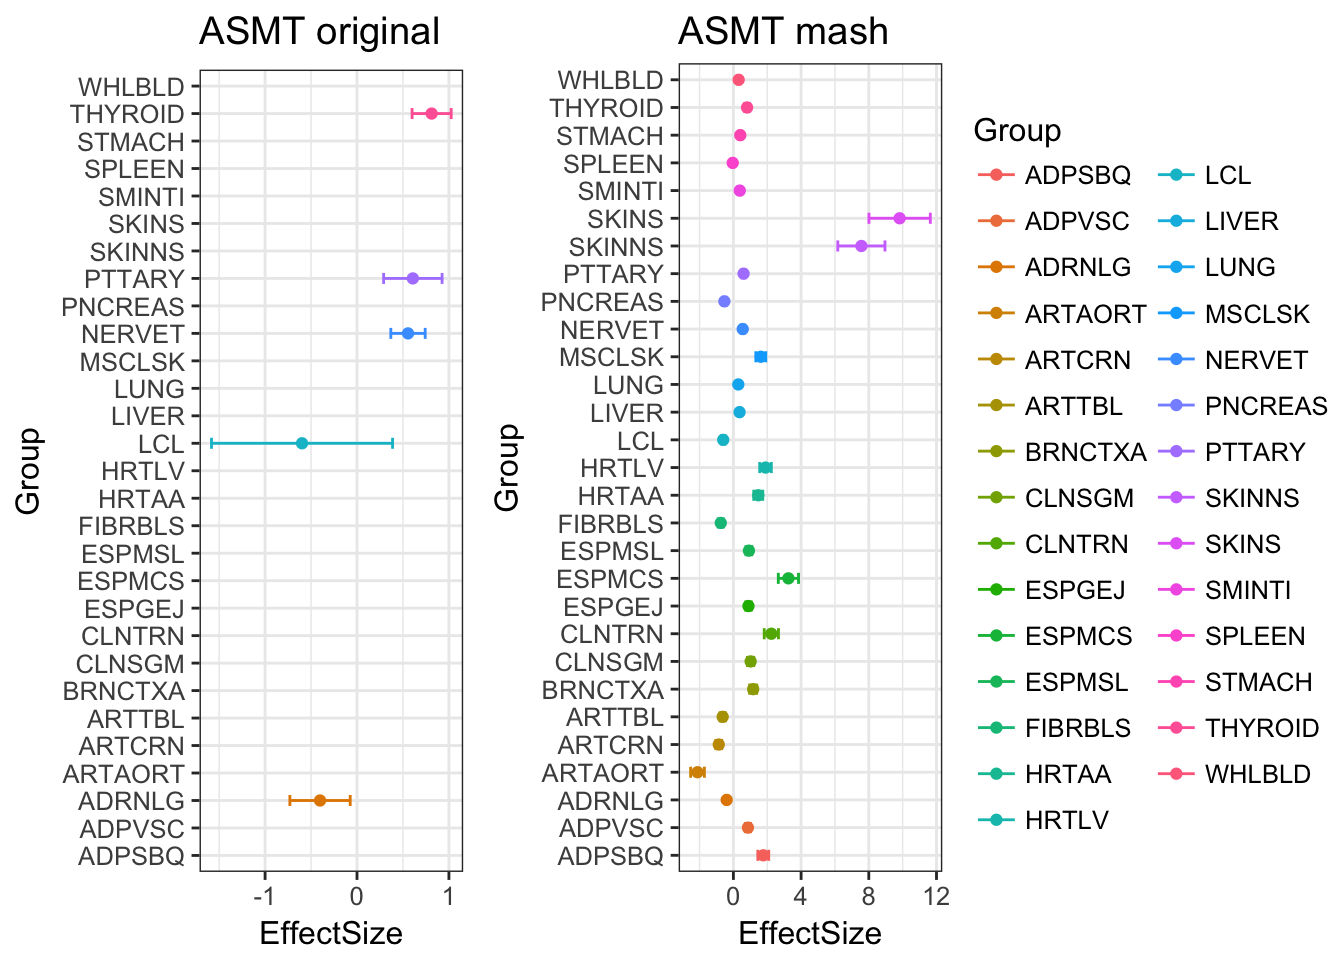
Proportion of significantly biased (FDR < 1%) genes in each tissue by reported XCI status.</p> <pre class="r"><code>Escape.prop = numeric(29) for(i in 1:29){ Escape.prop[i] = length(which(data$category[get_significant_results(mash.model,0.01, conditions = i)] == 'Escape')) / length(which(data$category == 'Escape')) } Variable.prop = numeric(29) for(i in 1:29){ Variable.prop[i] = length(which(data$category[get_significant_results(mash.model,0.01, conditions = i)] == 'Variable')) / length(which(data$category == 'Variable')) } Inac.prop = numeric(29) for(i in 1:29){ Inac.prop[i] = length(which(data$category[get_significant_results(mash.model,0.01, conditions = i)] == 'Inactive')) / length(which(data$category == 'Inactive')) } Unknown.prop = numeric(29) for(i in 1:29){ Unknown.prop[i] = length(which(data$category[get_significant_results(mash.model,0.01, conditions = i)] == 'Unknown')) / length(which(data$category == 'Unknown')) } prop = c(Escape.prop, Variable.prop, Inac.prop, Unknown.prop) group = rep(c('Escape', 'Variable', 'Inactive', 'Unknown'), each=29) boxplot(prop*100~group, ylab='Sex-bias per tissue (% of genes)')</code></pre> <p><img src="figure/sexbias_Table2.Rmd/unnamed-chunk-27-1.png" width="672" style="display: block; margin: auto;" /></p> <p>
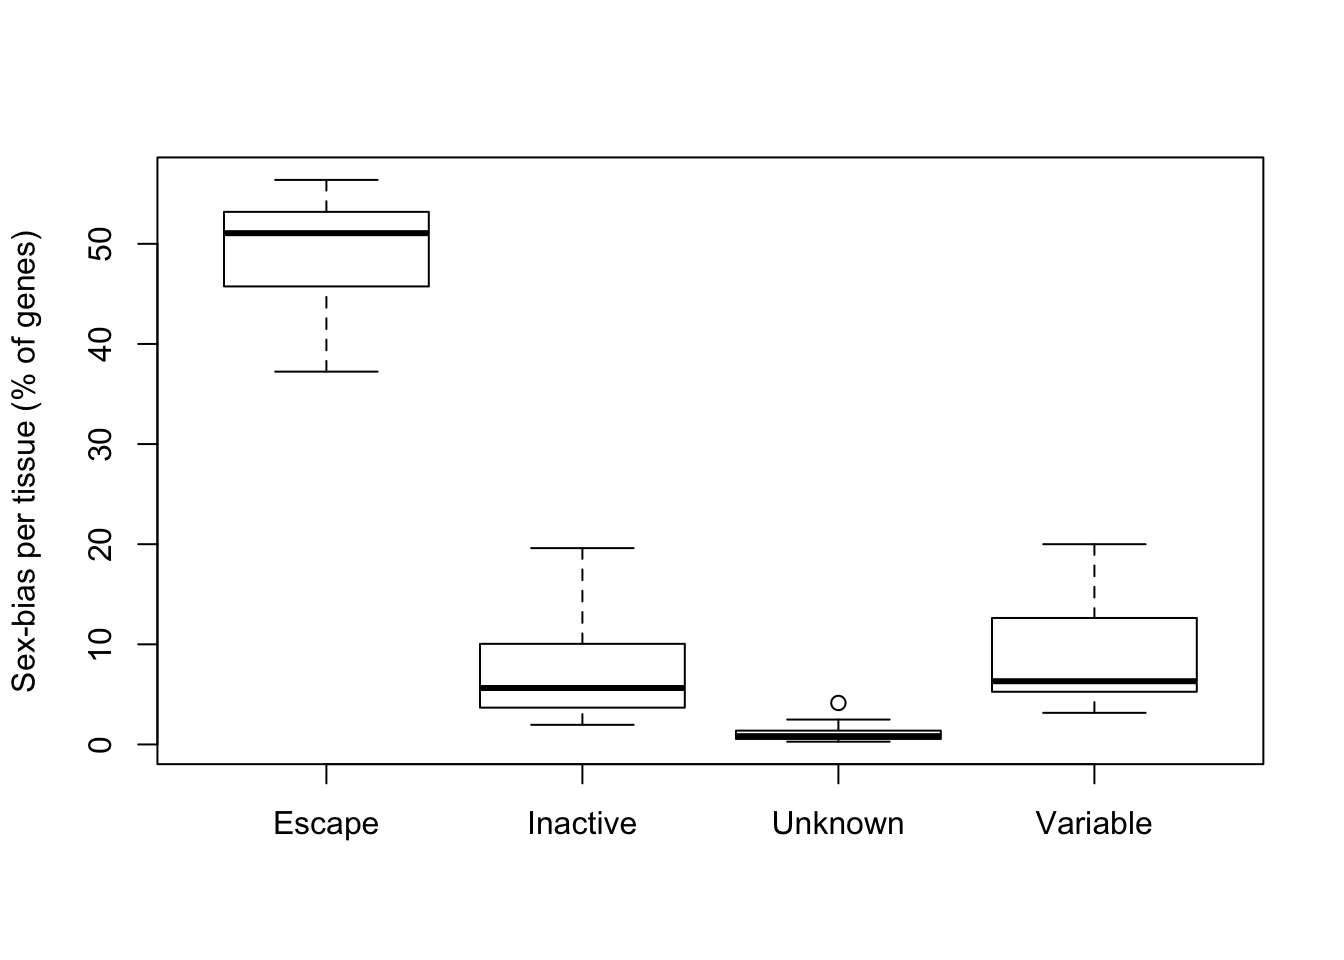
Sex biased expression is enriched in escape genes.</p> </div> <div id="session-information" class="section level1"> <h1>Session information</h1> <!-- Insert the session information into the document --> <pre class="r"><code>sessionInfo()</code></pre> <pre><code>R version 3.4.3 (2017-11-30) Platform: x86_64-apple-darwin15.6.0 (64-bit) Running under: macOS High Sierra 10.13.3 Matrix products: default BLAS: /Library/Frameworks/R.framework/Versions/3.4/Resources/lib/libRblas.0.dylib LAPACK: /Library/Frameworks/R.framework/Versions/3.4/Resources/lib/libRlapack.dylib locale: [1] en_US.UTF-8/en_US.UTF-8/en_US.UTF-8/C/en_US.UTF-8/en_US.UTF-8 attached base packages: [1] stats graphics grDevices utils datasets methods base other attached packages: [1] ggpubr_0.1.6 magrittr_1.5 ggplot2_2.2.1 corrplot_0.84 plyr_1.8.4 [6] mclust_5.4 flashr_0.5-6 mashr_0.2-6 ashr_2.2-7 gdata_2.18.0 loaded via a namespace (and not attached): [1] Rcpp_0.12.15 bindr_0.1 compiler_3.4.3 [4] git2r_0.20.0 iterators_1.0.9 tools_3.4.3 [7] digest_0.6.13 tibble_1.3.4 evaluate_0.10.1 [10] gtable_0.2.0 lattice_0.20-35 pkgconfig_2.0.1 [13] rlang_0.1.6 Matrix_1.2-12 foreach_1.4.4 [16] yaml_2.1.17 parallel_3.4.3 mvtnorm_1.0-7 [19] ebnm_0.1-10 bindrcpp_0.2 gridExtra_2.3 [22] dplyr_0.7.4 stringr_1.3.0 knitr_1.20 [25] REBayes_1.2 gtools_3.5.0 cowplot_0.9.2 [28] rprojroot_1.2 grid_3.4.3 glue_1.2.0 [31] R6_2.2.2 rmarkdown_1.8 rmeta_2.16 [34] purrr_0.2.4 backports_1.1.2 scales_0.5.0 [37] codetools_0.2-15 htmltools_0.3.6 MASS_7.3-47 [40] assertthat_0.2.0 softImpute_1.4 colorspace_1.3-2 [43] labeling_0.3 stringi_1.1.6 Rmosek_8.0.69 [46] lazyeval_0.2.1 doParallel_1.0.11 pscl_1.5.2 [49] munsell_0.4.3 truncnorm_1.0-8 SQUAREM_2017.10-1</code></pre> </div> <!-- Adjust MathJax settings so that all math formulae are shown using TeX fonts only; see http://docs.mathjax.org/en/latest/configuration.html. This will make the presentation more consistent at the cost of the webpage sometimes taking slightly longer to load. Note that this only works because the footer is added to webpages before the MathJax javascript. --> <script type="text/x-mathjax-config"> MathJax.Hub.Config({ "HTML-CSS": { availableFonts: ["TeX"] } }); </script> <hr> <p> This <a href="http://rmarkdown.rstudio.com">R Markdown</a> site was created with <a href="https://github.com/jdblischak/workflowr">workflowr</a> </p> <hr> <!-- To enable disqus, uncomment the section below and provide your disqus_shortname --> <!-- disqus <div id="disqus_thread"></div> <script type="text/javascript"> /* * * CONFIGURATION VARIABLES: EDIT BEFORE PASTING INTO YOUR WEBPAGE * * */ var disqus_shortname = 'rmarkdown'; // required: replace example with your forum shortname /* * * DON'T EDIT BELOW THIS LINE * * */ (function() { var dsq = document.createElement('script'); dsq.type = 'text/javascript'; dsq.async = true; dsq.src = '//' + disqus_shortname + '.disqus.com/embed.js'; (document.getElementsByTagName('head')[0] || document.getElementsByTagName('body')[0]).appendChild(dsq); })(); </script> <noscript>Please enable JavaScript to view the <a href="http://disqus.com/?ref_noscript">comments powered by Disqus.</a></noscript> <a href="http://disqus.com" class="dsq-brlink">comments powered by <span class="logo-disqus">Disqus</span></a> --> </div> </div> </div> <script> // add bootstrap table styles to pandoc tables function bootstrapStylePandocTables() { $('tr.header').parent('thead').parent('table').addClass('table table-condensed'); } $(document).ready(function () { bootstrapStylePandocTables(); }); </script> <!-- dynamically load mathjax for compatibility with self-contained --> <script> (function () { var script = document.createElement("script"); script.type = "text/javascript"; script.src = "https://mathjax.rstudio.com/latest/MathJax.js?config=TeX-AMS-MML_HTMLorMML"; document.getElementsByTagName("head")[0].appendChild(script); })(); </script> </body> </html>