<!DOCTYPE html>

<html xmlns="http://www.w3.org/1999/xhtml">

<head>

<meta charset="utf-8" />
<meta http-equiv="Content-Type" content="text/html; charset=utf-8" />
<meta name="generator" content="pandoc" />


<meta name="author" content="Jason Willwerscheid" />


<title>Accelerating backfits with SQUAREM and DAAREM</title>

<script src="site_libs/jquery-1.11.3/jquery.min.js"></script>
<meta name="viewport" content="width=device-width, initial-scale=1" />
<link href="site_libs/bootstrap-3.3.5/css/cosmo.min.css" rel="stylesheet" />
<script src="site_libs/bootstrap-3.3.5/js/bootstrap.min.js"></script>
<script src="site_libs/bootstrap-3.3.5/shim/html5shiv.min.js"></script>
<script src="site_libs/bootstrap-3.3.5/shim/respond.min.js"></script>
<script src="site_libs/jqueryui-1.11.4/jquery-ui.min.js"></script>
<link href="site_libs/tocify-1.9.1/jquery.tocify.css" rel="stylesheet" />
<script src="site_libs/tocify-1.9.1/jquery.tocify.js"></script>
<script src="site_libs/navigation-1.1/tabsets.js"></script>
<script src="site_libs/navigation-1.1/codefolding.js"></script>
<link href="site_libs/highlightjs-9.12.0/textmate.css" rel="stylesheet" />
<script src="site_libs/highlightjs-9.12.0/highlight.js"></script>
<link href="site_libs/font-awesome-4.5.0/css/font-awesome.min.css" rel="stylesheet" />

<style type="text/css">code{white-space: pre;}</style>
<style type="text/css">
  pre:not([class]) {
    background-color: white;
  }
</style>
<script type="text/javascript">
if (window.hljs) {
  hljs.configure({languages: []});
  hljs.initHighlightingOnLoad();
  if (document.readyState && document.readyState === "complete") {
    window.setTimeout(function() { hljs.initHighlighting(); }, 0);
  }
}
</script>


<style type="text/css">
h1 {
  font-size: 34px;
}
h1.title {
  font-size: 38px;
}
h2 {
  font-size: 30px;
}
h3 {
  font-size: 24px;
}
h4 {
  font-size: 18px;
}
h5 {
  font-size: 16px;
}
h6 {
  font-size: 12px;
}
.table th:not([align]) {
  text-align: left;
}
</style>


</head>

<body>

<style type = "text/css">
.main-container {
  max-width: 940px;
  margin-left: auto;
  margin-right: auto;
}
code {
  color: inherit;
  background-color: rgba(0, 0, 0, 0.04);
}
img {
  max-width:100%;
  height: auto;
}
.tabbed-pane {
  padding-top: 12px;
}
button.code-folding-btn:focus {
  outline: none;
}
</style>


<style type="text/css">
/* padding for bootstrap navbar */
body {
  padding-top: 51px;
  padding-bottom: 40px;
}
/* offset scroll position for anchor links (for fixed navbar)  */
.section h1 {
  padding-top: 56px;
  margin-top: -56px;
}

.section h2 {
  padding-top: 56px;
  margin-top: -56px;
}
.section h3 {
  padding-top: 56px;
  margin-top: -56px;
}
.section h4 {
  padding-top: 56px;
  margin-top: -56px;
}
.section h5 {
  padding-top: 56px;
  margin-top: -56px;
}
.section h6 {
  padding-top: 56px;
  margin-top: -56px;
}
</style>

<script>
// manage active state of menu based on current page
$(document).ready(function () {
  // active menu anchor
  href = window.location.pathname
  href = href.substr(href.lastIndexOf('/') + 1)
  if (href === "")
    href = "index.html";
  var menuAnchor = $('a[href="' + href + '"]');

  // mark it active
  menuAnchor.parent().addClass('active');

  // if it's got a parent navbar menu mark it active as well
  menuAnchor.closest('li.dropdown').addClass('active');
});
</script>


<div class="container-fluid main-container">

<!-- tabsets -->
<script>
$(document).ready(function () {
  window.buildTabsets("TOC");
});
</script>

<!-- code folding -->
<style type="text/css">
.code-folding-btn { margin-bottom: 4px; }
</style>
<script>
$(document).ready(function () {
  window.initializeCodeFolding("hide" === "show");
});
</script>


<script>
$(document).ready(function ()  {

    // move toc-ignore selectors from section div to header
    $('div.section.toc-ignore')
        .removeClass('toc-ignore')
        .children('h1,h2,h3,h4,h5').addClass('toc-ignore');

    // establish options
    var options = {
      selectors: "h1,h2,h3",
      theme: "bootstrap3",
      context: '.toc-content',
      hashGenerator: function (text) {
        return text.replace(/[.\\/?&!#<>]/g, '').replace(/\s/g, '_').toLowerCase();
      },
      ignoreSelector: ".toc-ignore",
      scrollTo: 0
    };
    options.showAndHide = true;
    options.smoothScroll = true;

    // tocify
    var toc = $("#TOC").tocify(options).data("toc-tocify");
});
</script>

<style type="text/css">

#TOC {
  margin: 25px 0px 20px 0px;
}
@media (max-width: 768px) {
#TOC {
  position: relative;
  width: 100%;
}
}


.toc-content {
  padding-left: 30px;
  padding-right: 40px;
}

div.main-container {
  max-width: 1200px;
}

div.tocify {
  width: 20%;
  max-width: 260px;
  max-height: 85%;
}

@media (min-width: 768px) and (max-width: 991px) {
  div.tocify {
    width: 25%;
  }
}

@media (max-width: 767px) {
  div.tocify {
    width: 100%;
    max-width: none;
  }
}

.tocify ul, .tocify li {
  line-height: 20px;
}

.tocify-subheader .tocify-item {
  font-size: 0.90em;
  padding-left: 25px;
  text-indent: 0;
}

.tocify .list-group-item {
  border-radius: 0px;
}


</style>

<!-- setup 3col/9col grid for toc_float and main content  -->
<div class="row-fluid">
<div class="col-xs-12 col-sm-4 col-md-3">
<div id="TOC" class="tocify">
</div>
</div>

<div class="toc-content col-xs-12 col-sm-8 col-md-9">


<div class="navbar navbar-default  navbar-fixed-top" role="navigation">
  <div class="container">
    <div class="navbar-header">
      <button type="button" class="navbar-toggle collapsed" data-toggle="collapse" data-target="#navbar">
        <span class="icon-bar"></span>
        <span class="icon-bar"></span>
        <span class="icon-bar"></span>
      </button>
      <a class="navbar-brand" href="index.html">FLASHvestigations</a>
    </div>
    <div id="navbar" class="navbar-collapse collapse">
      <ul class="nav navbar-nav">
        <li>
  <a href="index.html">Home</a>
</li>
<li>
  <a href="about.html">About</a>
</li>
      </ul>
      <ul class="nav navbar-nav navbar-right">
        <li>
  <a href="https://github.com/willwerscheid/FLASHvestigations">
    <span class="fa fa-github"></span>
     
  </a>
</li>
      </ul>
    </div><!--/.nav-collapse -->
  </div><!--/.container -->
</div><!--/.navbar -->

<!-- Add a small amount of space between sections. -->
<style type="text/css">
div.section {
  padding-top: 12px;
}
</style>

<div class="fluid-row" id="header">

<div class="btn-group pull-right">
<button type="button" class="btn btn-default btn-xs dropdown-toggle" data-toggle="dropdown" aria-haspopup="true" aria-expanded="false"><span>Code</span> <span class="caret"></span></button>
<ul class="dropdown-menu" style="min-width: 50px;">
<li><a id="rmd-show-all-code" href="#">Show All Code</a></li>
<li><a id="rmd-hide-all-code" href="#">Hide All Code</a></li>
</ul>
</div>


<h1 class="title toc-ignore">Accelerating backfits with SQUAREM and DAAREM</h1>
<h4 class="author"><em>Jason Willwerscheid</em></h4>
<h4 class="date"><em>8/17/2018</em></h4>

</div>


<p><strong>Last updated:</strong> 2018-08-17</p>
<strong>workflowr checks:</strong> <small>(Click a bullet for more information)</small>
<ul>
<li>
<p><details> <summary> <strong style="color:blue;">✔</strong> <strong>R Markdown file:</strong> up-to-date </summary></p>
<p>Great! Since the R Markdown file has been committed to the Git repository, you know the exact version of the code that produced these results.</p>
</details>
</li>
<li>
<p><details> <summary> <strong style="color:blue;">✔</strong> <strong>Environment:</strong> empty </summary></p>
<p>Great job! The global environment was empty. Objects defined in the global environment can affect the analysis in your R Markdown file in unknown ways. For reproduciblity it’s best to always run the code in an empty environment.</p>
</details>
</li>
<li>
<p><details> <summary> <strong style="color:blue;">✔</strong> <strong>Seed:</strong> <code>set.seed(20180714)</code> </summary></p>
<p>The command <code>set.seed(20180714)</code> was run prior to running the code in the R Markdown file. Setting a seed ensures that any results that rely on randomness, e.g. subsampling or permutations, are reproducible.</p>
</details>
</li>
<li>
<p><details> <summary> <strong style="color:blue;">✔</strong> <strong>Session information:</strong> recorded </summary></p>
<p>Great job! Recording the operating system, R version, and package versions is critical for reproducibility.</p>
</details>
</li>
<li>
<p><details> <summary> <strong style="color:blue;">✔</strong> <strong>Repository version:</strong> <a href="https://github.com/willwerscheid/FLASHvestigations/tree/76185c6ddc93ab2949611c4e1d1692ad578c3bf4" target="_blank">76185c6</a> </summary></p>
Great! You are using Git for version control. Tracking code development and connecting the code version to the results is critical for reproducibility. The version displayed above was the version of the Git repository at the time these results were generated. <br><br> Note that you need to be careful to ensure that all relevant files for the analysis have been committed to Git prior to generating the results (you can use <code>wflow_publish</code> or <code>wflow_git_commit</code>). workflowr only checks the R Markdown file, but you know if there are other scripts or data files that it depends on. Below is the status of the Git repository when the results were generated:
<pre><code>
Ignored files:
    Ignored:    .DS_Store
    Ignored:    .Rhistory
    Ignored:    .Rproj.user/
    Ignored:    docs/.DS_Store
    Ignored:    docs/figure/.DS_Store

Untracked files:
    Untracked:  data/greedy19.rds

Unstaged changes:
    Modified:   analysis/index.Rmd

</code></pre>
Note that any generated files, e.g. HTML, png, CSS, etc., are not included in this status report because it is ok for generated content to have uncommitted changes. </details>
</li>
</ul>
<details> <summary> <small><strong>Expand here to see past versions:</strong></small> </summary>
<ul>
<table style="border-collapse:separate; border-spacing:5px;">
<thead>
<tr>
<th style="text-align:left;">
File
</th>
<th style="text-align:left;">
Version
</th>
<th style="text-align:left;">
Author
</th>
<th style="text-align:left;">
Date
</th>
<th style="text-align:left;">
Message
</th>
</tr>
</thead>
<tbody>
<tr>
<td style="text-align:left;">
Rmd
</td>
<td style="text-align:left;">
<a href="https://github.com/willwerscheid/FLASHvestigations/blob/76185c6ddc93ab2949611c4e1d1692ad578c3bf4/analysis/squarem.Rmd" target="_blank">76185c6</a>
</td>
<td style="text-align:left;">
Jason Willwerscheid
</td>
<td style="text-align:left;">
2018-08-17
</td>
<td style="text-align:left;">
wflow_publish(“analysis/squarem.Rmd”)
</td>
</tr>
<tr>
<td style="text-align:left;">
html
</td>
<td style="text-align:left;">
<a href="https://cdn.rawgit.com/willwerscheid/FLASHvestigations/022af3c4382eae94a16d09168d84ac838e32744d/docs/squarem.html" target="_blank">022af3c</a>
</td>
<td style="text-align:left;">
Jason Willwerscheid
</td>
<td style="text-align:left;">
2018-08-17
</td>
<td style="text-align:left;">
Build site.
</td>
</tr>
<tr>
<td style="text-align:left;">
Rmd
</td>
<td style="text-align:left;">
<a href="https://github.com/willwerscheid/FLASHvestigations/blob/b9ef0075260dc4a121595719c514c843e697d62f/analysis/squarem.Rmd" target="_blank">b9ef007</a>
</td>
<td style="text-align:left;">
Jason Willwerscheid
</td>
<td style="text-align:left;">
2018-08-17
</td>
<td style="text-align:left;">
wflow_publish(“analysis/squarem.Rmd”)
</td>
</tr>
</tbody>
</table>
</ul>
<p></details></p>
<hr />
<div id="introduction" class="section level2">
<h2>Introduction</h2>
<p>This analysis is complementary to my investigations into parallelization (see <a href="parallel.html">here</a> and <a href="parallel2.html">here</a>) in that I further explore ways to speed up FLASH backfits.</p>
<p>I use two off-the-shelf EM (and MM) accelerators, SQUAREM and DAAREM. For SQUAREM details, see <a href="https://www.jstor.org/stable/41548597">Varadhan and Roland (2008)</a>. For DAAREM, see <a href="https://arxiv.org/abs/1803.06673">Henderson and Varadhan (2018)</a>.</p>
</div>
<div id="experiments" class="section level2">
<h2>Experiments</h2>
<p>I use the same GTEx dataset that I use <a href="https://willwerscheid.github.io/MASHvFLASH/MASHvFLASHgtex.html">here</a> and in <a href="parallel.html">Investigation 8</a>.</p>
<p>I use <code>flash_add_greedy</code> to create three flash fit objects with, respectively, 5, 10, and 20 factor/loading pairs. I then refine each fit using <code>flash_backfit</code> with: 1. no acceleration; 2. acceleration via SQUAREM; and 3. acceleration via DAAREM.</p>
</div>
<div id="results" class="section level2">
<h2>Results</h2>
<p>Since the experiments take a long time to run, I pre-run the code <a href="#code">below</a> and load the results from file.</p>
<pre class="r"><code>res5 &lt;- readRDS(&quot;./data/squarem/res5.rds&quot;)
res10 &lt;- readRDS(&quot;./data/squarem/res10.rds&quot;)
res20 &lt;- readRDS(&quot;./data/squarem/res20.rds&quot;)</code></pre>
<div id="convergence-behavior" class="section level3">
<h3>Convergence behavior</h3>
<p>In every case, DAAREM takes the fewest iterations to converge and convergence is nearly monotonic. In constrast, SQUAREM evinces highly non-monotonic behavior and tends to take more iterations than backfitting with no acceleration at all.</p>
<pre class="r"><code>plot_obj &lt;- function(res, main) {
  data &lt;- c(res$backfit_obj, res$squarem_obj$V1, res$daarem_obj)
  plot(1:length(res$backfit_obj), res$backfit_obj,
       type=&#39;l&#39;, col=&#39;red&#39;, ylim=c(min(data), max(data)),
       xlab=&quot;Iteration&quot;, ylab=&quot;Objective&quot;, main=main)
  lines(1:length(res$squarem_obj$V1), res$squarem_obj$V1,
        col=&#39;blue&#39;)
  lines(1:length(res$daarem_obj), res$daarem_obj,
        col=&#39;green&#39;)
  legend(&quot;bottomright&quot;, legend=c(&quot;DAAREM&quot;, &quot;No acceleration&quot;, &quot;SQUAREM&quot;),
         lty=1, col=c(&#39;green&#39;, &#39;red&#39;, &#39;blue&#39;))
}

plot_obj(res5, &quot;5 factor model&quot;)</code></pre>
<p><img src="figure/squarem.Rmd/conv-1.png" width="672" style="display: block; margin: auto;" /></p>
<details> <summary><em>
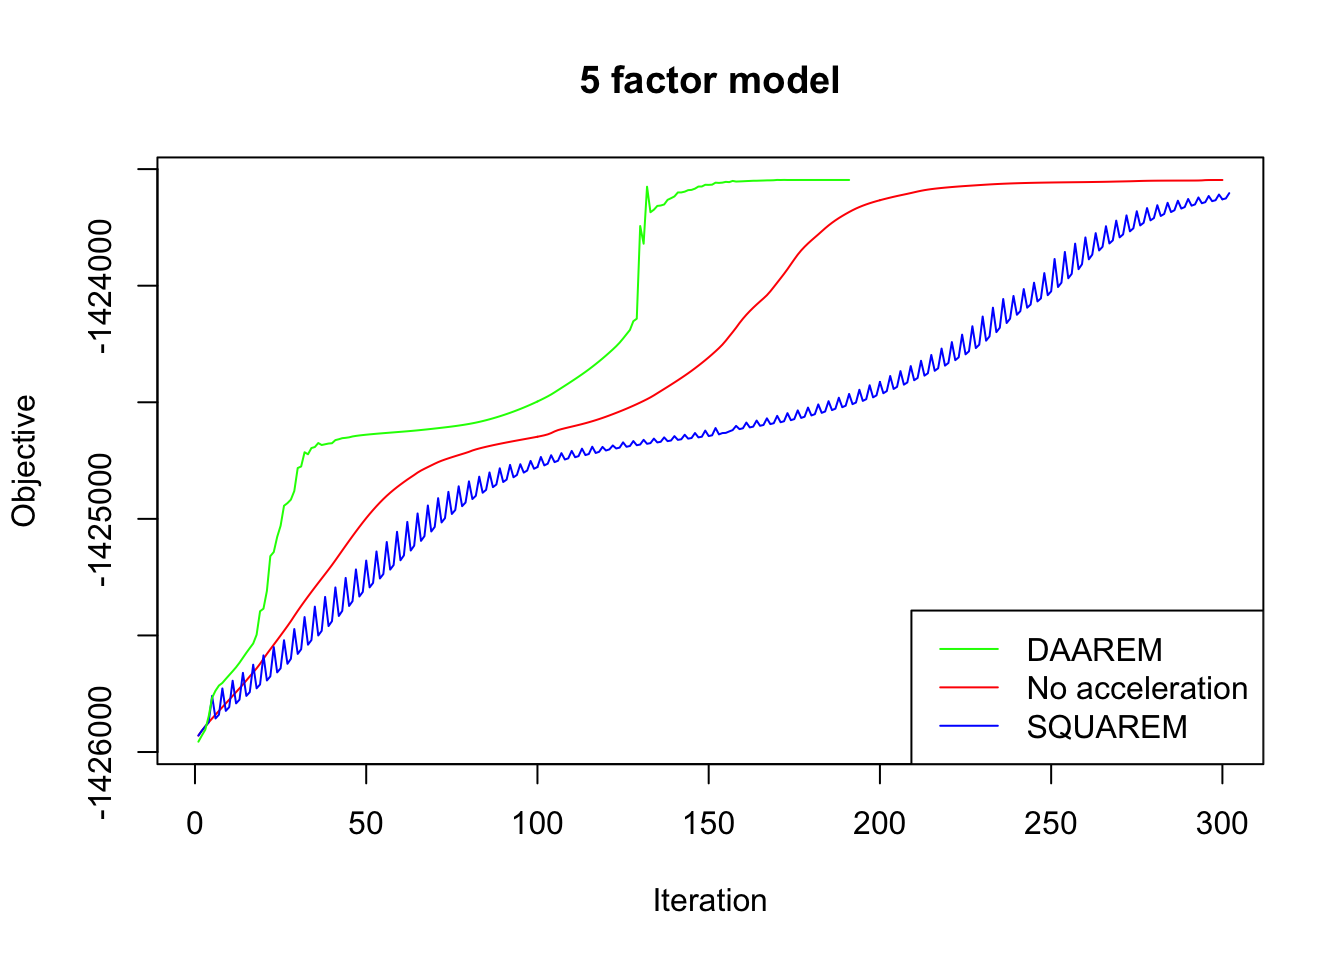
Expand here to see past versions of conv-1.png:</em></summary>
<table style="border-collapse:separate; border-spacing:5px;">
<thead>
<tr>
<th style="text-align:left;">
Version
</th>
<th style="text-align:left;">
Author
</th>
<th style="text-align:left;">
Date
</th>
</tr>
</thead>
<tbody>
<tr>
<td style="text-align:left;">
<a href="https://github.com/willwerscheid/FLASHvestigations/blob/022af3c4382eae94a16d09168d84ac838e32744d/docs/figure/squarem.Rmd/conv-1.png" target="_blank">022af3c</a>
</td>
<td style="text-align:left;">
Jason Willwerscheid
</td>
<td style="text-align:left;">
2018-08-17
</td>
</tr>
</tbody>
</table>
<p></details></p>
<pre class="r"><code>plot_obj(res10, &quot;10 factor model&quot;)</code></pre>
<p><img src="figure/squarem.Rmd/conv-2.png" width="672" style="display: block; margin: auto;" /></p>
<details> <summary><em>
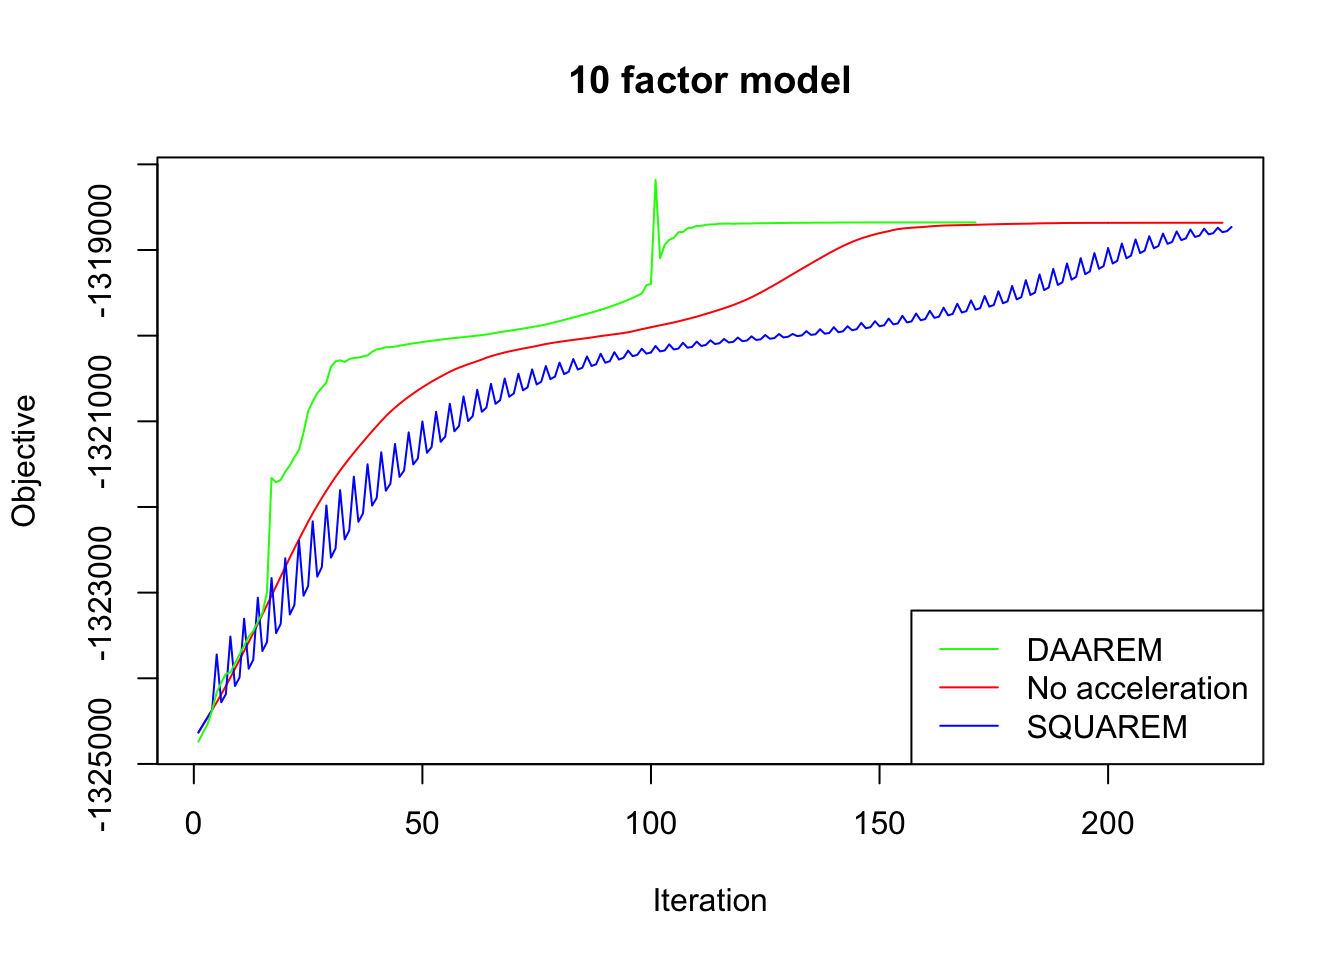
Expand here to see past versions of conv-2.png:</em></summary>
<table style="border-collapse:separate; border-spacing:5px;">
<thead>
<tr>
<th style="text-align:left;">
Version
</th>
<th style="text-align:left;">
Author
</th>
<th style="text-align:left;">
Date
</th>
</tr>
</thead>
<tbody>
<tr>
<td style="text-align:left;">
<a href="https://github.com/willwerscheid/FLASHvestigations/blob/022af3c4382eae94a16d09168d84ac838e32744d/docs/figure/squarem.Rmd/conv-2.png" target="_blank">022af3c</a>
</td>
<td style="text-align:left;">
Jason Willwerscheid
</td>
<td style="text-align:left;">
2018-08-17
</td>
</tr>
</tbody>
</table>
<p></details></p>
<pre class="r"><code>plot_obj(res20, &quot;20 factor model&quot;)</code></pre>
<p><img src="figure/squarem.Rmd/conv-3.png" width="672" style="display: block; margin: auto;" /></p>
<details> <summary><em>
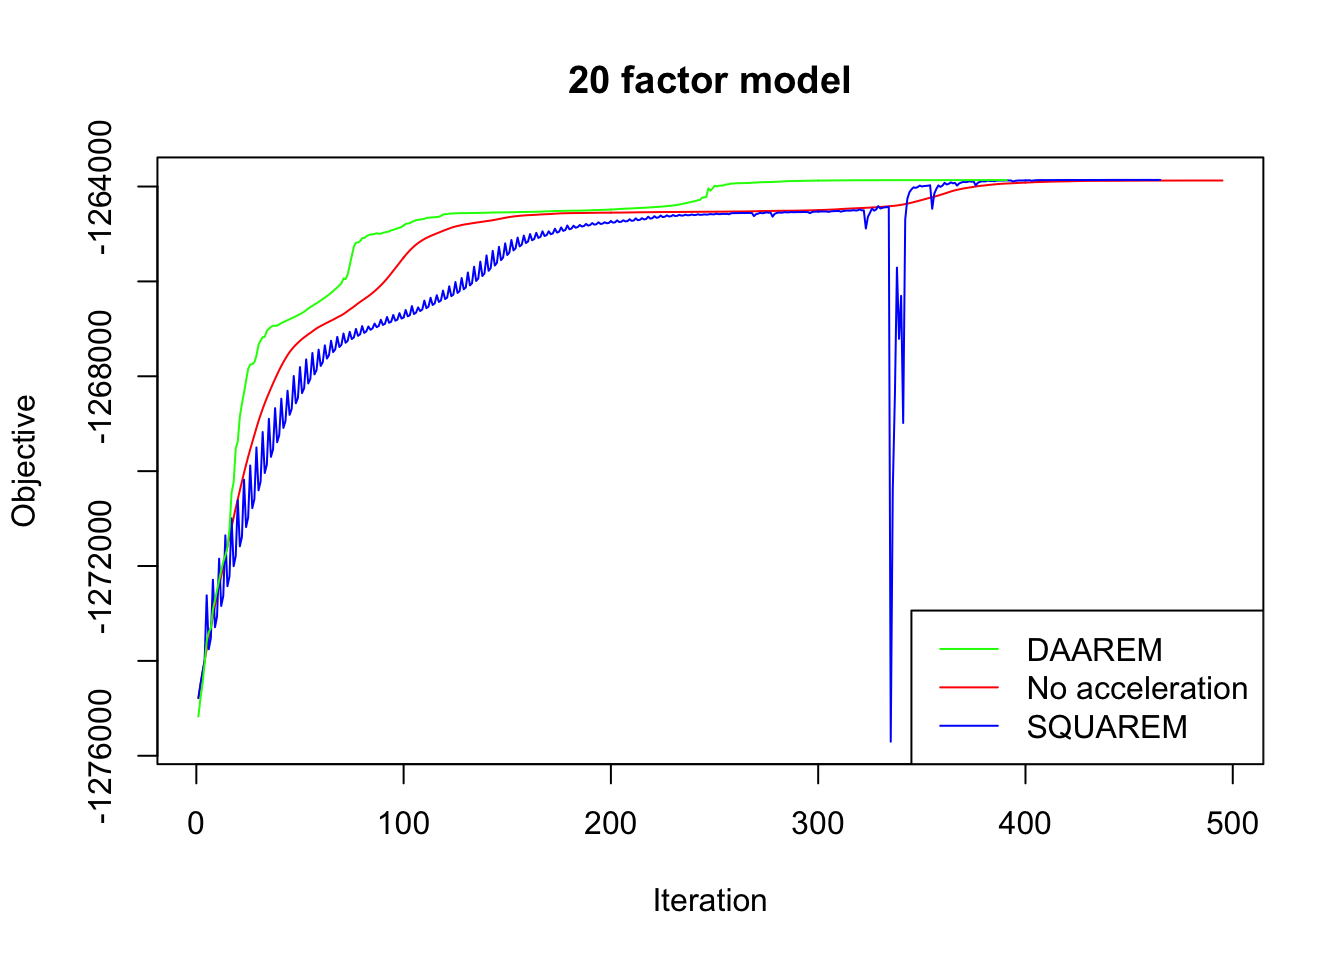
Expand here to see past versions of conv-3.png:</em></summary>
<table style="border-collapse:separate; border-spacing:5px;">
<thead>
<tr>
<th style="text-align:left;">
Version
</th>
<th style="text-align:left;">
Author
</th>
<th style="text-align:left;">
Date
</th>
</tr>
</thead>
<tbody>
<tr>
<td style="text-align:left;">
<a href="https://github.com/willwerscheid/FLASHvestigations/blob/022af3c4382eae94a16d09168d84ac838e32744d/docs/figure/squarem.Rmd/conv-3.png" target="_blank">022af3c</a>
</td>
<td style="text-align:left;">
Jason Willwerscheid
</td>
<td style="text-align:left;">
2018-08-17
</td>
</tr>
</tbody>
</table>
<p></details></p>
</div>
<div id="final-objective" class="section level3">
<h3>Final objective</h3>
<p>Since the final objectives attained are difficult to see in the plots above, I list the differences in the table below. In every case, DAAREM beats the final objective attained with no acceleration. SQUAREM does much worse on the 5- and 10-factor models, but better on the 20-factor model.</p>
<pre class="r"><code>final_obj &lt;- function(res) {
  backfit = res$backfit_obj[length(res$backfit_obj)]
  return(c(res$daarem_obj[length(res$daarem_obj)] - backfit,
           res$squarem_obj$V1[length(res$squarem_obj$V1)] - backfit))
}
table_data &lt;- cbind(&quot;5_factors&quot; = final_obj(res5), 
                    &quot;10_factors&quot; = final_obj(res10), 
                    &quot;20_factors&quot; = final_obj(res20))
rownames(table_data) = c(&quot;DAAREM (diff from backfit)&quot;, 
                         &quot;SQUAREM (diff from backfit)&quot;)
knitr::kable(table_data, digits=1)</code></pre>
<table>
<thead>
<tr class="header">
<th></th>
<th align="right">5_factors</th>
<th align="right">10_factors</th>
<th align="right">20_factors</th>
</tr>
</thead>
<tbody>
<tr class="odd">
<td>DAAREM (diff from backfit)</td>
<td align="right">0.1</td>
<td align="right">3.8</td>
<td align="right">9.1</td>
</tr>
<tr class="even">
<td>SQUAREM (diff from backfit)</td>
<td align="right">-56.5</td>
<td align="right">-48.4</td>
<td align="right">12.4</td>
</tr>
</tbody>
</table>
</div>
<div id="time-per-iteration" class="section level3">
<h3>Time per iteration</h3>
<p>The acceleration methods add a bit of overhead in terms of time required per iteration, but not much. The following are seconds required per iteration:</p>
<pre class="r"><code>times &lt;- function(res) {
  return(c(res$backfit_t[3] / length(res$backfit_obj),
           res$daarem_t[3] / length(res$daarem_obj),
           res$squarem_t[3] / length(res$squarem_obj$V1)))
}
table_data &lt;- cbind(&quot;5_factors&quot; = times(res5), 
                    &quot;10_factors&quot; = times(res10), 
                    &quot;20_factors&quot; = times(res20))
rownames(table_data) &lt;- c(&quot;backfit&quot;, &quot;DAAREM&quot;, &quot;SQUAREM&quot;)
knitr::kable(table_data, digits = 2)</code></pre>
<table>
<thead>
<tr class="header">
<th></th>
<th align="right">5_factors</th>
<th align="right">10_factors</th>
<th align="right">20_factors</th>
</tr>
</thead>
<tbody>
<tr class="odd">
<td>backfit</td>
<td align="right">1.35</td>
<td align="right">2.50</td>
<td align="right">5.57</td>
</tr>
<tr class="even">
<td>DAAREM</td>
<td align="right">1.37</td>
<td align="right">2.71</td>
<td align="right">5.53</td>
</tr>
<tr class="odd">
<td>SQUAREM</td>
<td align="right">1.47</td>
<td align="right">2.79</td>
<td align="right">5.60</td>
</tr>
</tbody>
</table>
</div>
<div id="total-iterations-to-convergence" class="section level3">
<h3>Total iterations to convergence</h3>
<p>Perhaps the most important consideration is how quickly we can obtain an estimate that is reasonable close to convergence, where “reasonably close” is defined by some stopping rule. Below I give the number of iterations required given different tolerance parameters (i.e., the number of iterations required before the difference in objective from one iteration to the next is less than <code>tol</code>). (I omit results for SQUAREM since it does so poorly in other respects.)</p>
<pre class="r"><code>niter &lt;- function(res, tols) {
  backfit_diff &lt;- (res$backfit_obj[2:length(res$backfit_obj)] -
                     res$backfit_obj[1:(length(res$backfit_obj) - 1)])
  daarem_diff &lt;- (res$daarem_obj[2:length(res$daarem_obj)] -
                     res$daarem_obj[1:(length(res$daarem_obj) - 1)])
  res &lt;- matrix(NA, nrow = length(tols), ncol = 2)
  for (i in 1:length(tols)) {
    res[i, 1] &lt;- min(which(backfit_diff &lt; tols[i])) + 1
    res[i, 2] &lt;- min(which(abs(daarem_diff) &lt; tols[i])) + 1
  }
  rownames(res) = paste(&quot;tol =&quot;, as.character(tols))
  colnames(res) = c(&quot;backfit&quot;, &quot;DAAREM&quot;)
  return(t(res))
}

table_data &lt;- niter(res5, c(0.5, 0.1, 0.05))
knitr::kable(table_data, caption = &quot;5 factors&quot;)</code></pre>
<table>
<caption>5 factors</caption>
<thead>
<tr class="header">
<th></th>
<th align="right">tol = 0.5</th>
<th align="right">tol = 0.1</th>
<th align="right">tol = 0.05</th>
</tr>
</thead>
<tbody>
<tr class="odd">
<td>backfit</td>
<td align="right">240</td>
<td align="right">283</td>
<td align="right">286</td>
</tr>
<tr class="even">
<td>DAAREM</td>
<td align="right">142</td>
<td align="right">174</td>
</tr>
</tbody>
</table>
<pre class="r"><code>table_data &lt;- niter(res10, c(0.5, 0.1, 0.05))
knitr::kable(table_data, caption = &quot;10 factors&quot;)</code></pre>
<table>
<caption>10 factors</caption>
<thead>
<tr class="header">
<th></th>
<th align="right">tol = 0.5</th>
<th align="right">tol = 0.1</th>
<th align="right">tol = 0.05</th>
</tr>
</thead>
<tbody>
<tr class="odd">
<td>backfit</td>
<td align="right">192</td>
<td align="right">201</td>
<td align="right">208</td>
</tr>
<tr class="even">
<td>DAAREM</td>
<td align="right">111</td>
<td align="right">116</td>
</tr>
</tbody>
</table>
<pre class="r"><code>table_data &lt;- niter(res20, c(0.5, 0.1, 0.05))
knitr::kable(table_data, caption = &quot;20 factors&quot;)</code></pre>
<table>
<caption>20 factors</caption>
<thead>
<tr class="header">
<th></th>
<th align="right">tol = 0.5</th>
<th align="right">tol = 0.1</th>
<th align="right">tol = 0.05</th>
</tr>
</thead>
<tbody>
<tr class="odd">
<td>backfit</td>
<td align="right">183</td>
<td align="right">452</td>
<td align="right">483</td>
</tr>
<tr class="even">
<td>DAAREM</td>
<td align="right">127</td>
<td align="right">129</td>
</tr>
</tbody>
</table>
</div>
</div>
<div id="code" class="section level2">
<h2>Code</h2>
<p>Click “Code” to view the code used to produce the above results.</p>
<pre class="r"><code># Load packages ---------------------------------------------------------

# devtools::install_github(&quot;stephenslab/flashr&quot;)
devtools::load_all(&quot;/Users/willwerscheid/GitHub/flashr/&quot;)
# devtools::install_github(&quot;stephenslab/ebnm&quot;)
devtools::load_all(&quot;/Users/willwerscheid/GitHub/ebnm/&quot;)
library(SQUAREM)
library(daarem)

# Load data -------------------------------------------------------------

gtex &lt;- readRDS(gzcon(url(&quot;https://github.com/stephenslab/gtexresults/blob/master/data/MatrixEQTLSumStats.Portable.Z.rds?raw=TRUE&quot;)))
data &lt;- flash_set_data(t(gtex$strong.z), S = 1)

# Create flash objects for backfitting ----------------------------------

fl_g5 &lt;- flash_add_greedy(data, Kmax = 5,
                          var_type = &quot;zero&quot;, init_fn = &quot;udv_svd&quot;)

fl_g10 &lt;- flash_add_greedy(data, Kmax = 5, f_init = fl_g5,
                           var_type = &quot;zero&quot;, init_fn = &quot;udv_svd&quot;)

fl_g20 &lt;- flash_add_greedy(data, Kmax = 10, f_init = fl_g10,
                           var_type = &quot;zero&quot;, init_fn = &quot;udv_svd&quot;)

# Testing functions -----------------------------------------------------

logit &lt;- function(x) {log(x / (1 - x))}
inv_logit &lt;- function(x) {exp(x) / (1 + exp(x))}

fl.to.param &lt;- function(f) {
  c(as.vector(f$EL), as.vector(f$EF),
    as.vector(f$EL2), as.vector(f$EF2),
    sapply(f$gl, function(k) {logit(k$pi0)}),
    sapply(f$gf, function(k) {logit(k$pi0)}),
    sapply(f$gl, function(k) {log(k$a)}),
    sapply(f$gf, function(k) {log(k$a)}))
}

param.to.fl &lt;- function(param, m, n, k) {
  LL = matrix(param[1:(m*k)], ncol=k)
  curr_idx = m*k
  FF = matrix(param[(curr_idx + 1):(curr_idx + n*k)], ncol=k)
  curr_idx = curr_idx + n*k

  f = flashr:::flash_init_lf(LL, FF)

  f$EL2 = matrix(param[(curr_idx + 1):(curr_idx + m*k)], ncol=k)
  curr_idx = curr_idx + m*k
  f$EF2 = matrix(param[(curr_idx + 1):(curr_idx + n*k)], ncol=k)
  curr_idx = curr_idx + n*k

  f$gl = list()
  f$gf = list()
  for (i in 1:k) {
    f$gl[[i]] = list()
    f$gl[[i]]$pi0 = inv_logit(param[curr_idx + 1])
    curr_idx = curr_idx + 1
  }
  for (i in 1:k) {
    f$gf[[i]] = list()
    f$gf[[i]]$pi0 = inv_logit(param[curr_idx + 1])
    curr_idx = curr_idx + 1
  }
  for (i in 1:k) {
    f$gl[[i]]$a = exp(param[curr_idx + 1])
    curr_idx = curr_idx + 1
  }
  for (i in 1:k) {
    f$gf[[i]]$a = exp(param[curr_idx + 1])
    curr_idx = curr_idx + 1
  }

  return(f)
}

flash.iter &lt;- function(p, data, m, n, k) {
  init_fl = param.to.fl(p, m, n, k)
  fl = flash_backfit(data, init_fl,
                     ebnm_fn = &quot;ebnm_pn&quot;, var_type = &quot;zero&quot;,
                     nullcheck = FALSE, verbose = FALSE,
                     maxiter = 1)
  obj = flash_get_objective(data, fl)
  message(obj)
  return(c(fl.to.param(fl), obj))
}

flash.obj &lt;- function(p, data, m, n, k) {
  return(p[length(p)])
}

run_test &lt;- function(f_init, data, niter) {
  m &lt;- flash_get_n(f_init)
  n &lt;- flash_get_p(f_init)
  k &lt;- flash_get_k(f_init)

  backfit_obj &lt;- rep(NA, niter)
  f &lt;- f_init
  backfit_t &lt;- system.time({
    for (i in 1:niter) {
      f &lt;- flash_backfit(data, f,
                         ebnm_fn = &quot;ebnm_pn&quot;, var_type = &quot;zero&quot;,
                         nullcheck = FALSE, verbose = FALSE,
                         maxiter = 1)
      obj &lt;- flash_get_objective(data, f)
      message(obj)
      backfit_obj[i] &lt;- obj
    }
  })

  message(&quot;Sinking SQUAREM results to file...&quot;)
  zz &lt;- file(&quot;tmp.txt&quot;, open=&quot;wt&quot;)
  sink(zz, type=&quot;message&quot;)
  squarem_t &lt;- system.time(
    squarem_res &lt;- squarem(c(fl.to.param(f_init),
                             flash_get_objective(data, f_init)),
                           flash.iter, flash.obj,
                           data = data, m = m, n = n, k = k,
                           control = (list(tol=1, maxiter=niter)))
  )
  sink(type=&quot;message&quot;)
  squarem_obj &lt;- read.csv(&quot;tmp.txt&quot;, header = FALSE, sep = &#39;\n&#39;)
  file.remove(&quot;tmp.txt&quot;)

  daarem_t &lt;- system.time(
    daarem_res &lt;- daarem(c(fl.to.param(f_init),
                           flash_get_objective(data, f_init)),
                         flash.iter, flash.obj,
                         data = data, m = m, n = n, k = k,
                         control = (list(tol=1, maxiter=niter)))
  )

  return(list(backfit_obj = backfit_obj, backfit_t = backfit_t,
              squarem_obj = squarem_obj, squarem_t = squarem_t,
              daarem_obj = daarem_res$objfn.track, daarem_t = daarem_t))
}

# Run tests -------------------------------------------------------------

fpath &lt;- &quot;./data/squarem/&quot;

# Normal backfit of fl_g5 takes 304 iterations.
res_5 &lt;- run_test(fl_g5, data, niter = 300)
saveRDS(res_5, paste0(fpath, &quot;res5.rds&quot;))

# Normal backfit of fl_g10 takes 228 iterations.
res_10 &lt;- run_test(fl_g10, data, niter = 225)
saveRDS(res_10, paste0(fpath, &quot;res10.rds&quot;))

# Normal backfit of fl_g20 takes 497 iterations.
res_20 &lt;- run_test(fl_g20, data, niter = 495)
saveRDS(res_20, paste0(fpath, &quot;res20.rds&quot;))


# Use this function if gf and gl parameters aren&#39;t converted to a
#   log/logit scale.
#
# flash.iter &lt;- function(p) {
#   init_fl = param.to.fl(p[1:(length(p) - 1)])
#   fl = try(flash_backfit(data, init_fl, ebnm_fn=&quot;ebnm_pn&quot;,
#                          ebnm_param=list(warmstart=TRUE),
#                          var_type=&quot;zero&quot;, nullcheck=F, maxiter=1))
#   if (class(fl) == &quot;try-error&quot;) {
#     fl = flash_backfit(data, init_fl, ebnm_fn=&quot;ebnm_pn&quot;,
#                        ebnm_param=list(warmstart=FALSE),
#                        var_type=&quot;zero&quot;, nullcheck=F, maxiter=1)
#   }
#   return(c(f.to.param(fl), flash_get_objective(data, fl)))
# }

plot_obj &lt;- function(res) {
  data &lt;- c(res$backfit_obj, res$squarem_obj$V1, res$daarem_obj)
  plot(1:length(res$backfit_obj), res$backfit_obj,
       type=&#39;l&#39;, col=&#39;red&#39;, ylim=c(min(data), max(data)),
       xlab=&quot;Iteration&quot;, ylab=&quot;Objective&quot;)
  lines(1:length(res$squarem_obj$V1), res$squarem_obj$V1,
        col=&#39;blue&#39;)
  lines(1:length(res$daarem_obj), res$daarem_obj,
        col=&#39;green&#39;)
}

plot_obj_zoom &lt;- function(res, yrange) {
  data &lt;- c(res$backfit_obj, res$squarem_obj$V1, res$daarem_obj)
  max_obj &lt;- max(data)
  t &lt;- max_obj - yrange
  begin_iter &lt;- min(c(which(res$backfit_obj &gt; t),
                      which(res$squarem_obj &gt; t),
                      which(res$daarem_obj &gt; t)))
  plot(1:length(res$backfit_obj), res$backfit_obj,
       type=&#39;l&#39;, col=&#39;red&#39;,
       xlim=c(begin_iter, length(res$backfit_obj)),
       ylim=c(t, max_obj),
       xlab=&quot;Iteration&quot;, ylab=&quot;Objective&quot;)
  lines(1:length(res$squarem_obj$V1), res$squarem_obj$V1,
        col=&#39;blue&#39;)
  lines(1:length(res$daarem_obj), res$daarem_obj,
        col=&#39;green&#39;)
}</code></pre>
</div>
<div id="session-information" class="section level2">
<h2>Session information</h2>
<pre class="r"><code>sessionInfo()</code></pre>
<pre><code>R version 3.4.3 (2017-11-30)
Platform: x86_64-apple-darwin15.6.0 (64-bit)
Running under: macOS High Sierra 10.13.6

Matrix products: default
BLAS: /Library/Frameworks/R.framework/Versions/3.4/Resources/lib/libRblas.0.dylib
LAPACK: /Library/Frameworks/R.framework/Versions/3.4/Resources/lib/libRlapack.dylib

locale:
[1] en_US.UTF-8/en_US.UTF-8/en_US.UTF-8/C/en_US.UTF-8/en_US.UTF-8

attached base packages:
[1] stats     graphics  grDevices utils     datasets  methods   base     

loaded via a namespace (and not attached):
 [1] workflowr_1.0.1   Rcpp_0.12.17      digest_0.6.15    
 [4] rprojroot_1.3-2   R.methodsS3_1.7.1 backports_1.1.2  
 [7] git2r_0.21.0      magrittr_1.5      evaluate_0.10.1  
[10] highr_0.6         stringi_1.1.6     whisker_0.3-2    
[13] R.oo_1.21.0       R.utils_2.6.0     rmarkdown_1.8    
[16] tools_3.4.3       stringr_1.3.0     yaml_2.1.17      
[19] compiler_3.4.3    htmltools_0.3.6   knitr_1.20       </code></pre>
</div>

<!-- Adjust MathJax settings so that all math formulae are shown using
TeX fonts only; see
http://docs.mathjax.org/en/latest/configuration.html.  This will make
the presentation more consistent at the cost of the webpage sometimes
taking slightly longer to load. Note that this only works because the
footer is added to webpages before the MathJax javascript. -->
<script type="text/x-mathjax-config">
  MathJax.Hub.Config({
    "HTML-CSS": { availableFonts: ["TeX"] }
  });
</script>

<hr>
<p>
  This reproducible <a href="http://rmarkdown.rstudio.com">R Markdown</a>
  analysis was created with
  <a href="https://github.com/jdblischak/workflowr">workflowr</a> 1.0.1
</p>
<hr>


</div>
</div>

</div>

<script>

// add bootstrap table styles to pandoc tables
function bootstrapStylePandocTables() {
  $('tr.header').parent('thead').parent('table').addClass('table table-condensed');
}
$(document).ready(function () {
  bootstrapStylePandocTables();
});


</script>

<!-- dynamically load mathjax for compatibility with self-contained -->
<script>
  (function () {
    var script = document.createElement("script");
    script.type = "text/javascript";
    script.src  = "https://mathjax.rstudio.com/latest/MathJax.js?config=TeX-AMS-MML_HTMLorMML";
    document.getElementsByTagName("head")[0].appendChild(script);
  })();
</script>

</body>
</html>