# tuneloop
Local analytics for your AI coding sessions. **Understand and improve your
coding agent usage.**
tuneloop turns the session transcripts your AI coding tools already write into a
local dashboard that gives you cost attribution (what each PR / feature cost)
and recommendations for more effective usage grounded in your sessions.
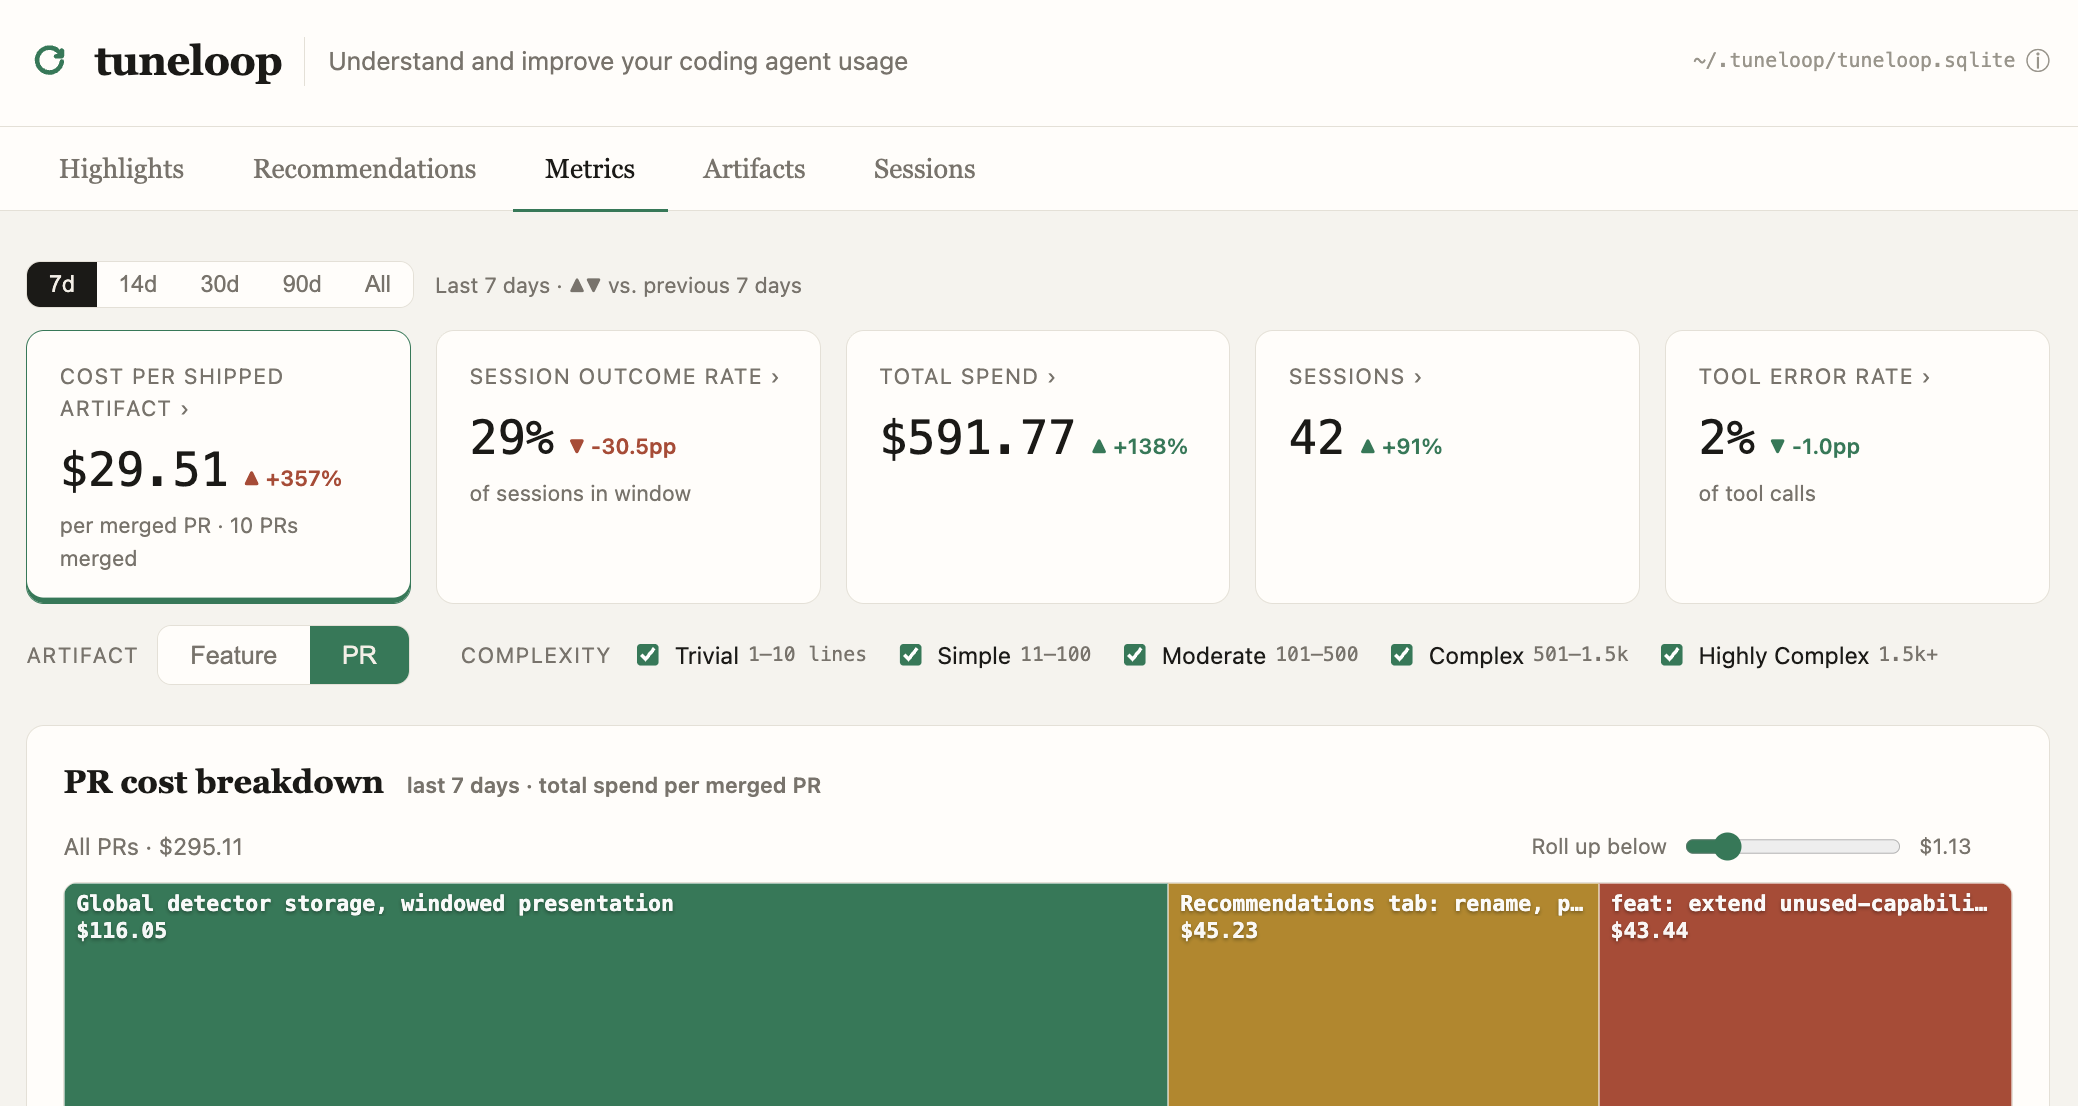
Concretely, it enriches each session with:
- **Outcome links** — merged PRs, features shipped, files changed
- **Granular cost attribution to outcomes**
- **Task complexity**
- **Agent autonomy**
- **Work type**
- **Key decisions**
- **Tool error categories**
and across sessions, identifies:
- **Agent re-work / re-steer themes**
- **Patterns of deviations from best practices**
Combined with the data already in the transcript — model, agent harness, repo, and
more — this data lets you answer questions like:
- How much of my AI spend went into PR #2, or feature *X*?
- Are my agents getting more autonomous over time on complex tasks?
- What's my success rate on repo *X* vs. repo *Y* — or any other dimension you care about?
Works with Claude Code, Codex, OpenCode, and Pi. Everything runs and stays
on your machine; enrichments that need an LLM can use your own provider key or a
local model. The built-ins above are just the defaults — tuneloop is extensible,
and adding your own enrichment is straightforward.
> Built by the team at [Tuneloop](https://tuneloop.io).
## Quick start
Requires Node.js >= 22.19 (`npx` runs on whatever `node` your shell resolves —
check with `node -v`).
```bash
npx tuneloop analyze
```
This scans typical session folders like `~/.claude/projects`, builds a local
store, and prints a summary like this:
```
Scanned 336 file(s), parsed 334 session(s) into 118 unique session(s), 118 new/changed.
Sessions 118
Total spend $1566.56
Tokens 1,769,497,264
Range 2026-04-16 → 2026-07-27
Cost / merged PR $15.31 (56 merged)
Analysis spend $6.92 (enrichment)
Analysis finished in 6m 11s (Step 1 processing 3m 28s · Step 2 detectors 2m 34s).
tuneloop dashboard http://localhost:4319
store: ~/.tuneloop/tuneloop.sqlite
Enter to open in your browser · Ctrl+C to stop
```
Press **Enter** and it opens the dashboard, where you see everything from the
[What you get](#what-you-get) section below. In the summary above, `Total spend` is your
analyzed sessions' AI cost, while `Analysis spend` is what tuneloop's own LLM
calls cost to produce all of it — a few dollars, here with a Claude Haiku + Sonnet
model pair (see [LLM enrichment](#llm-enrichment)). The **first run** processes
every transcript, so expect a few minutes (about 6 for ~120 sessions with
enrichment on; static-only runs are faster); later runs are incremental and only
re-process sessions that changed, so they finish quickly. Point it at other
locations with a comma-separated list:
```bash
npx tuneloop analyze ~/.claude/projects,/path/to/more/sessions
```
Handy flags:
- `--no-serve` — build the store and exit, no dashboard
- `--port ` — serve on a different port
- `--address ` — bind a specific interface (default `127.0.0.1`; e.g. `0.0.0.0` to sit behind a reverse proxy). The dashboard is unauthenticated and serves your session transcripts, so only expose it on networks you trust
- `--config ` — a JSON file selecting which processors/detectors run (see below)
- `npx tuneloop serve` — open the dashboard over an already-analyzed store, without re-analyzing
### Choosing what runs
By default `analyze` runs every built-in processor and detector. To run only a
subset, copy the shipped [`config.json`](./config.json) — it lists everything —
delete or disable what you don't want, and pass it with `--config`:
```bash
npx tuneloop analyze --config ./my-config.json
```
Each entry is keyed by name with an `enabled` flag; omit a whole section
(`processors` or `detectors`) to keep all of that kind. A processor's
dependencies are pulled in automatically, so you can't accidentally starve one
of its inputs. See [ARCHITECTURE.md](./ARCHITECTURE.md#built-in-processors) for
the full list and what each does.
## What you get
The dashboard reads everything live from a local SQLite store:
- **Cost per shipped artifact** — dollars of AI spend per merged PR or per shipped feature.
- **Session outcome rate** — how many of your sessions ended in a win (you pick what counts).
- **Total spend** — over time, split by model, work type, or repo.
- **Tool & skill usage** — call counts, error rates, and error categories across every session.
Cost, tools, files, and git/PR outcomes come from static analysis — no setup or
API key. Work type, complexity, autonomy, and feature names come from [LLM
enrichment](#llm-enrichment), which is worth setting up: much of what makes the
dashboard useful depends on it.
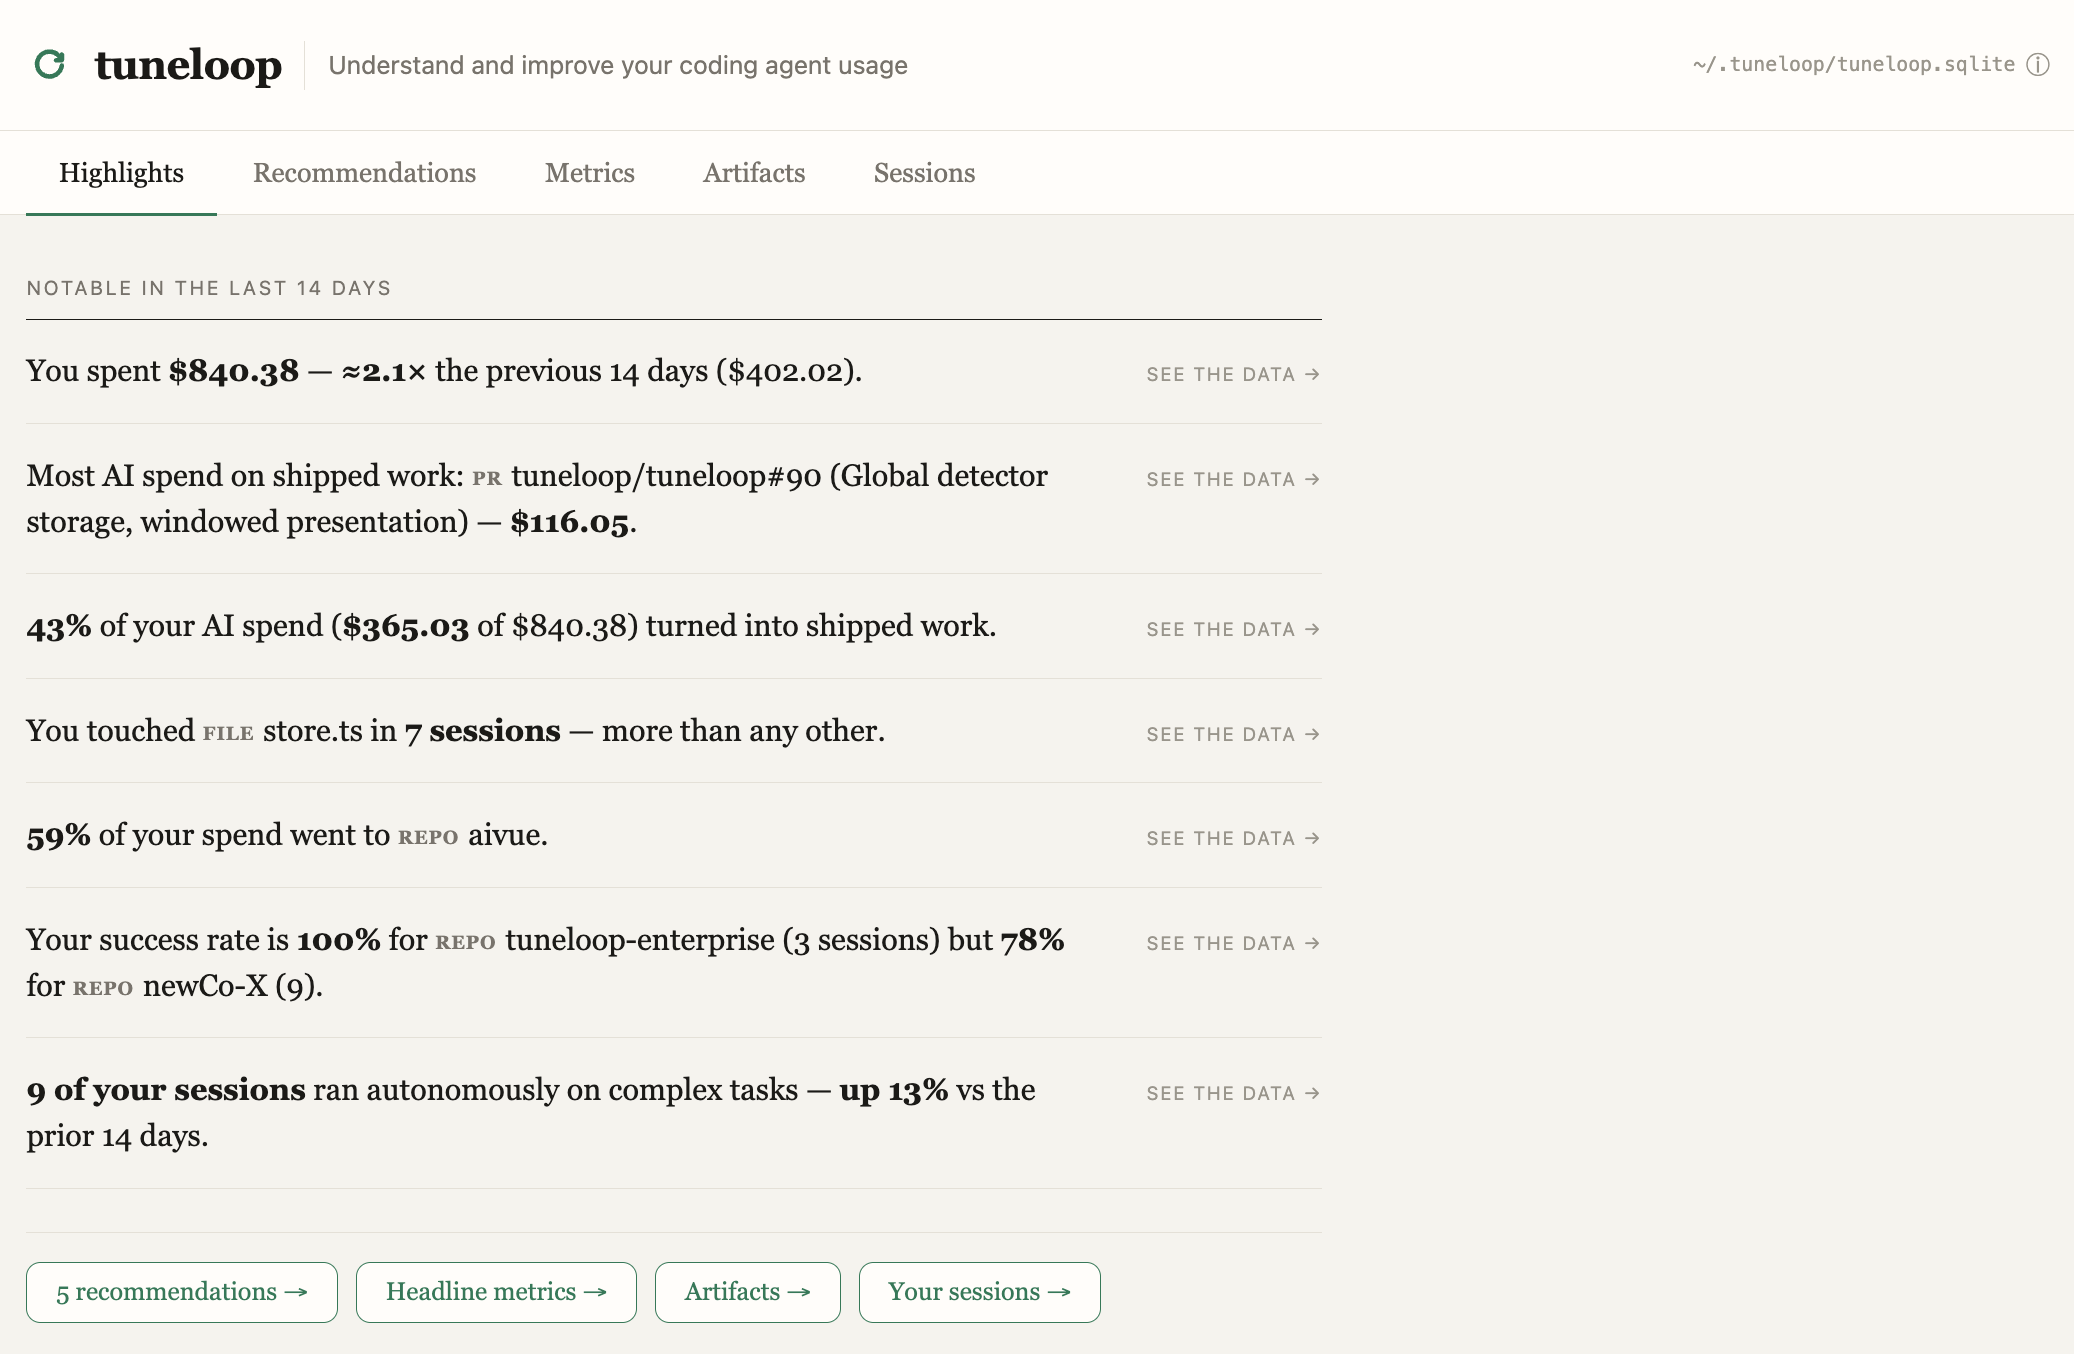
**Highlights** turns the same data into plain-English insights about your recent work:
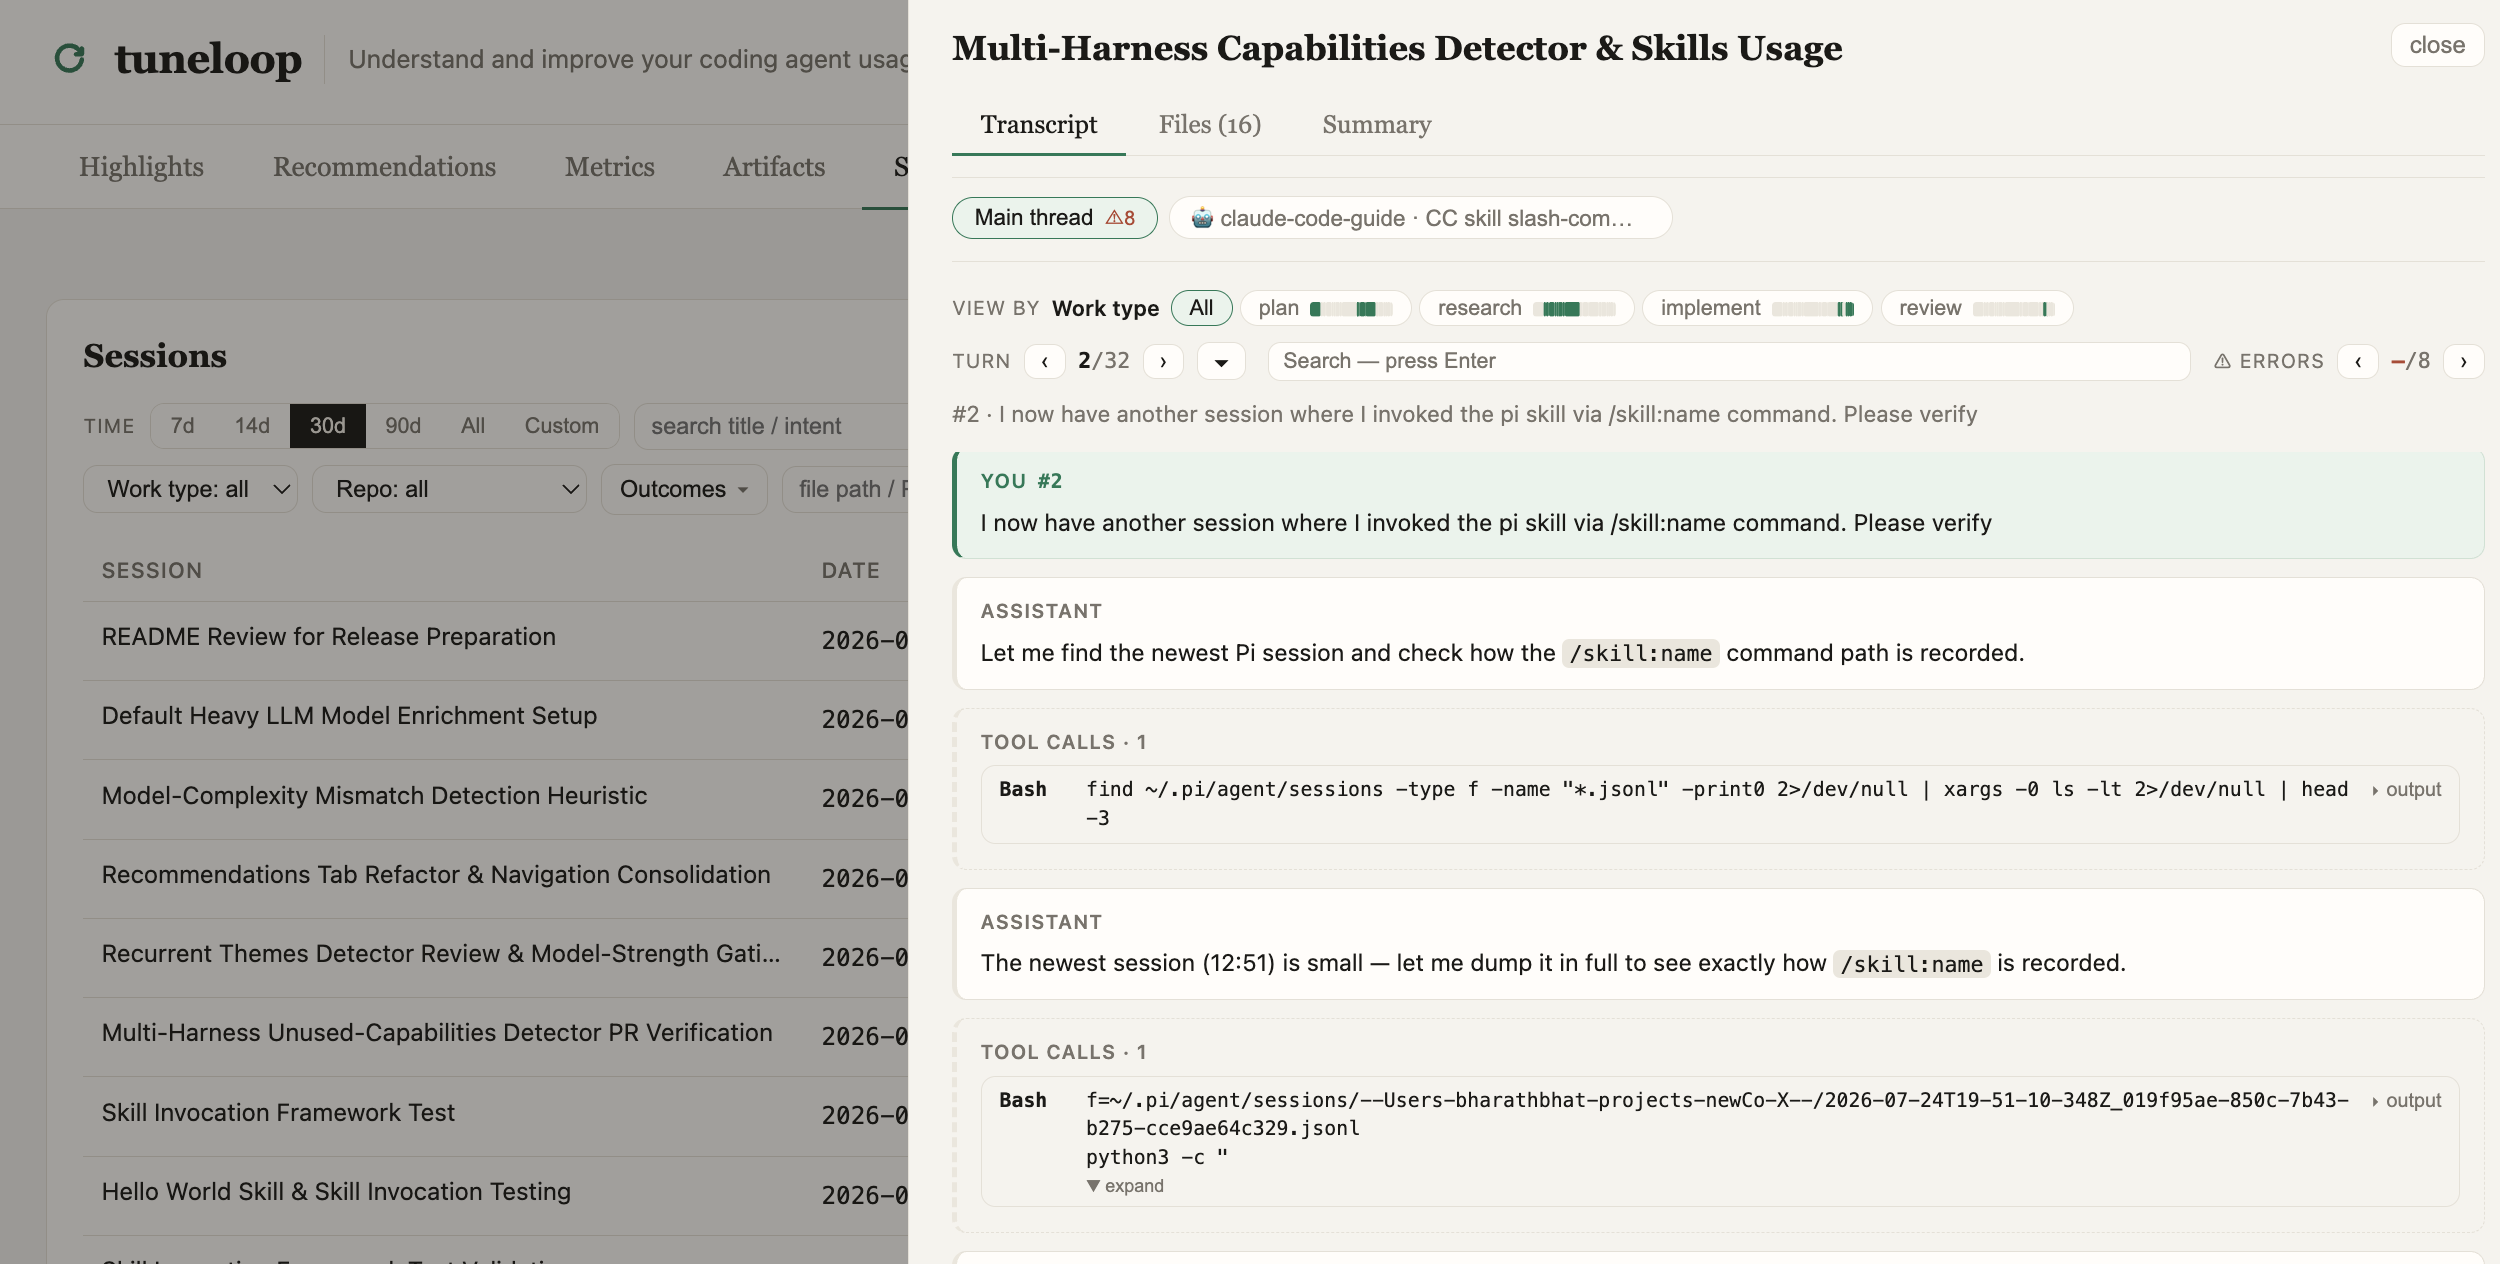
A **filterable session viewer**, with the full transcript and file changes behind each one.
- Easy transcript navigation (turn-by-turn, errors, free text search, and outcomes). For example: you can jump to the part of the session where you worked on a particular feature or code change.
- Filter sessions that touched a particular file / PR / feature.
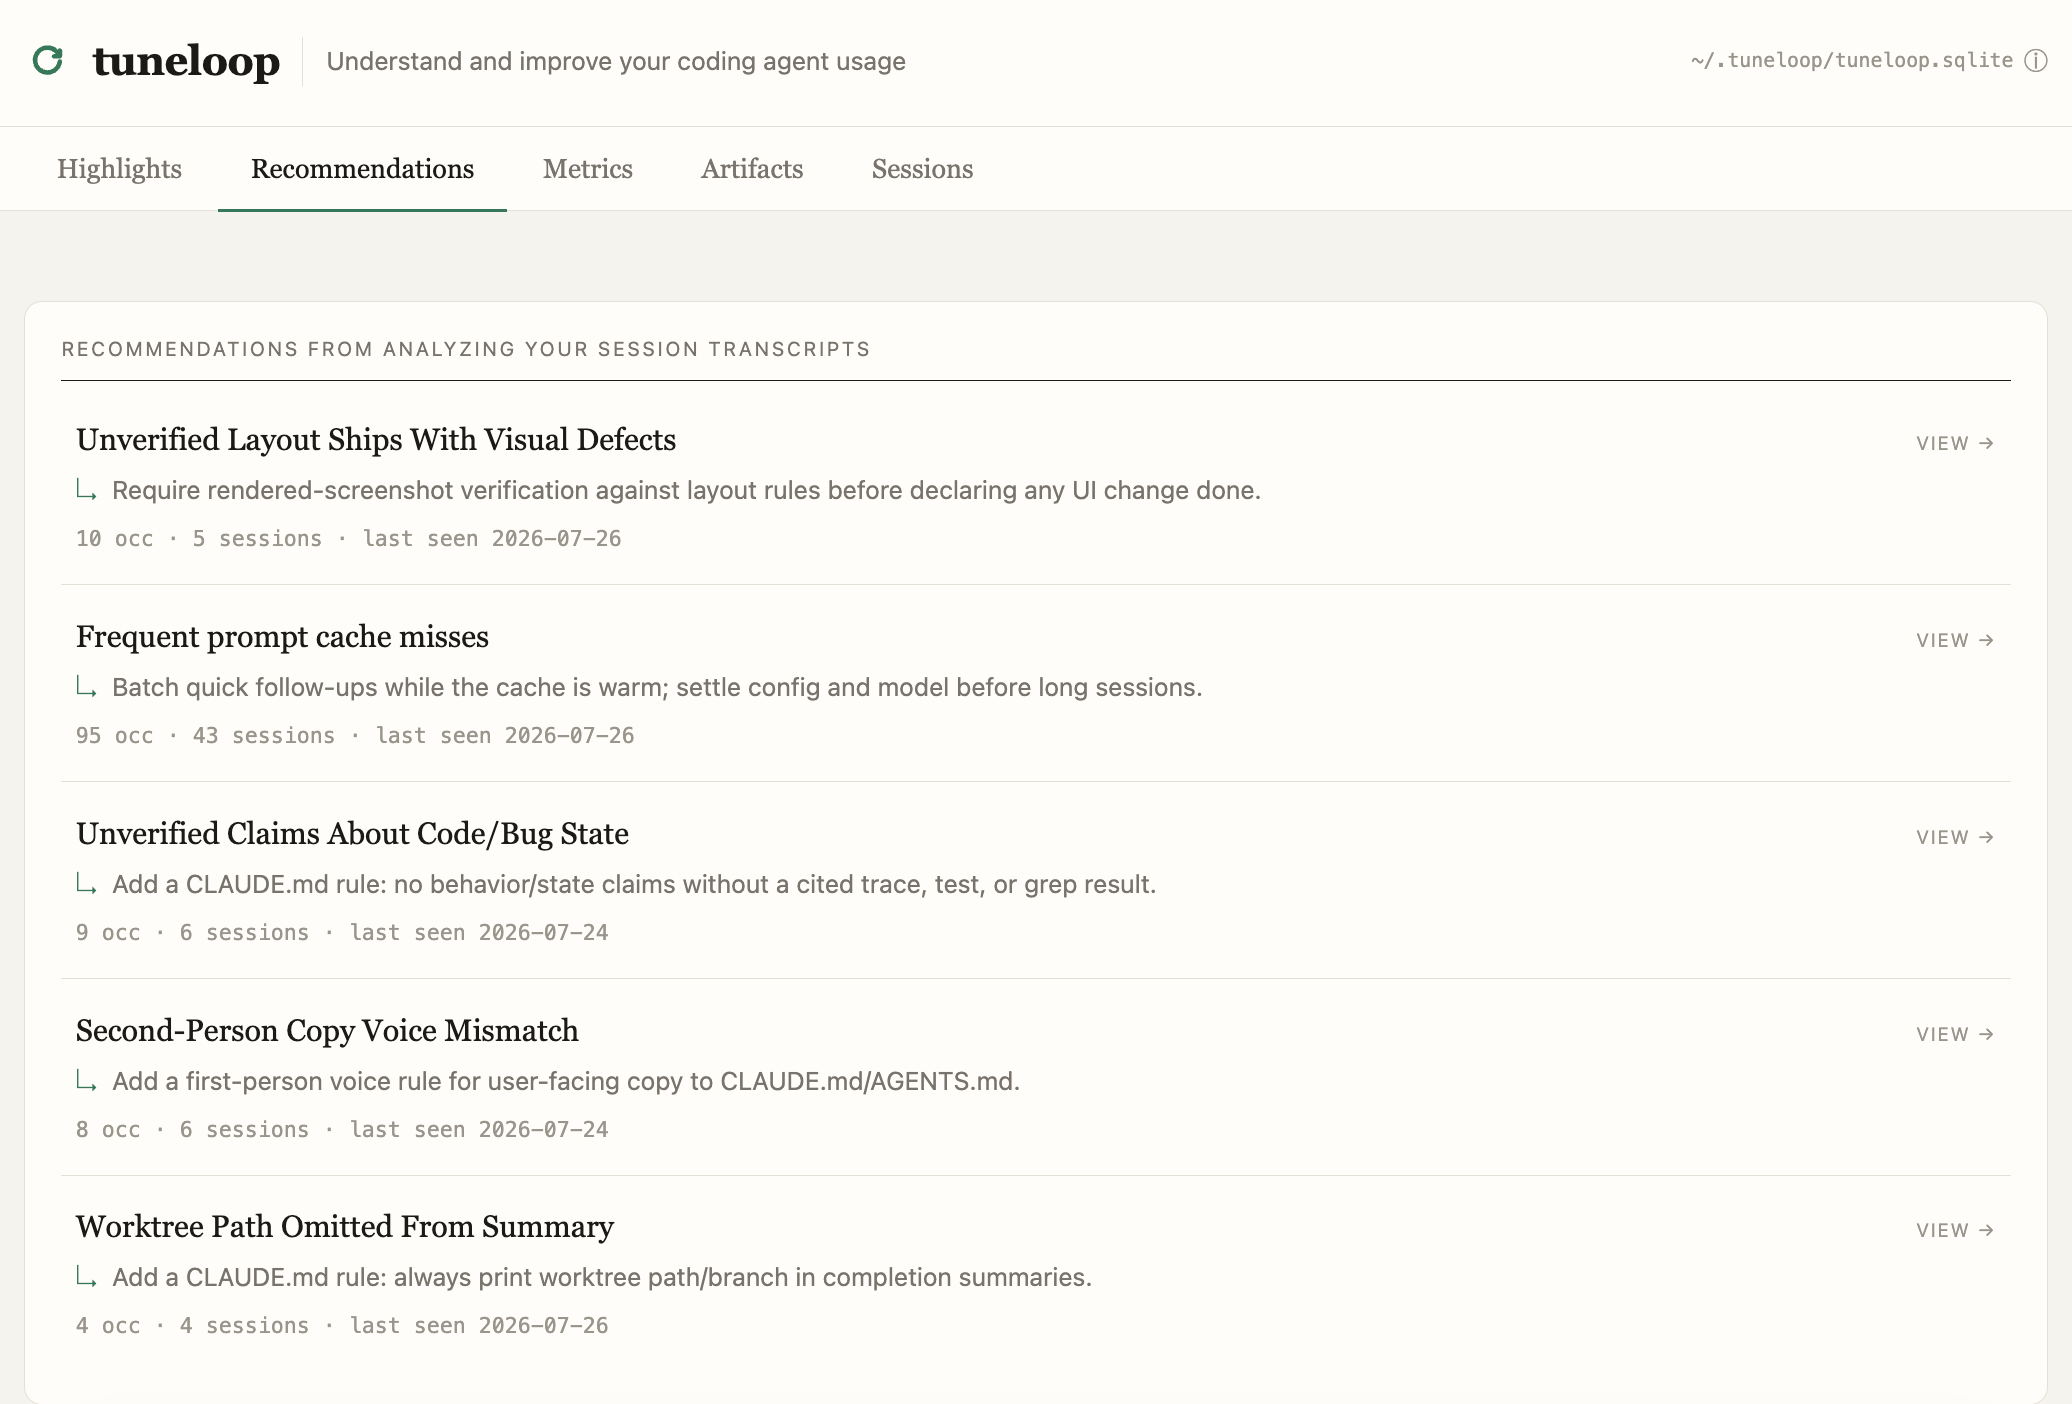
A set of **recommendations**, grounded in evidence from across your sessions,
that surface fixes for re-steering you repeatedly had to do, or deviations from
best practices.
## How it works
**Enrichment** labels each session in one LLM call:
- **Work type** — one of `plan` · `implement` · `debug` · `research` · `review` · `docs` · `other`.
- **Complexity** — one of `trivial` · `routine` · `substantial` · `open-ended`.
- **Autonomy** — how much the agent drove itself: `autonomous` · `guided` · `minimal`.
- **Feature** — links the session to a shipped feature, reusing your existing feature
names and proposing new ones. The taxonomy grows as you analyze, so related work
lands under one feature instead of fragmenting.
- **Success** — a judged outcome (`success` / `partial` / `failure`), surfaced as the
`session_success` outcome you can count.
**PR linking** connects a session to the PRs it produced, two ways:
- **Explicit** — the transcript shows the agent creating, merging, or reviewing a PR
(`gh pr create` / `gh pr review` / a GitHub MCP tool); live status comes from your
local `gh`.
- **Content-match** — for the common case where the agent writes the code and *you*
commit and push it (no `gh pr create` in the transcript), tuneloop matches the lines
the agent authored against your own PRs' diffs and links the best match.
See [ARCHITECTURE.md](./ARCHITECTURE.md#built-in-processors) for the detection rules.
**Block-level cost attribution** — a long session that touches several things isn't
billed as one lump. tuneloop splits it into blocks and attributes token cost per
block, so a per-PR or per-feature cost reflects only the work that went into it.
→ [how blocks work](./ARCHITECTURE.md#blocks-and-cost-attribution-srccoreblocksts)
**Metrics** — the five dashboard headlines (outcome rate, cost per shipped artifact,
total spend, sessions, tool error rate) are each explained in
[ARCHITECTURE.md](./ARCHITECTURE.md#the-metrics-explained).
**Detection of recurring agent re-work / re-steer themes** — LLM-based analysis
that identifies patterns from across your sessions where you had to step in and
course-correct. Surfaces recommendations to fix these — updates to agent files
(CLAUDE.md / AGENTS.md), skills, tooling or config.
**Identification of deviations from best practices** — Deterministic and
LLM-as-a-judge checkers that look at things like cache hit rate, context
management, and unused startup bloat. Surfaces recommendations to fix these —
updates to config, or simply an informational nudge.
## Query it from your coding agent
Everything on the dashboard is a query over the store — and so is anything it
*doesn't* show. `tuneloop query` runs read-only SQL over that store, straight from
your terminal or your coding agent's shell:
```bash
tuneloop query "SELECT model, SUM(cost_usd) FROM usage_facts GROUP BY 1 ORDER BY 2 DESC"
tuneloop query --schema # tables, facets, and measures — learn the shape first
```
Only `SELECT` / `WITH … SELECT` run; writes and raw transcripts are off-limits.
Because it needs no server and speaks plain SQL, it's a natural fit for Claude Code
and other agents. Install the bundled skill so your agent knows the schema and the
grain rules before it writes a query:
```bash
npx skills add tuneloop/tuneloop
```
Then just ask — *"Query tuneloop: what did I spend per model last week?"* — and the agent writes
the SQL, runs it, and reads back the answer.
## LLM enrichment
To label each session with a work type, complexity, autonomy, and an LLM-judged
success signal — and to name the features you shipped — point tuneloop at **your
own** LLM key. Your session data goes only to the provider you choose:
```bash
export TUNELOOP_LLM_PROVIDER=anthropic
export ANTHROPIC_API_KEY=sk-ant-...
# optional: export TUNELOOP_LLM_MODEL=claude-haiku-4-5 # base (per-session) model
# optional: export TUNELOOP_LLM_MODEL_HEAVY=claude-sonnet-5 # detector model — auto-selected for anthropic; set to override
npx tuneloop analyze
```
Or skip the env setup: run `npx tuneloop analyze` in a terminal and, when no
provider is configured, it offers to set one up interactively — pick a provider,
paste a key (input hidden), and that run enriches. If the provider's key is
already exported (e.g. `ANTHROPIC_API_KEY`), it's picked up without asking. The
key is never written to disk; the run ends by printing the `export` lines that
make it permanent.
Pick a preset and supply its key; the model defaults sensibly and is overridable
with `TUNELOOP_LLM_MODEL` (or `--llm-model`). Anthropic, OpenAI, and AWS Bedrock
are native; everything else speaks the OpenAI-compatible API.
| `TUNELOOP_LLM_PROVIDER` | Key env | Notes |
|---|---|---|
| `anthropic` | `ANTHROPIC_API_KEY` | native |
| `openai` | `OPENAI_API_KEY` | native |
| `bedrock` | `AWS_BEARER_TOKEN_BEDROCK` _(or standard AWS credentials)_ | Claude via AWS; set `AWS_REGION` |
| `openrouter` | `OPENROUTER_API_KEY` | 400+ models via one key |
| `groq` | `GROQ_API_KEY` | fast; free tier |
| `deepseek` | `DEEPSEEK_API_KEY` | |
| `gemini` | `GEMINI_API_KEY` | Google, OpenAI-compatible endpoint |
| `together` / `fireworks` / `xai` | `TOGETHER_API_KEY` / `FIREWORKS_API_KEY` / `XAI_API_KEY` | |
| `ollama` | _(none)_ | local; `http://localhost:11434` |
| `openai-compatible` | `TUNELOOP_LLM_API_KEY` | any other host; set `TUNELOOP_LLM_BASE_URL` |
| `openai-compatible-nokey` | _(none)_ | keyless gateway; set `TUNELOOP_LLM_BASE_URL`, auth via `TUNELOOP_LLM_HEADERS` |
```bash
# A hosted provider — name it, never type a URL:
TUNELOOP_LLM_PROVIDER=openrouter OPENROUTER_API_KEY=sk-or-... \
npx tuneloop analyze --llm-model deepseek/deepseek-chat
# Fully local, no key, nothing leaves your machine:
npx tuneloop analyze --llm-provider ollama --llm-model qwen2.5
# AWS Bedrock — a Bedrock API key, or any standard AWS credentials (SigV4):
TUNELOOP_LLM_PROVIDER=bedrock AWS_BEARER_TOKEN_BEDROCK=... AWS_REGION=us-east-1 \
npx tuneloop analyze
# The default model is a US inference profile; other regions pick theirs, e.g.
# --llm-model eu.anthropic.claude-haiku-4-5-20251001-v1:0
# Any other OpenAI-compatible host:
TUNELOOP_LLM_PROVIDER=openai-compatible TUNELOOP_LLM_BASE_URL=https://host/v1 \
TUNELOOP_LLM_API_KEY=… npx tuneloop analyze --llm-model my-model
# An intranet / self-hosted gateway with no API key, authenticated by headers
# (e.g. a LiteLLM proxy or an internal gateway):
TUNELOOP_LLM_PROVIDER=openai-compatible-nokey TUNELOOP_LLM_BASE_URL=https://gateway.internal/v1 \
TUNELOOP_LLM_HEADERS='{"x-user-id":"u-123","x-team":"platform"}' \
npx tuneloop analyze --llm-model my-model
```
Enrichment is one structured **tool call** per session, so use a
tool-call-capable model (all the hosted defaults qualify). Flags override the env
for one run; the API key is never a flag — set it in the env or paste it at the
interactive prompt. For a gateway that authenticates by request headers instead of
a key, use `openai-compatible-nokey` and pass the headers as a JSON object in
`TUNELOOP_LLM_HEADERS` (applied to every request; a malformed value warns and
enrichment stays off rather than sending unauthenticated requests). It's inexpensive: analyzing ~100 sessions runs about **$6**
with the default pairing — a cheap model (e.g. Claude Haiku) for the per-session
enrichment and a Sonnet-class heavy model for the cross-session recommendation
detectors. This cost shows up as **Analysis spend** in the summary,
priced from a built-in table with an OpenRouter public price list filling gaps
(cached under `~/.tuneloop/`).
**Two model tiers.** The work splits into two shapes: per-session enrichment is one
call per session (the volume — a cheap model is the right call), while a few
detectors make cross-session synthesis calls where reasoning quality shows up in
the insights. Detectors opt into the stronger tier individually — today the
**recurring-themes** detector does; the rest stay on the base model. On the
built-in providers with a strong sibling (Anthropic, OpenAI, Bedrock, OpenRouter,
Gemini), that heavy model is **selected automatically**, so the recommendations
work out of the box. Override it with `TUNELOOP_LLM_MODEL_HEAVY` (or
`--llm-model-heavy`) — a sibling model on the same provider:
```bash
TUNELOOP_LLM_PROVIDER=anthropic ANTHROPIC_API_KEY=sk-ant-... \
npx tuneloop analyze --llm-model claude-haiku-4-5 --llm-model-heavy claude-sonnet-5
```
Same provider, key, and base URL as `TUNELOOP_LLM_MODEL` — only the model id
differs. Leave it unset and tuneloop uses the provider's default heavy model where
it has one (the strong siblings above) — unless your base model already clears the
Sonnet-class tier, in which case detectors just reuse it. A provider with no strong
sibling falls back to the base model, which skips **recurring-themes** (with a
warning) when that model is below the tier. Changing it re-analyzes the full corpus for the
detectors that use it, since extractions made by the old model aren't comparable to
the new one's.
**Keeping analysis spend down.** The automatic heavy model is what makes the recommendations
work out of the box, but it does raise per-run spend over an enrichment-only run. Two
ways to opt out:
- **Turn off the automatic heavy model** — set `TUNELOOP_DISABLE_DEFAULT_LLM_HEAVY=1`.
Every detector then runs on your base (cheap) model, and **recurring-themes** skips
itself with a warning (it's gated to a Sonnet-class model). This only suppresses the
*default* — an explicit `TUNELOOP_LLM_MODEL_HEAVY` / `--llm-model-heavy` still wins,
so you can disable the auto-pick yet still opt a single run into a heavy model.
- **Turn off the heavy detector(s)** — disable them in `config.json` and pass it with
`--config`. `recurring-themes` is the only detector that uses the heavy model, so
disabling it removes all heavy-model spend while the rest of the recommendations keep
running; disable `kitchen-sink` too to drop the remaining (base-model) LLM detector:
```json
{
"detectors": {
"recurring-themes": { "enabled": false },
"kitchen-sink": { "enabled": false }
}
}
```
**Local Ollama** needs a bigger context window and a capable model: the enrichment
prompt is ~4–6k tokens but Ollama's ~2k default silently truncates it, so start the
server with `OLLAMA_CONTEXT_LENGTH=8192 ollama serve` and use a tool-strong ≥7B
model like `qwen2.5:7b` (tiny models tool-call unreliably).
## Privacy
Transcripts are processed locally and results are written to a local SQLite store
(`~/.tuneloop/` by default). tuneloop never posts your **session data** anywhere —
the only thing that ever leaves is a transcript sent to the LLM provider whose key
you supply, and only if you enable enrichment. Its other network calls are
read-only and carry none of your data: your local `gh` for PR status and diffs
(your own GitHub auth), and OpenRouter's public price list to cost models the
built-in table doesn't know. To avoid sending transcripts off the machine at all,
enrich against a local model (`--llm-provider ollama`).
## Run from source
`npx tuneloop` is all most people need. To hack on tuneloop itself, run it from a
local checkout:
```bash
npm install
npm run dev -- analyze # builds, runs the CLI (args after `--`), then serves the dashboard
```
Or build once and call the binary directly:
```bash
npm run build
node dist/cli.js analyze
```
`npm link` gives you a global `tuneloop` backed by your local build. LLM
enrichment works the same way — set `TUNELOOP_LLM_PROVIDER` and its key before
running.
## Extending
Adding new analysis is one file: implement the `Processor` interface, declare any
sliceable facets, and register it — it shows up in the store and the dashboard (as
a card and a filter) automatically, no migration. To support a new AI tool, write
a `SourceAdapter`. See [ARCHITECTURE.md](./ARCHITECTURE.md).
## License
MIT