<!DOCTYPE html>

<html xmlns="http://www.w3.org/1999/xhtml">

<head>

<meta charset="utf-8" />
<meta http-equiv="Content-Type" content="text/html; charset=utf-8" />
<meta name="generator" content="pandoc" />


<meta name="author" content="Peter Carbonetto" />


<title>Divvy usage by time-of-day</title>

<script src="site_libs/jquery-1.11.3/jquery.min.js"></script>
<meta name="viewport" content="width=device-width, initial-scale=1" />
<link href="site_libs/bootstrap-3.3.5/css/readable.min.css" rel="stylesheet" />
<script src="site_libs/bootstrap-3.3.5/js/bootstrap.min.js"></script>
<script src="site_libs/bootstrap-3.3.5/shim/html5shiv.min.js"></script>
<script src="site_libs/bootstrap-3.3.5/shim/respond.min.js"></script>
<script src="site_libs/jqueryui-1.11.4/jquery-ui.min.js"></script>
<link href="site_libs/tocify-1.9.1/jquery.tocify.css" rel="stylesheet" />
<script src="site_libs/tocify-1.9.1/jquery.tocify.js"></script>
<script src="site_libs/navigation-1.1/tabsets.js"></script>
<link href="site_libs/highlightjs-1.1/textmate.css" rel="stylesheet" />
<script src="site_libs/highlightjs-1.1/highlight.js"></script>

<style type="text/css">code{white-space: pre;}</style>
<style type="text/css">
  pre:not([class]) {
    background-color: white;
  }
</style>
<script type="text/javascript">
if (window.hljs && document.readyState && document.readyState === "complete") {
   window.setTimeout(function() {
      hljs.initHighlighting();
   }, 0);
}
</script>


<style type="text/css">
h1 {
  font-size: 34px;
}
h1.title {
  font-size: 38px;
}
h2 {
  font-size: 30px;
}
h3 {
  font-size: 24px;
}
h4 {
  font-size: 18px;
}
h5 {
  font-size: 16px;
}
h6 {
  font-size: 12px;
}
.table th:not([align]) {
  text-align: left;
}
</style>


</head>

<body>

<style type = "text/css">
.main-container {
  max-width: 940px;
  margin-left: auto;
  margin-right: auto;
}
code {
  color: inherit;
  background-color: rgba(0, 0, 0, 0.04);
}
img {
  max-width:100%;
  height: auto;
}
.tabbed-pane {
  padding-top: 12px;
}
button.code-folding-btn:focus {
  outline: none;
}
</style>


<style type="text/css">
/* padding for bootstrap navbar */
body {
  padding-top: 66px;
  padding-bottom: 40px;
}
/* offset scroll position for anchor links (for fixed navbar)  */
.section h1 {
  padding-top: 71px;
  margin-top: -71px;
}

.section h2 {
  padding-top: 71px;
  margin-top: -71px;
}
.section h3 {
  padding-top: 71px;
  margin-top: -71px;
}
.section h4 {
  padding-top: 71px;
  margin-top: -71px;
}
.section h5 {
  padding-top: 71px;
  margin-top: -71px;
}
.section h6 {
  padding-top: 71px;
  margin-top: -71px;
}
</style>

<script>
// manage active state of menu based on current page
$(document).ready(function () {
  // active menu anchor
  href = window.location.pathname
  href = href.substr(href.lastIndexOf('/') + 1)
  if (href === "")
    href = "index.html";
  var menuAnchor = $('a[href="' + href + '"]');

  // mark it active
  menuAnchor.parent().addClass('active');

  // if it's got a parent navbar menu mark it active as well
  menuAnchor.closest('li.dropdown').addClass('active');
});
</script>


<div class="container-fluid main-container">

<!-- tabsets -->
<script>
$(document).ready(function () {
  window.buildTabsets("TOC");
});
</script>

<!-- code folding -->


<script>
$(document).ready(function ()  {

    // move toc-ignore selectors from section div to header
    $('div.section.toc-ignore')
        .removeClass('toc-ignore')
        .children('h1,h2,h3,h4,h5').addClass('toc-ignore');

    // establish options
    var options = {
      selectors: "h1,h2,h3",
      theme: "bootstrap3",
      context: '.toc-content',
      hashGenerator: function (text) {
        return text.replace(/[.\\/?&!#<>]/g, '').replace(/\s/g, '_').toLowerCase();
      },
      ignoreSelector: ".toc-ignore",
      scrollTo: 0
    };
    options.showAndHide = true;
    options.smoothScroll = true;

    // tocify
    var toc = $("#TOC").tocify(options).data("toc-tocify");
});
</script>

<style type="text/css">

#TOC {
  margin: 25px 0px 20px 0px;
}
@media (max-width: 768px) {
#TOC {
  position: relative;
  width: 100%;
}
}


.toc-content {
  padding-left: 30px;
  padding-right: 40px;
}

div.main-container {
  max-width: 1200px;
}

div.tocify {
  width: 20%;
  max-width: 260px;
  max-height: 85%;
}

@media (min-width: 768px) and (max-width: 991px) {
  div.tocify {
    width: 25%;
  }
}

@media (max-width: 767px) {
  div.tocify {
    width: 100%;
    max-width: none;
  }
}

.tocify ul, .tocify li {
  line-height: 20px;
}

.tocify-subheader .tocify-item {
  font-size: 0.90em;
  padding-left: 25px;
  text-indent: 0;
}

.tocify .list-group-item {
  border-radius: 0px;
}


</style>

<!-- setup 3col/9col grid for toc_float and main content  -->
<div class="row-fluid">
<div class="col-xs-12 col-sm-4 col-md-3">
<div id="TOC" class="tocify">
</div>
</div>

<div class="toc-content col-xs-12 col-sm-8 col-md-9">


<div class="navbar navbar-default  navbar-fixed-top" role="navigation">
  <div class="container">
    <div class="navbar-header">
      <button type="button" class="navbar-toggle collapsed" data-toggle="collapse" data-target="#navbar">
        <span class="icon-bar"></span>
        <span class="icon-bar"></span>
        <span class="icon-bar"></span>
      </button>
      <a class="navbar-brand" href="index.html">Divvy data exploration</a>
    </div>
    <div id="navbar" class="navbar-collapse collapse">
      <ul class="nav navbar-nav">
        <li>
  <a href="index.html">Overview</a>
</li>
<li>
  <a href="setup.html">Setup</a>
</li>
<li>
  <a href="license.html">License</a>
</li>
      </ul>
      <ul class="nav navbar-nav navbar-right">
        <li>
  <a href="https://github.com/pcarbo/wflow-divvy">source</a>
</li>
      </ul>
    </div><!--/.nav-collapse -->
  </div><!--/.container -->
</div><!--/.navbar -->

<div class="fluid-row" id="header">


<h1 class="title toc-ignore">Divvy usage by time-of-day</h1>
<h4 class="author"><em>Peter Carbonetto</em></h4>

</div>


<!-- Define defaults shared by all workflowr files. -->
<!-- Update knitr chunk options -->
<!-- Insert the date the file was last updated -->
<p><strong>Last updated:</strong> 2017-07-06</p>
<!-- Insert the code version (Git commit SHA1) if Git repository
 exists and R package git2r is installed -->
<p><strong>Code version:</strong> 426d238</p>
<p>Here we use the Divvy trip data to examine biking trends over the course of a typical day in Chicago.</p>
<p>I begin by loading a few packages, as well as some additional functions I wrote for this project.</p>
<pre class="r"><code>library(data.table)
library(ggplot2)
source(&quot;../code/functions.R&quot;)</code></pre>
<p><br></p>
<div id="read-the-data" class="section level2">
<h2>Read the data</h2>
<p>Following <a href="first-glance.html">my earlier steps</a>, I use function <code>read.divvy.data</code> to read the trip and station data from the CSV files.</p>
<pre class="r"><code>divvy &lt;- read.divvy.data()
# Reading station data from ../data/Divvy_Stations_2016_Q4.csv.
# Reading trip data from ../data/Divvy_Trips_2016_Q1.csv.
# Reading trip data from ../data/Divvy_Trips_2016_04.csv.
# Reading trip data from ../data/Divvy_Trips_2016_05.csv.
# Reading trip data from ../data/Divvy_Trips_2016_06.csv.
# Reading trip data from ../data/Divvy_Trips_2016_Q3.csv.
# Reading trip data from ../data/Divvy_Trips_2016_Q4.csv.
# Preparing Divvy data for analysis in R.
# Converting dates and times.</code></pre>
<p>To make it easier to compile statistics by time of day, I convert the “start hour” column to a factor (<em>i.e.</em>, categorical variable).</p>
<pre class="r"><code>divvy$trips &lt;- transform(divvy$trips,start.hour = factor(start.hour,0:23))</code></pre>
<p><br></p>
</div>
<div id="count-departures-by-time-of-day" class="section level2">
<h2>Count departures by time-of-day</h2>
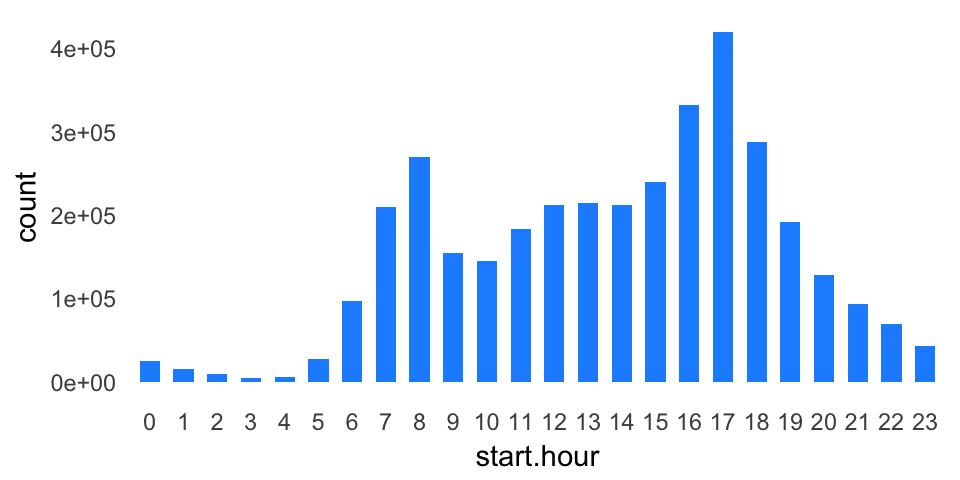
<p>Now that <code>start.hour</code> is a factor, it is easy to create a bar chart showing the total number of departures at each hour.</p>
<p>Unsurprisingly, there is very little biking activity at night.</p>
<p>Further, the two peaks (“modes”) in the bar chart nicely recapitulate the morning and afternoon rush hours.</p>
<pre class="r"><code>ggplot(divvy$trips,aes(start.hour)) +
  geom_bar(fill = &quot;dodgerblue&quot;,width = 0.6) +
  theme_minimal() +
  theme(panel.grid.major = element_blank(),
        panel.grid.minor = element_blank())</code></pre>
<p><img src="figure/time-of-day-trends.Rmd/timeofday-barchart-1.png" width="480" style="display: block; margin: auto;" /></p>
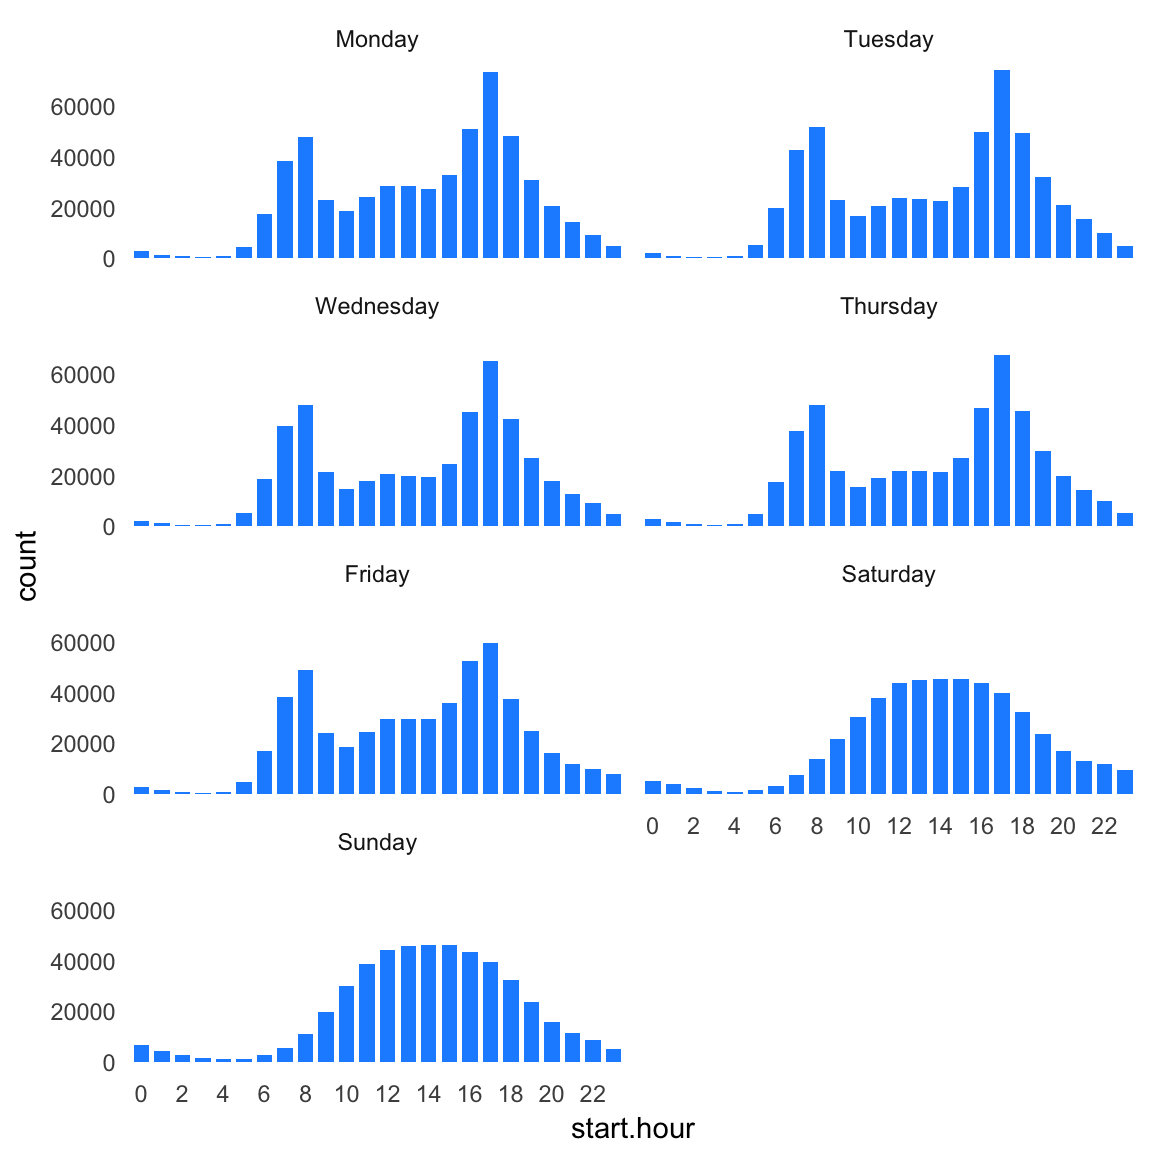
<p>This summary is a bit muddled because it is counting trips during the week and on the weekends. Once we separate the counts by the day of the week, the rush-hour trends become more striking. (Also notice that the rush hours disappear on Saturday and Sunday.)</p>
<pre class="r"><code>ggplot(divvy$trips,aes(start.hour)) +
  geom_bar(fill = &quot;dodgerblue&quot;,width = 0.75) +
  facet_wrap(~start.day,ncol = 2) +
  scale_x_discrete(breaks = seq(0,24,2)) +
  theme_minimal() +
  theme(panel.grid.major = element_blank(),
        panel.grid.minor = element_blank())</code></pre>
<p><img src="figure/time-of-day-trends.Rmd/timeofday-barchart-2-1.png" width="576" style="display: block; margin: auto;" /> <br></p>
</div>
<div id="time-of-day-trends-at-university-of-chicago" class="section level2">
<h2>Time-of-day trends at University of Chicago</h2>
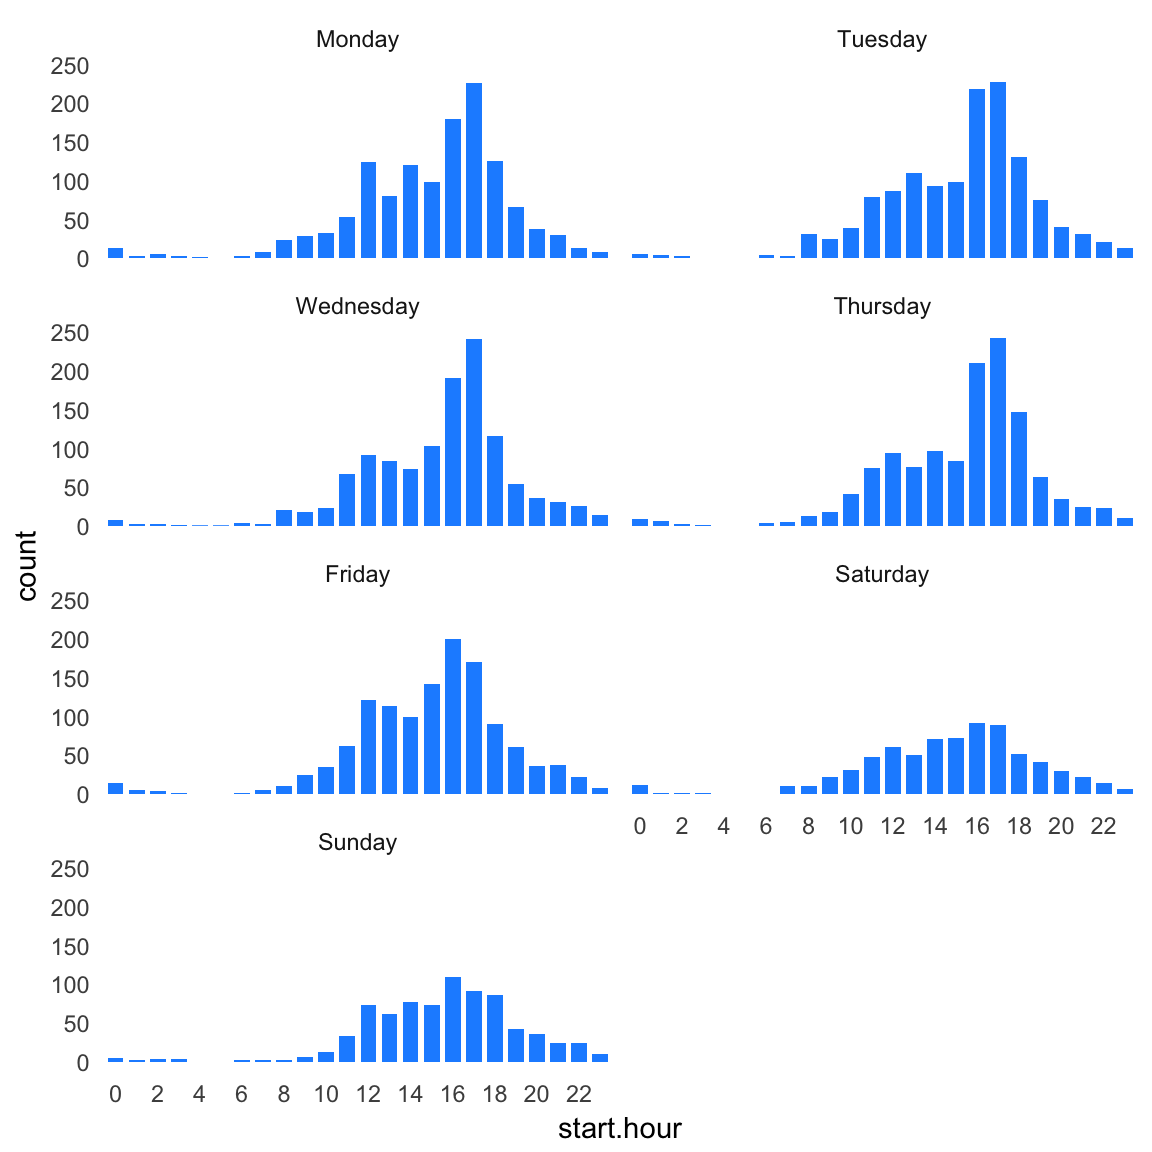
<p>The commuting trends are different at the University of Chicago Divvy station—there isn’t much of a morning rush hour. This may be because students and staff don’t regularly use the Divvy bikes for commuting.</p>
<pre class="r"><code>ggplot(subset(divvy$trips,from_station_name == &quot;University Ave &amp; 57th St&quot;),
       aes(start.hour)) +
  geom_bar(fill = &quot;dodgerblue&quot;,width = 0.75) +
  facet_wrap(~start.day,ncol = 2) +
  scale_x_discrete(breaks = seq(0,24,2)) +
  theme_minimal() +
  theme(panel.grid.major = element_blank(),
        panel.grid.minor = element_blank())</code></pre>
<p><img src="figure/time-of-day-trends.Rmd/timeofday-uchicago-barchart-1.png" width="576" style="display: block; margin: auto;" /></p>
<p><br></p>
</div>
<div id="session-information" class="section level2">
<h2>Session information</h2>
<p>This is the version of R and the packages that were used to generate these results.</p>
<pre class="r"><code>sessionInfo()
# R version 3.3.2 (2016-10-31)
# Platform: x86_64-apple-darwin13.4.0 (64-bit)
# Running under: macOS Sierra 10.12.5
# 
# locale:
# [1] en_US.UTF-8/en_US.UTF-8/en_US.UTF-8/C/en_US.UTF-8/en_US.UTF-8
# 
# attached base packages:
# [1] stats     graphics  grDevices utils     datasets  methods   base     
# 
# other attached packages:
# [1] ggplot2_2.2.1     data.table_1.10.4
# 
# loaded via a namespace (and not attached):
#  [1] Rcpp_0.12.11     assertthat_0.2.0 digest_0.6.12    rprojroot_1.2   
#  [5] plyr_1.8.4       grid_3.3.2       gtable_0.2.0     backports_1.0.5 
#  [9] git2r_0.18.0     magrittr_1.5     scales_0.4.1     evaluate_0.10.1 
# [13] stringi_1.1.2    lazyeval_0.2.0   rmarkdown_1.6    labeling_0.3    
# [17] tools_3.3.2      stringr_1.2.0    munsell_0.4.3    yaml_2.1.14     
# [21] colorspace_1.3-2 htmltools_0.3.6  knitr_1.16       tibble_1.2</code></pre>
</div>

<hr>
<p>
    This <a href="http://rmarkdown.rstudio.com">R Markdown</a> site was created with <a href="https://github.com/jdblischak/workflowr">workflowr</a>
</p>
<hr>

<!-- To enable disqus, uncomment the section below and provide your disqus_shortname -->

<!-- disqus
  <div id="disqus_thread"></div>
    <script type="text/javascript">
        /* * * CONFIGURATION VARIABLES: EDIT BEFORE PASTING INTO YOUR WEBPAGE * * */
        var disqus_shortname = 'rmarkdown'; // required: replace example with your forum shortname

        /* * * DON'T EDIT BELOW THIS LINE * * */
        (function() {
            var dsq = document.createElement('script'); dsq.type = 'text/javascript'; dsq.async = true;
            dsq.src = '//' + disqus_shortname + '.disqus.com/embed.js';
            (document.getElementsByTagName('head')[0] || document.getElementsByTagName('body')[0]).appendChild(dsq);
        })();
    </script>
    <noscript>Please enable JavaScript to view the <a href="http://disqus.com/?ref_noscript">comments powered by Disqus.</a></noscript>
    <a href="http://disqus.com" class="dsq-brlink">comments powered by <span class="logo-disqus">Disqus</span></a>
-->


</div>
</div>

</div>

<script>

// add bootstrap table styles to pandoc tables
function bootstrapStylePandocTables() {
  $('tr.header').parent('thead').parent('table').addClass('table table-condensed');
}
$(document).ready(function () {
  bootstrapStylePandocTables();
});


</script>

<!-- dynamically load mathjax for compatibility with self-contained -->
<script>
  (function () {
    var script = document.createElement("script");
    script.type = "text/javascript";
    script.src  = "https://mathjax.rstudio.com/latest/MathJax.js?config=TeX-AMS-MML_HTMLorMML";
    document.getElementsByTagName("head")[0].appendChild(script);
  })();
</script>

</body>
</html>