Quality_metrics
Siming Zhao
Last updated: 2018-12-02
workflowr checks: (Click a bullet for more information)-
✖ R Markdown file: uncommitted changes
The R Markdown file has unstaged changes. To know which version of the R Markdown file created these results, you’ll want to first commit it to the Git repo. If you’re still working on the analysis, you can ignore this warning. When you’re finished, you can runwflow_publishto commit the R Markdown file and build the HTML. -
✔ Environment: empty
Great job! The global environment was empty. Objects defined in the global environment can affect the analysis in your R Markdown file in unknown ways. For reproduciblity it’s best to always run the code in an empty environment.
-
✔ Seed:
set.seed(20181119)The command
set.seed(20181119)was run prior to running the code in the R Markdown file. Setting a seed ensures that any results that rely on randomness, e.g. subsampling or permutations, are reproducible. -
✔ Session information: recorded
Great job! Recording the operating system, R version, and package versions is critical for reproducibility.
-
Great! You are using Git for version control. Tracking code development and connecting the code version to the results is critical for reproducibility. The version displayed above was the version of the Git repository at the time these results were generated.✔ Repository version: c206c9d
Note that you need to be careful to ensure that all relevant files for the analysis have been committed to Git prior to generating the results (you can usewflow_publishorwflow_git_commit). workflowr only checks the R Markdown file, but you know if there are other scripts or data files that it depends on. Below is the status of the Git repository when the results were generated:
Note that any generated files, e.g. HTML, png, CSS, etc., are not included in this status report because it is ok for generated content to have uncommitted changes.Ignored files: Ignored: .Rproj.user/ Ignored: analysis/Quality_metrics_cache/ Ignored: analysis/figure/ Untracked files: Untracked: data/DE_input.Rd Unstaged changes: Modified: analysis/Quality_metrics.Rmd
Expand here to see past versions:
Number of guide RNAs per cell
- number of cells with guide RNA =1 From Siwei’s cellranger run:
library(Matrix)
matrix_dir = "/Volumes/CROP-seq/data_from_Siwei/Xin_scRNA_seq_05Nov2018/filtered_gene_bc_matrices/CellRanger_index/"
matrix.path <- paste0(matrix_dir, "matrix.mtx")
dm <- readMM(file = matrix.path)
dm1 <- tail(dm,n=76)
length(colSums(dm1)[colSums(dm1)==1])
[1] 440From Alan’s cellranger run:
matrix_dir1 = "/Volumes/CROP-seq/NSC0507_cellranger/outs/filtered_gene_bc_matrices/cellranger_ref/"
matrix.path1 <- paste0(matrix_dir1, "matrix.mtx")
mattemp1 <- readMM(file = matrix.path1)
mattemp11 <- tail(mattemp1,n=76)
length(colSums(mattemp11)[colSums(mattemp11)==1])
[1] 266matrix_dir2 = "/Volumes/CROP-seq/NSC08_cellranger/outs/filtered_gene_bc_matrices/cellranger_ref/"
matrix.path2 <- paste0(matrix_dir2, "matrix.mtx")
mattemp2 <- readMM(file = matrix.path2)
mattemp21 <- tail(mattemp2,n=76)
length(colSums(mattemp21)[colSums(mattemp21)==1])[1] 190Note: in Alan’s original analysis conversion from h5 to csv step didn’t seem to work properly. if starting from matrix.mtx files. Siwei and Alan’s analyses gave the same results. So from now on, we will always start from Siwei’s matrix.mtx file.
- distribution of gRNA number per cell
barcode.path <- paste0(matrix_dir, "barcodes.tsv")
features.path <- paste0(matrix_dir, "genes.tsv")
feature.names = read.delim(features.path, header = FALSE,
                           stringsAsFactors = FALSE)
barcode.names = read.delim(barcode.path, header = FALSE,
                           stringsAsFactors = FALSE)
colnames(dm) = barcode.names$V1
rownames(dm) = feature.names$V1
dm1 <- tail(dm,n=76)
hist(colSums(dm1),breaks=3000,xlim=c(0,30),ylim=c(0,450), main="Distribution of gRNA number per cell", xlab= "#gRNA per cell")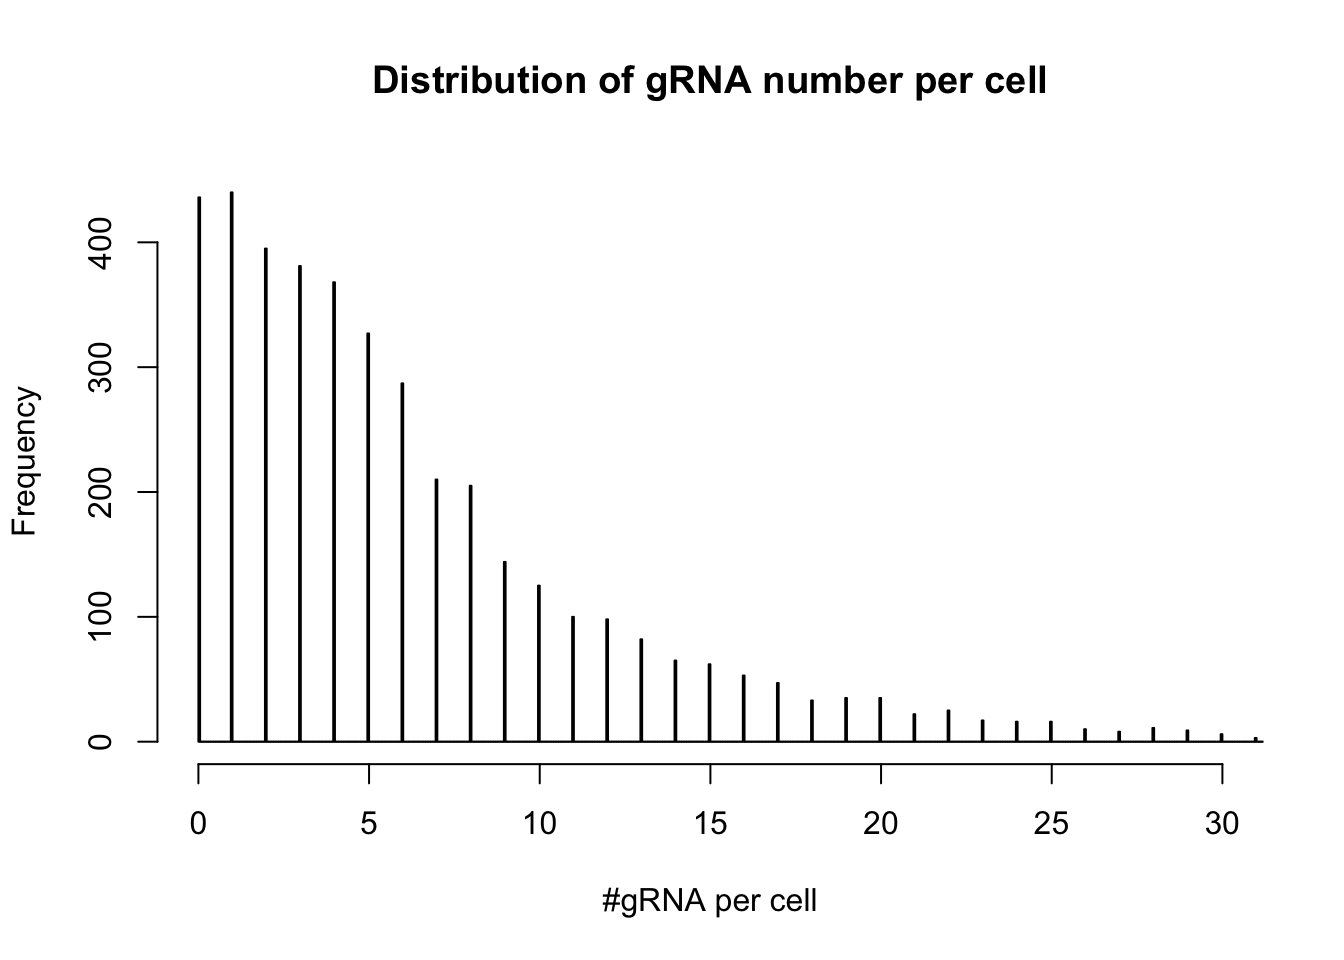
Expand here to see past versions of gRNAdist-1.png:
| Version | Author | Date |
|---|---|---|
| fdd5647 | szhao06 | 2018-12-01 |
number of cells targeted for each locus
library(dplyr)
Attaching package: 'dplyr'The following objects are masked from 'package:stats':
filter, lagThe following objects are masked from 'package:base':
intersect, setdiff, setequal, uniondm1df <- as.data.frame(as.matrix(dm1))
dm1df$label = sapply(strsplit(rownames(dm1),split = '_'), function(x){x[1]})
dm1dfagg = as.data.frame(dm1df %>% group_by(label) %>% summarise_all(funs(sum)))
row.names(dm1dfagg) =dm1dfagg$label
dm1dfagg$label =NULL- number of cells targeted for each locus
ncell <- apply(dm1dfagg,1, function (x) length(x[x>=1]))
barplot(ncell,las=2,cex.lab=1, main= "# cells targted for each locus")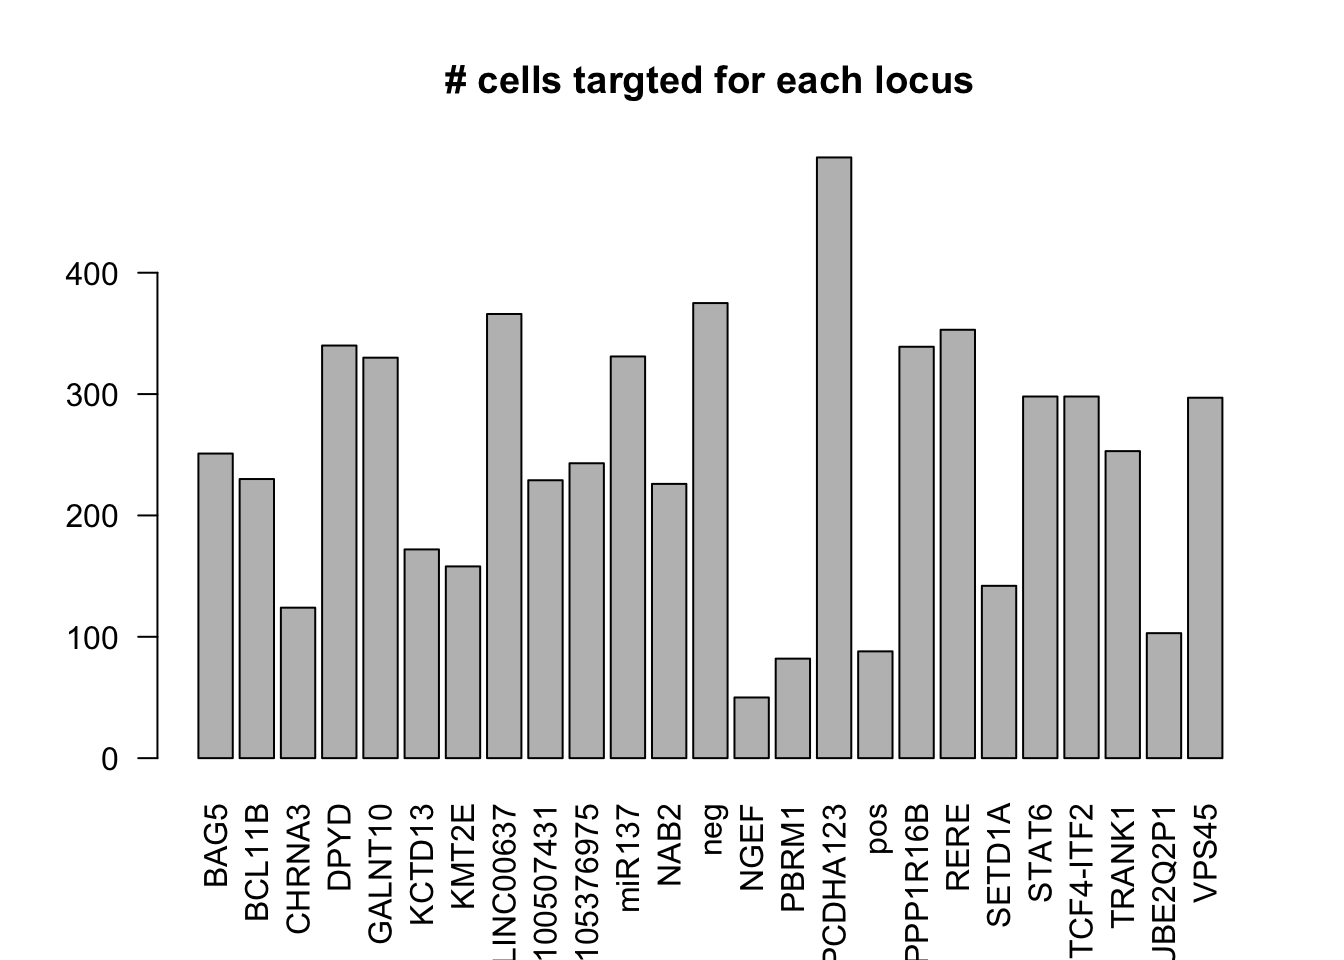
Expand here to see past versions of celldist1-1.png:
| Version | Author | Date |
|---|---|---|
| fdd5647 | szhao06 | 2018-12-01 |
- number of cells only targeted for that locus
# Singletons (cells with only 1 gRNA)
nlocus <- apply(dm1dfagg, 2, function (x) length(x[x>=1]))
hist(nlocus,breaks=100, main="number of targeted locus each cell")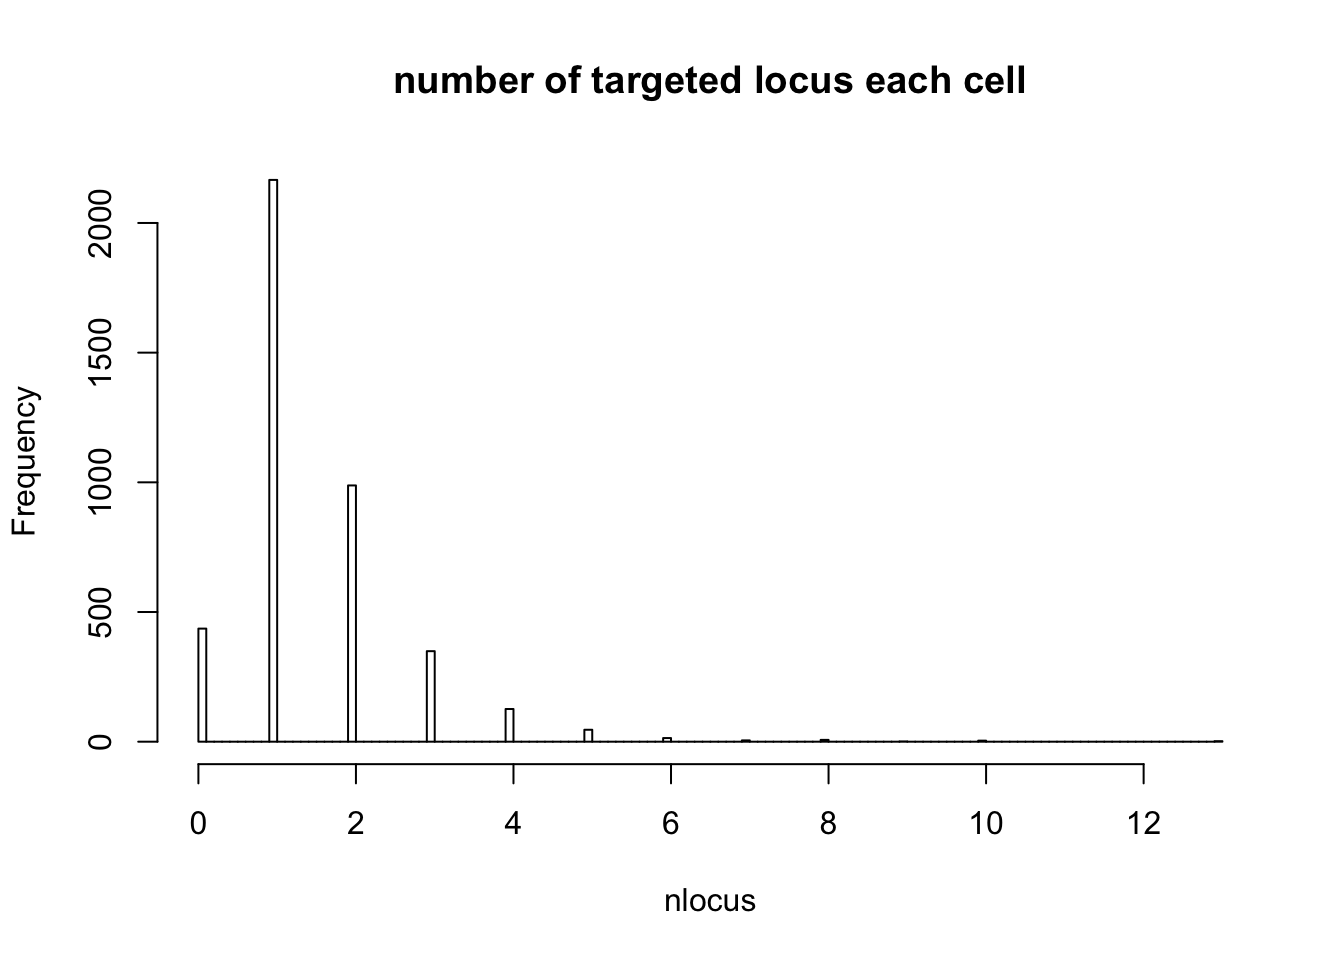
dm1dfagg.uni= dm1dfagg[,nlocus==1]

ncell.uni <- apply(dm1dfagg.uni,1, function (x) length(x[x>=1]))
barplot(ncell.uni,las=2,cex.lab=1,main= "# cells uniquely targted for each locus")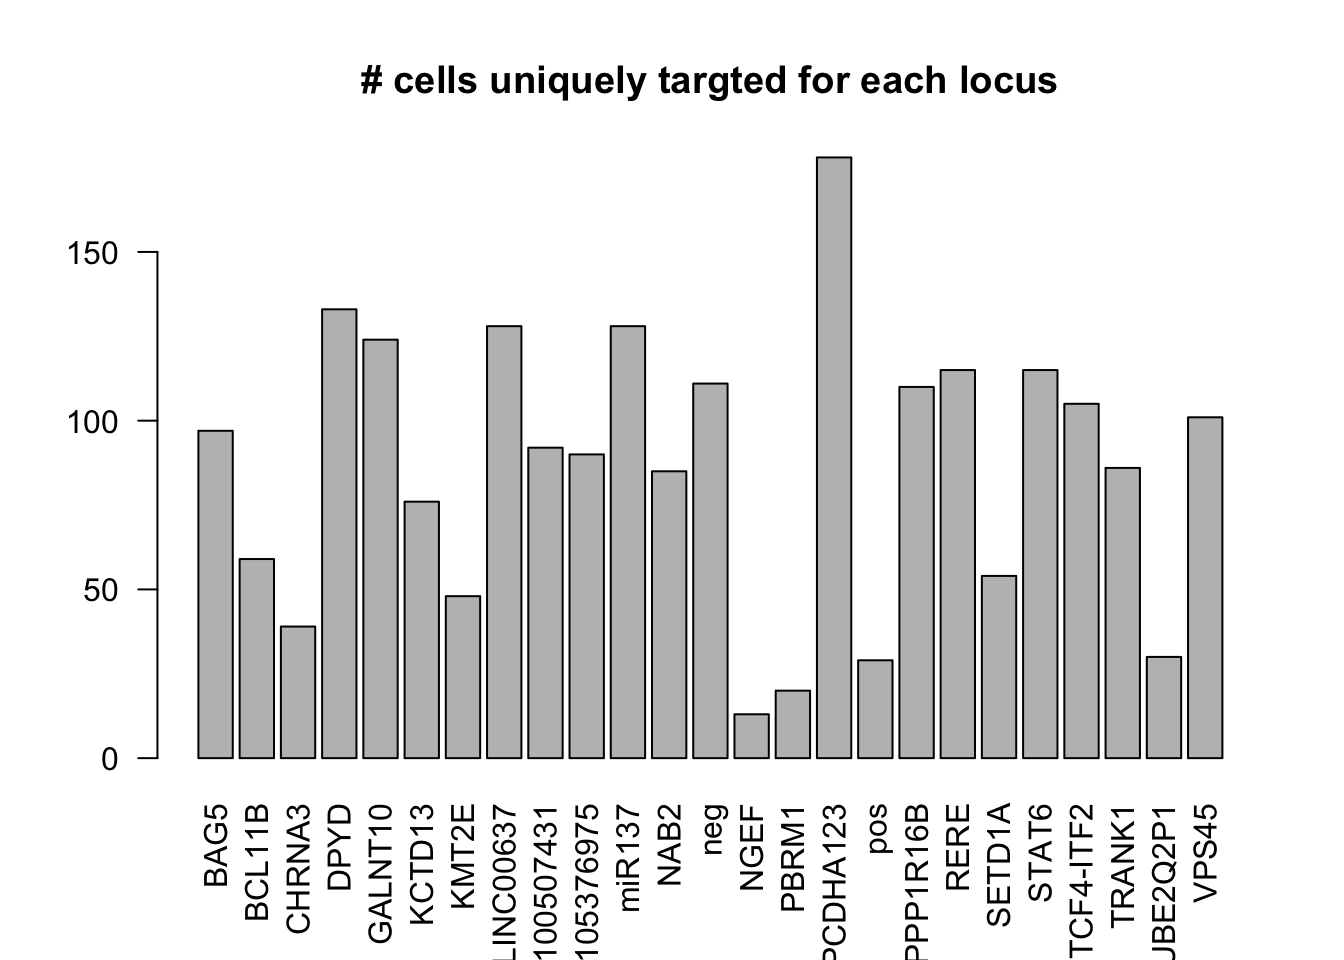
UMI count distribution for cells with unique targeted locus
# Singletons (cells with only 1 targeted locus)
dm.uni <- dm[,nlocus==1]
nUMI <- colSums(dm.uni)
hist(nUMI,breaks=100,xlim=c(0,1e5)) 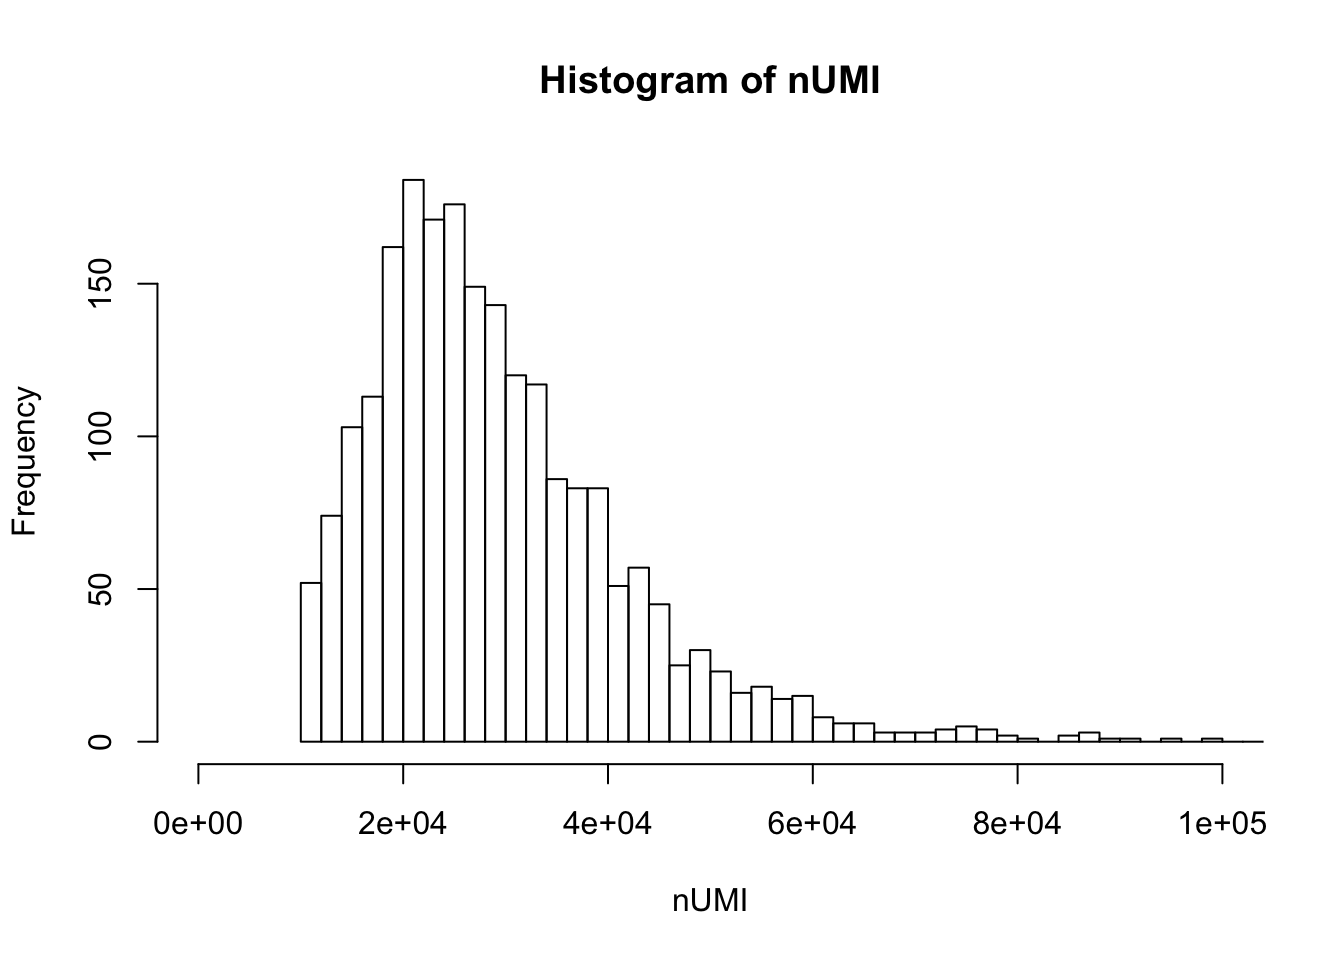
Prepare data for differential gene expression
save(dm1,dm1dfagg,nlocus, file="data/DE_input.Rd")Parameters used: * for a cell to be considered targeted uniquely at a locus: total read counts for the 3 gRNAs targeting that locus >1, total read counts for gRNA of other locus=0. * negative control: neg_EGFP and neg_CTRL are pooled together. * cells to be exluded due to low total UMI count: no filtering
Session information
sessionInfo()R version 3.3.2 (2016-10-31)
Platform: x86_64-apple-darwin11.4.2 (64-bit)
Running under: OS X El Capitan 10.11.6
locale:
[1] en_US.UTF-8/en_US.UTF-8/en_US.UTF-8/C/en_US.UTF-8/en_US.UTF-8
attached base packages:
[1] stats graphics grDevices utils datasets methods base
other attached packages:
[1] dplyr_0.7.5 Matrix_1.2-10
loaded via a namespace (and not attached):
[1] Rcpp_0.12.17 knitr_1.20 bindr_0.1.1
[4] whisker_0.3-2 magrittr_1.5 workflowr_1.1.1
[7] tidyselect_0.2.4 lattice_0.20-35 R6_2.2.2
[10] rlang_0.2.1 stringr_1.2.0 tools_3.3.2
[13] grid_3.3.2 R.oo_1.22.0 git2r_0.18.0
[16] htmltools_0.3.6 yaml_2.1.16 rprojroot_1.2
[19] digest_0.6.12 assertthat_0.2.0 tibble_1.4.2
[22] bindrcpp_0.2.2 purrr_0.2.5 R.utils_2.7.0
[25] glue_1.2.0 evaluate_0.10 rmarkdown_1.10
[28] stringi_1.1.5 pillar_1.2.3 backports_1.0.5
[31] R.methodsS3_1.7.1 pkgconfig_2.0.1 This reproducible R Markdown analysis was created with workflowr 1.1.1